PROTECTED SOURCE SCRIPT
Güncellendi Capitulation Scout
Capitulation Scout - Description
Overview
The Capitulation Scout is a streamlined technical indicator designed to identify potential market reversals by spotting moments of "capitulation" – extreme fear (bearish capitulation) or euphoria (bullish capitulation). It combines two independent filter groups to provide reliable reversal signals: an Extremes Filter (RSI + Bollinger Bands) and a Confirmation Filter (Volume Spike + MA Deviation). The indicator dynamically adapts to the current chart timeframe, making it versatile for day traders and long-term investors alike.
How It Works
This indicator uses two filter groups to detect capitulation, which can be enabled or disabled individually:
1. Extremes Filter (RSI + Bollinger Bands): Identifies overbought (default: RSI > 70) or oversold (default: RSI < 30) conditions combined with price breaking through the Bollinger Bands (default: 200-period, 2x multiplier), indicating an extreme price movement.
2. Confirmation Filter (Volume Spike + MA Deviation): Requires both a significant volume increase (default: 2x the 20-period average volume on lower timeframes, dynamically adjusted on higher timeframes) and a significant price deviation from a moving average (default: 5% deviation from a 50-period SMA) to confirm the capitulation event.
A signal is generated if at least one filter is enabled and all enabled filters meet their respective conditions.
Signals
- Bearish Capitulation: Marked with a red downward triangle (customizable in the "Style" tab) above the candle. Occurs when the enabled filters detect a potential top, e.g., overbought RSI and price above the upper Bollinger Band (if Extremes Filter enabled), and/or a volume spike combined with a significant upward deviation from the MA (if Confirmation Filter enabled).
- Bullish Capitulation: Marked with a green upward triangle (customizable in the "Style" tab) below the candle. Occurs when the enabled filters detect a potential bottom, e.g., oversold RSI and price below the lower Bollinger Band (if Extremes Filter enabled), and/or a volume spike combined with a significant downward deviation from the MA (if Confirmation Filter enabled).
Note: At least one filter must be enabled to generate signals. If both filters are disabled, no signals will be shown.
How to Use
1. Add the Capitulation Scout to your chart.
2. Look for red downward triangles (bearish capitulation) at market tops or green upward triangles (bullish capitulation) at market bottoms as potential reversal signals.
3. Use the signals in conjunction with other technical analysis tools (e.g., support/resistance levels, trendlines) to confirm trades.
4. Set up alerts for bearish or bullish capitulation signals to get real-time notifications.
5. Adjust the settings to suit your trading style and timeframe. For smaller timeframes (e.g., 5M or 15M), consider reducing the Bollinger Bands length for more sensitivity.
Settings
- Extremes Filter Settings
- Use Extremes Filter (RSI + Bollinger Bands): Enable/disable the RSI and Bollinger Bands filter (default: enabled).
- RSI Length: Period for RSI calculation (default: 14 periods, relative to the chart timeframe).
- RSI Overbought/Oversold Levels: Thresholds for overbought/oversold conditions (default: 70/30).
- Bollinger Bands Length/Multiplier: Settings for Bollinger Bands (default: 200 periods, 2x multiplier).
- Confirmation Filter Settings
- Use Confirmation Filter (Volume Spike + MA Deviation): Enable/disable the combined Volume Spike and MA Deviation filter (default: enabled). When enabled, both a volume spike and a significant MA deviation are required to meet the filter condition.
- Volume Spike Threshold (Base Multiplier): Multiplier for detecting volume spikes on lower timeframes (default: 2x the 20-period average). On higher timeframes (e.g., weekly or monthly), the threshold is dynamically reduced to be more sensitive (e.g., 1.5x on weekly, 1x on monthly).
- Moving Average Length: Period for the SMA (default: 50 periods, relative to the chart timeframe).
- MA Deviation Threshold (%): Percentage deviation from the MA to consider the price stretched (default: 5%).
Features
- MA Deviation Filter Visualization: The moving average used for the MA deviation filter can be enabled in the "Style" tab under "MA for Deviation Filter (Optional)" and is displayed in blue by default. It is disabled by default and must be manually enabled in the "Style" tab. Its color, line width, and style can be customized in the "Style" tab.
- Customizable Visuals: In the "Style" tab, you can toggle the visibility of signal markers and customize their colors, sizes, and styles.
- Alerts: Set up alerts for bearish or bullish capitulation signals to get real-time notifications.
Notes
- The indicator automatically adapts to the current chart timeframe (e.g., 1M, 15M, 1H, 1D, etc.). On smaller timeframes, consider reducing the RSI Length, Bollinger Bands Length, and Volume Period for better sensitivity. For example, on a 5-minute chart, a Bollinger Bands Length of 200 covers 1,000 minutes (over 16 hours), which might be too long – try lowering it to 50 or 100.
- Capitulation events are generally more reliable on higher timeframes (e.g., 1H, 4H, 1D), but the indicator can be used on any timeframe with proper adjustments. On weekly or monthly timeframes, the volume spike threshold is dynamically reduced to detect capitulation events more effectively.
- You can enable any combination of filters to generate signals. For example, disabling the Extremes Filter and enabling only the Confirmation Filter will generate signals based solely on volume spikes combined with MA deviation.
- Always combine with other analysis methods to reduce false signals.
- Test the indicator on your preferred markets (stocks, ETFs, crypto, etc.) and tweak the settings as needed.
Example
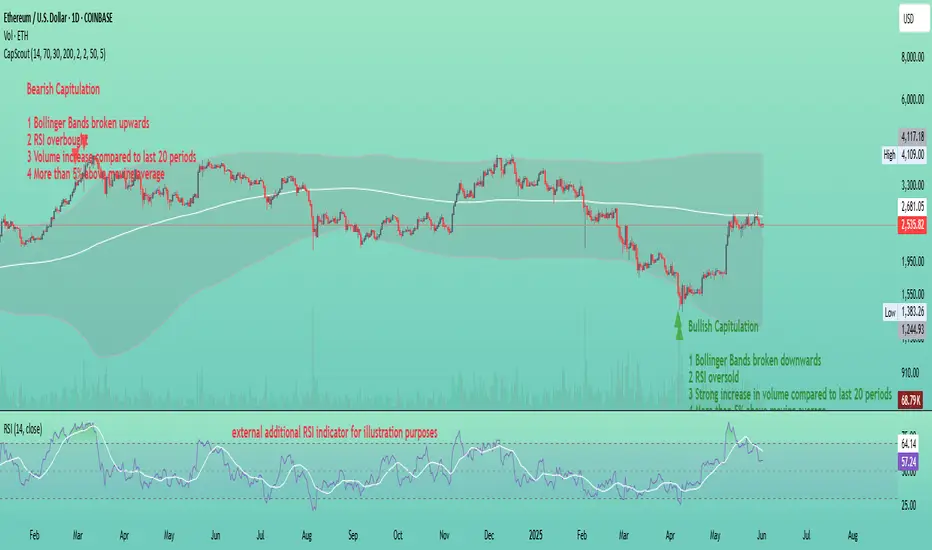
The thumbnail shows the Capitulation Scout on a daily chart of ETHUSD on Coinbase. Two red downward triangles (bearish capitulation) marked a major local top in early 2024, and from there, the ETH price started to correct. Two green upward triangles (bullish capitulation) marked a major bottom in April 2025, followed by a significant rally. For more examples, follow my account – I’ll aim to share and track such signals with you in the future.
Overview
The Capitulation Scout is a streamlined technical indicator designed to identify potential market reversals by spotting moments of "capitulation" – extreme fear (bearish capitulation) or euphoria (bullish capitulation). It combines two independent filter groups to provide reliable reversal signals: an Extremes Filter (RSI + Bollinger Bands) and a Confirmation Filter (Volume Spike + MA Deviation). The indicator dynamically adapts to the current chart timeframe, making it versatile for day traders and long-term investors alike.
How It Works
This indicator uses two filter groups to detect capitulation, which can be enabled or disabled individually:
1. Extremes Filter (RSI + Bollinger Bands): Identifies overbought (default: RSI > 70) or oversold (default: RSI < 30) conditions combined with price breaking through the Bollinger Bands (default: 200-period, 2x multiplier), indicating an extreme price movement.
2. Confirmation Filter (Volume Spike + MA Deviation): Requires both a significant volume increase (default: 2x the 20-period average volume on lower timeframes, dynamically adjusted on higher timeframes) and a significant price deviation from a moving average (default: 5% deviation from a 50-period SMA) to confirm the capitulation event.
A signal is generated if at least one filter is enabled and all enabled filters meet their respective conditions.
Signals
- Bearish Capitulation: Marked with a red downward triangle (customizable in the "Style" tab) above the candle. Occurs when the enabled filters detect a potential top, e.g., overbought RSI and price above the upper Bollinger Band (if Extremes Filter enabled), and/or a volume spike combined with a significant upward deviation from the MA (if Confirmation Filter enabled).
- Bullish Capitulation: Marked with a green upward triangle (customizable in the "Style" tab) below the candle. Occurs when the enabled filters detect a potential bottom, e.g., oversold RSI and price below the lower Bollinger Band (if Extremes Filter enabled), and/or a volume spike combined with a significant downward deviation from the MA (if Confirmation Filter enabled).
Note: At least one filter must be enabled to generate signals. If both filters are disabled, no signals will be shown.
How to Use
1. Add the Capitulation Scout to your chart.
2. Look for red downward triangles (bearish capitulation) at market tops or green upward triangles (bullish capitulation) at market bottoms as potential reversal signals.
3. Use the signals in conjunction with other technical analysis tools (e.g., support/resistance levels, trendlines) to confirm trades.
4. Set up alerts for bearish or bullish capitulation signals to get real-time notifications.
5. Adjust the settings to suit your trading style and timeframe. For smaller timeframes (e.g., 5M or 15M), consider reducing the Bollinger Bands length for more sensitivity.
Settings
- Extremes Filter Settings
- Use Extremes Filter (RSI + Bollinger Bands): Enable/disable the RSI and Bollinger Bands filter (default: enabled).
- RSI Length: Period for RSI calculation (default: 14 periods, relative to the chart timeframe).
- RSI Overbought/Oversold Levels: Thresholds for overbought/oversold conditions (default: 70/30).
- Bollinger Bands Length/Multiplier: Settings for Bollinger Bands (default: 200 periods, 2x multiplier).
- Confirmation Filter Settings
- Use Confirmation Filter (Volume Spike + MA Deviation): Enable/disable the combined Volume Spike and MA Deviation filter (default: enabled). When enabled, both a volume spike and a significant MA deviation are required to meet the filter condition.
- Volume Spike Threshold (Base Multiplier): Multiplier for detecting volume spikes on lower timeframes (default: 2x the 20-period average). On higher timeframes (e.g., weekly or monthly), the threshold is dynamically reduced to be more sensitive (e.g., 1.5x on weekly, 1x on monthly).
- Moving Average Length: Period for the SMA (default: 50 periods, relative to the chart timeframe).
- MA Deviation Threshold (%): Percentage deviation from the MA to consider the price stretched (default: 5%).
Features
- MA Deviation Filter Visualization: The moving average used for the MA deviation filter can be enabled in the "Style" tab under "MA for Deviation Filter (Optional)" and is displayed in blue by default. It is disabled by default and must be manually enabled in the "Style" tab. Its color, line width, and style can be customized in the "Style" tab.
- Customizable Visuals: In the "Style" tab, you can toggle the visibility of signal markers and customize their colors, sizes, and styles.
- Alerts: Set up alerts for bearish or bullish capitulation signals to get real-time notifications.
Notes
- The indicator automatically adapts to the current chart timeframe (e.g., 1M, 15M, 1H, 1D, etc.). On smaller timeframes, consider reducing the RSI Length, Bollinger Bands Length, and Volume Period for better sensitivity. For example, on a 5-minute chart, a Bollinger Bands Length of 200 covers 1,000 minutes (over 16 hours), which might be too long – try lowering it to 50 or 100.
- Capitulation events are generally more reliable on higher timeframes (e.g., 1H, 4H, 1D), but the indicator can be used on any timeframe with proper adjustments. On weekly or monthly timeframes, the volume spike threshold is dynamically reduced to detect capitulation events more effectively.
- You can enable any combination of filters to generate signals. For example, disabling the Extremes Filter and enabling only the Confirmation Filter will generate signals based solely on volume spikes combined with MA deviation.
- Always combine with other analysis methods to reduce false signals.
- Test the indicator on your preferred markets (stocks, ETFs, crypto, etc.) and tweak the settings as needed.
Example
The thumbnail shows the Capitulation Scout on a daily chart of ETHUSD on Coinbase. Two red downward triangles (bearish capitulation) marked a major local top in early 2024, and from there, the ETH price started to correct. Two green upward triangles (bullish capitulation) marked a major bottom in April 2025, followed by a significant rally. For more examples, follow my account – I’ll aim to share and track such signals with you in the future.
Sürüm Notları
Capitulation Scout - DescriptionOverview
Capitulation Scout is a technical indicator designed to identify potential market reversals by detecting moments of "capitulation" – extreme fear (bearish capitulation) or euphoria (bullish capitulation). It uses two independent filter groups to generate reliable reversal signals: Extremes Filter (combining RSI and Bollinger Bands) and Confirmation Filter (combining Volume Spike and MA Deviation). Unlike traditional indicators that rely on single metrics, this script integrates multiple conditions to filter out noise and improve signal accuracy. The indicator dynamically adapts to chart timeframe, making it suitable for both day traders and long-term investors.
How It Works
Capitulation Scout combines two filter groups to detect capitulation events, which can be enabled or disabled individually:
1. Extremes Filter (RSI + Bollinger Bands): This filter identifies extreme price movements by combining RSI and Bollinger Bands. The RSI (default: 14 periods) detects overbought (default: >70) or oversold (default: <30) conditions, indicating potential exhaustion in price momentum. Simultaneously, Bollinger Bands (default: 200 periods, 2x multiplier) identify when the price breaks through the upper or lower bands, confirming an extreme deviation from the mean. The combination of these two metrics ensures that signals are only generated when both conditions are met, reducing false positives compared to using RSI or Bollinger Bands alone.
2. Confirmation Filter (Volume Spike + MA Deviation): This filter confirms the capitulation event by requiring both a significant volume increase and a stretched price deviation from a moving average. The Volume Spike is detected by comparing the current volume to a 20-period average (default threshold: 2x on lower timeframes), with the threshold dynamically adjusted on higher timeframes (e.g., 1.5x on weekly, 1x on monthly) to account for lower volatility. The MA Deviation measures the percentage deviation of the price from a 50-period SMA (default: 5%), identifying when the price is significantly stretched. By requiring both conditions, this filter ensures that capitulation signals are backed by strong market participation and price momentum.
Why This Combination? The Capitulation Scout stands out by integrating these filters to create a robust system for detecting reversals. While RSI and Bollinger Bands alone can generate signals, they often produce noise in choppy markets. By adding the Confirmation Filter, the indicator ensures that signals are only generated when there is significant volume and price deviation, which are hallmarks of true capitulation events. The dynamic adjustment of the volume threshold across timeframes further enhances its adaptability, making it more effective than static indicators.
Signals
- Bearish Capitulation: Marked with a red downward triangle above the candle, indicating a potential top (e.g., overbought RSI, price above upper Bollinger Band, confirmed by a volume spike and upward MA deviation).
- Bullish Capitulation: Marked with a green upward triangle below the candle, indicating a potential bottom (e.g., oversold RSI, price below lower Bollinger Band, confirmed by a volume spike and downward MA deviation).
Note: At least one filter must be enabled to generate signals. If both filters are disabled, no signals will be shown.
How to Use
1. Add the Capitulation Scout to your chart.
2. Look for red downward triangles (bearish capitulation) at market tops or green upward triangles (bullish capitulation) at market bottoms as potential reversal signals.
3. Use the signals in conjunction with other technical analysis tools (e.g., support/resistance levels, trendlines) to confirm trades. For example, a bullish capitulation signal near a strong support level on a daily chart is more likely to lead to a reversal.
4. Set up alerts for bearish or bullish capitulation signals to get real-time notifications.
5. Adjust the settings to suit your trading style and timeframe. For smaller timeframes (e.g., 5M or 15M), consider reducing the Bollinger Bands length (e.g., to 50 or 100) for more sensitivity. For crypto markets with high volatility, you might increase the MA Deviation Threshold (e.g., to 7%) to filter out noise.
Settings
- Extremes Filter Settings
- Use Extremes Filter (RSI + Bollinger Bands): Enable/disable this filter (default: enabled).
- RSI Length: Period for RSI calculation (default: 14).
- RSI Overbought/Oversold Levels: Thresholds for overbought/oversold conditions (default: 70/30).
- Bollinger Bands Length/Multiplier: Settings for Bollinger Bands (default: 200 periods, 2x multiplier).
- Confirmation Filter Settings
- Use Confirmation Filter (Volume Spike + MA Deviation): Enable/disable this filter (default: enabled).
- Volume Spike Threshold (Base Multiplier): Multiplier for detecting volume spikes (default: 2x on lower timeframes, dynamically adjusted on higher timeframes).
- Moving Average Length: Period for the SMA (default: 50).
- MA Deviation Threshold (%): Percentage deviation from the MA (default: 5%).
Features
- MA Deviation Filter Visualization: Optionally display the MA (default: blue) in the "Style" tab under "MA for Deviation Filter (Optional)".
- Customizable Visuals: Toggle signal markers and customize their colors, sizes, and styles in the "Style" tab.
- Alerts: Set up alerts for bearish or bullish capitulation signals.
Notes
- Indicator adapts to the chart timeframe. On smaller timeframes, reduce the RSI Length, Bollinger Bands Length, and MA Length for better sensitivity.
- Capitulation events are more reliable on higher timeframes (e.g., 1H, 4H, 1D).
- Test the indicator on your preferred markets (stocks, ETFs, crypto, etc.) and tweak the settings as needed.
Example
The thumbnail below shows the Capitulation Scout on a daily chart of ETHUSD on Coinbase. Two red downward triangles (bearish capitulation) marked a major local top in early 2024, and from there, the ETH price started to correct. Two green upward triangles (bullish capitulation) marked a major bottom in April 2025, followed by a significant rally. For more examples, follow my account – I’ll aim to share and track such signals with you in the future.
Note on the Chart: The chart includes an additional RSI indicator to provide context for the Capitulation Scout's signals. Since the Extremes Filter uses RSI to detect overbought/oversold conditions, the RSI indicator helps visualize when the market is in an extreme state (e.g., RSI > 70 for bearish signals, RSI < 30 for bullish signals), making it easier to understand the timing of the capitulation signals.
Korumalı komut dosyası
Bu komut dosyası kapalı kaynak olarak yayınlanmaktadır. Ancak, ücretsiz ve herhangi bir sınırlama olmaksızın kullanabilirsiniz – daha fazla bilgiyi buradan edinebilirsiniz.
Feragatname
Bilgiler ve yayınlar, TradingView tarafından sağlanan veya onaylanan finansal, yatırım, alım satım veya diğer türden tavsiye veya öneriler anlamına gelmez ve teşkil etmez. Kullanım Koşulları bölümünde daha fazlasını okuyun.