OPEN-SOURCE SCRIPT
Güncellendi Rolling Quartiles
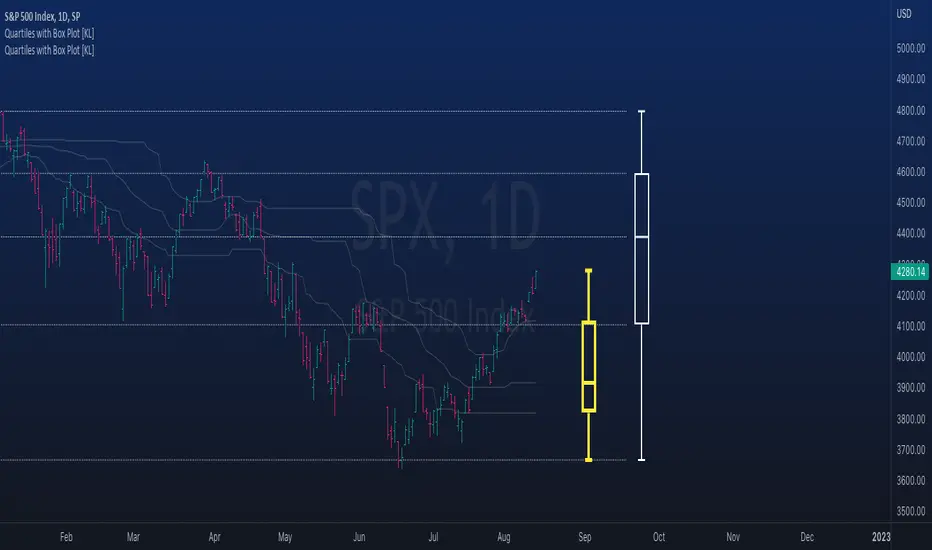
This script will continuously draw a boxplot to represent quartiles associated with data points in the current rolling window.
Description:
A quartile is a statistical term that refers to the division of a dataset based on percentiles.
Other points to note:

Other properties:
- Q1 to Q3: a range is known as the interquartile range (IQR). It describes where 50% of data approximately lie.
- Line segments connecting IQR to min and max (Q0→Q1, and Q3→Q4) are known as whiskers. Data lying outside the whiskers are considered as outliers. However, such extreme values will not be found in a rolling window because whenever new datapoints are introduced to the dataset, the oldest values will get dropped out, leaving Q0 and Q4 to always point to the observable min and max values.
Applications:
This script has a feature that allows moving percentiles (moving values of Q1, Q2, and Q3) to be shown. This can be applied for trading in ways such as:
- Q2: as alternative to a SMA that uses the same lookback period. We know that the Mean (SMA) is highly sensitive to extreme values. On the other hand, Median (Q2) is less affected by skewness. Putting it together, if the SMA is significantly lower than Q2, then price is regarded as negatively skewed; prices of a few candles are likely exceptionally lower. Vice versa when price is positively skewed.
- Q1 and Q3: as lower and upper bands. As mentioned above, the IQR covers approximately 50% of data within the rolling window. If price is normally distributed, then Q1 and Q3 bands will overlap a bollinger band configured with +/- 0.67x standard deviations (modifying default: 2) above and below the mean.
- The boxplot, combined with TradingView's builtin bar replay feature, makes a great tool for studies purposes. This helps visualization of price at a chosen instance of time. Speaking of which, it can also be used in conjunction with a fixed volume profile to compare and contrast the effects (in terms of price range) with and without consideration of weights by volume.
Parameters:
- Lookback: The size of the rolling window.
- Offset: Location of boxplot, right hand side relative to recent bar.
- Source data: Data points for observation, default is closing price
- Other options such as color, and whether to show/hide various lines.
Description:
A quartile is a statistical term that refers to the division of a dataset based on percentiles.
- Q1: Quartile 1 - 25th percentile
- Q2: Quartile 2 - 50th percentile, as known as the median
- Q3: Quartile 3 - 75th percentile
Other points to note:
- Q0: the minimum
- Q4: the maximum
Other properties:
- Q1 to Q3: a range is known as the interquartile range (IQR). It describes where 50% of data approximately lie.
- Line segments connecting IQR to min and max (Q0→Q1, and Q3→Q4) are known as whiskers. Data lying outside the whiskers are considered as outliers. However, such extreme values will not be found in a rolling window because whenever new datapoints are introduced to the dataset, the oldest values will get dropped out, leaving Q0 and Q4 to always point to the observable min and max values.
Applications:
This script has a feature that allows moving percentiles (moving values of Q1, Q2, and Q3) to be shown. This can be applied for trading in ways such as:
- Q2: as alternative to a SMA that uses the same lookback period. We know that the Mean (SMA) is highly sensitive to extreme values. On the other hand, Median (Q2) is less affected by skewness. Putting it together, if the SMA is significantly lower than Q2, then price is regarded as negatively skewed; prices of a few candles are likely exceptionally lower. Vice versa when price is positively skewed.
- Q1 and Q3: as lower and upper bands. As mentioned above, the IQR covers approximately 50% of data within the rolling window. If price is normally distributed, then Q1 and Q3 bands will overlap a bollinger band configured with +/- 0.67x standard deviations (modifying default: 2) above and below the mean.
- The boxplot, combined with TradingView's builtin bar replay feature, makes a great tool for studies purposes. This helps visualization of price at a chosen instance of time. Speaking of which, it can also be used in conjunction with a fixed volume profile to compare and contrast the effects (in terms of price range) with and without consideration of weights by volume.
Parameters:
- Lookback: The size of the rolling window.
- Offset: Location of boxplot, right hand side relative to recent bar.
- Source data: Data points for observation, default is closing price
- Other options such as color, and whether to show/hide various lines.
Sürüm Notları
Refactor: added helper functions.Style: Mods to UI in settings.
Sürüm Notları
Added feature: Option of use modified boxplots,1.5 x IQRSürüm Notları
Added feature: Trend indicator. Option to modify bar colors according to trend. Trend is deemed as up/down/neutral depending on whether price is above/below/within IQR (respectively).
Açık kaynak kodlu komut dosyası
Gerçek TradingView ruhuyla, bu komut dosyasının mimarı, yatırımcıların işlevselliğini inceleyip doğrulayabilmesi için onu açık kaynaklı hale getirdi. Yazarı tebrik ederiz! Ücretsiz olarak kullanabilseniz de, kodu yeniden yayınlamanın Topluluk Kurallarımıza tabi olduğunu unutmayın.
Feragatname
Bilgiler ve yayınlar, TradingView tarafından sağlanan veya onaylanan finansal, yatırım, alım satım veya diğer türden tavsiye veya öneriler anlamına gelmez ve teşkil etmez. Kullanım Koşulları bölümünde daha fazlasını okuyun.