PROTECTED SOURCE SCRIPT
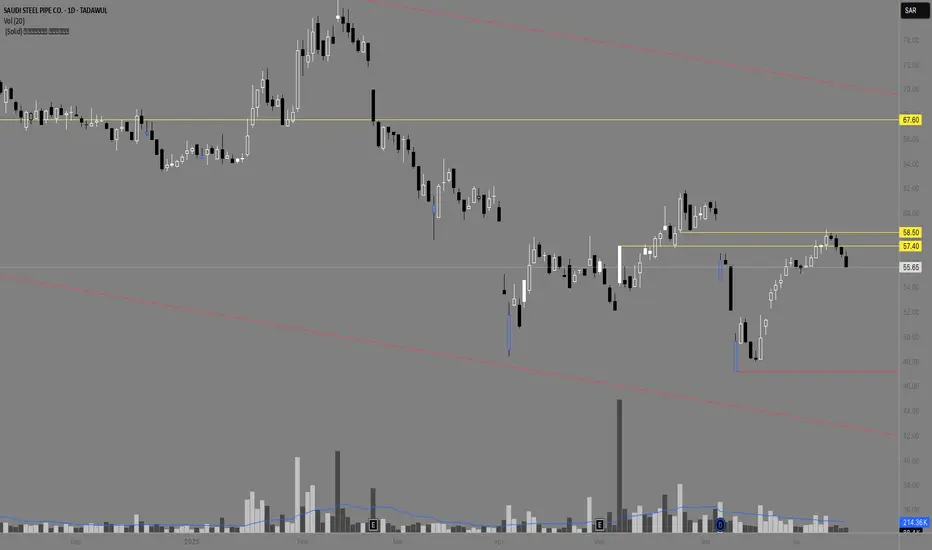
مؤشرأبو سليمان

🎯 ماذا يفعل المؤشر؟
يقوم بتلوين الشمعة التي تحقق الشروط " سر المهنة " بلون أزرق (أو حسب اختيارك).
يرسم خطين أفقيين على:
أعلى الشمعة (باللون الأخضر)
أدنى الشمعة (باللون الأحمر)
هذه الخطوط تمتد يمينًا حتى يتم اختراقها بإغلاق جسم الشمعة:
الخط الأخضر يتوقف إذا تم اختراقه صعودًا.
الخط الأحمر يتوقف إذا تم كسره هبوطًا.
🔔 التنبيه:
يوفر المؤشر تنبيهًا تلقائيًا عند اختراق الخط الأخضر، وهو بمثابة إشارة دخول محتملة بعد تجاوز مقاومة الكذب السابقة.
🔊 رسالة التنبيه:
تم اختراق الخط الأخضر لشمعة أبو سليمان
⚙️ الإعدادات القابلة للتخصيص:
تفعيل/إلغاء تلوين الشمعة
اختيار لون الشمعة
اختيار لون ونمط الخط العلوي والسفلي
📌 وقف الخسارة (اختياري):
أسفل أدنى الشمعة التي حققت "كذب الصعود".
أو الخط الأحمر السفلي إن كان مرسومًا.
🎯 المستهدف:
يمكن تحديده بنسبة مخاطرة/عائد 1:2
أو بناءً على أقرب مقاومة.
📢 ملاحظة:
هذه الاستراتيجية مبنية على سلوك سعري،
خيار البيع والشراء وشرعية السهم أنت لوحدك المسؤول عنها
صلى الله عليه وسلم
اذكروني بدعوه
اخوكم أبو سليمان
🎯 What Does the Indicator Do?
The indicator highlights the candle that meets the special “Trade Secret” conditions in blue (or your preferred color).
It then draws two horizontal lines:
A green line at the top of the candle
A red line at the bottom of the candle
These lines extend to the right until they are broken by a full-body candle close:
The green line stops if it is broken to the upside
The red line stops if it is broken to the downside
🔔 Alert:
The indicator provides an automatic alert when the green line is broken.
This is considered a potential entry signal after price breaks through the previous "false breakout" resistance.
🔊 Alert message:
“The green line of the Abu Sulaiman candle has been broken.”
⚙️ Customizable Settings:
Enable/disable candle highlighting
Choose highlight color
Choose color and style for the upper and lower lines
📌 Stop Loss (optional):
Just below the low of the candle that triggered the false rally
Or below the red support line if drawn
🎯 Target:
Based on a 1:2 risk/reward ratio
Or based on the nearest resistance level
📢 Note:
This strategy is based on price behavior and market psychology.
You are solely responsible for your buy/sell decisions and verifying the stock's compliance
and validity.
Korumalı komut dosyası
Bu komut dosyası kapalı kaynak olarak yayınlanmaktadır. Ancak, özgürce ve herhangi bir sınırlama olmaksızın kullanabilirsiniz – daha fazla bilgi burada.
Feragatname
Bilgiler ve yayınlar, TradingView tarafından sağlanan veya onaylanan finansal, yatırım, işlem veya diğer türden tavsiye veya tavsiyeler anlamına gelmez ve teşkil etmez. Kullanım Şartları'nda daha fazlasını okuyun.