🔍 Current basics
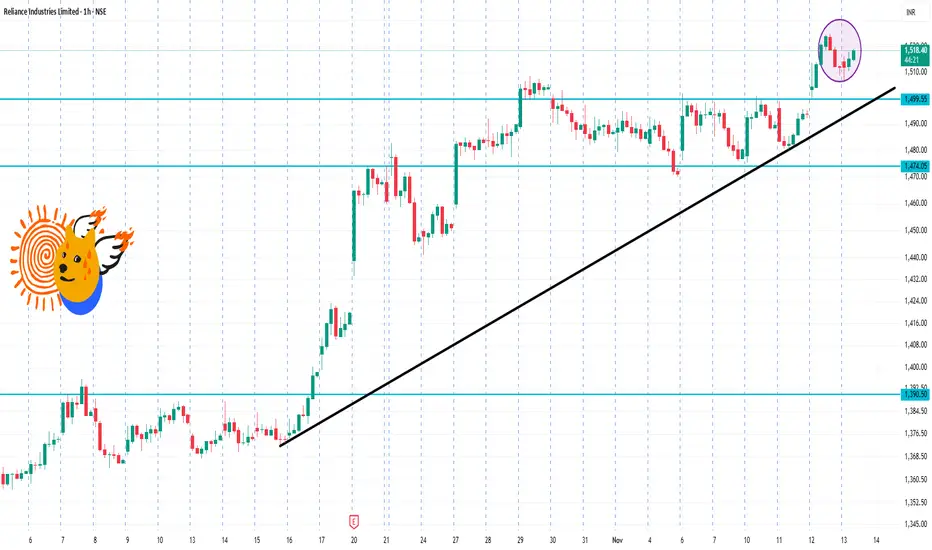
Latest traded price: ~ ₹1,518 on NSE.
52-week range: Low ~ ₹1,114.85, High ~ ₹1,551.00.
Technical indicator summary (on 1-hour/higher timeframes) shows a “Strong Buy” bias.
⚠️ Risks / Caveats
Even though the technicals are bullish, the stock is close to its 52-week high (~ ₹1,551). Highs often mean less “room” for upside without some pullback.
Intraday patterns can change quickly with macro news or sector moves (eg: oil & gas, regulatory).
Support at ~₹1,500 is fairly close to current; a break could expose the ₹1,470–₹1,480 region.
Because this is a large-cap and widely held stock, institutional moves and volume matter a lot.
İlgili yayınlar
Feragatname
Bilgiler ve yayınlar, TradingView tarafından sağlanan veya onaylanan finansal, yatırım, alım satım veya diğer türden tavsiye veya öneriler anlamına gelmez ve teşkil etmez. Kullanım Koşulları bölümünde daha fazlasını okuyun.
İlgili yayınlar
Feragatname
Bilgiler ve yayınlar, TradingView tarafından sağlanan veya onaylanan finansal, yatırım, alım satım veya diğer türden tavsiye veya öneriler anlamına gelmez ve teşkil etmez. Kullanım Koşulları bölümünde daha fazlasını okuyun.