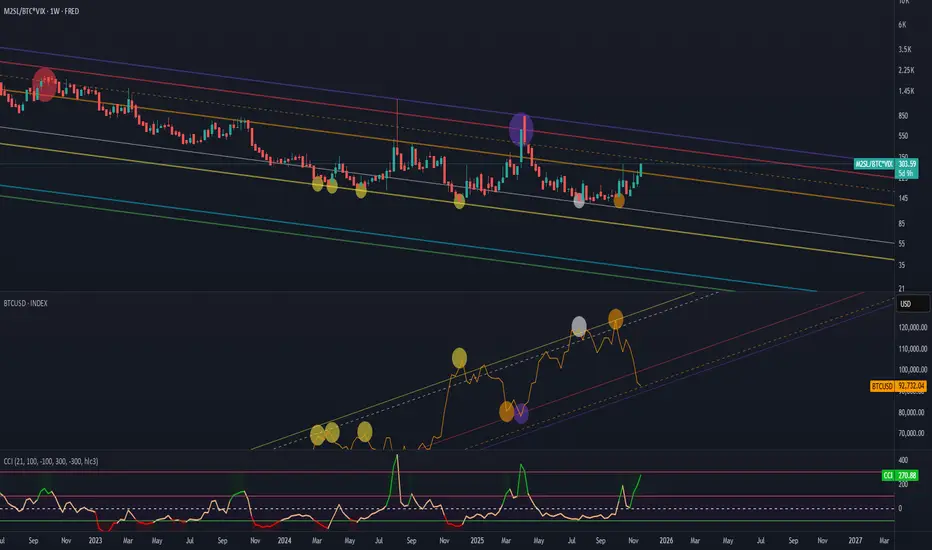
It shows the ratio of global liquidity (M2) to Bitcoin’s market capitalization, amplified by market fear (VIX), relative to BTCUSD.
Thanks to this formula, we have an understanding of which phase of the market we are currently in.
In this case the CCI indicator shows:
overbought conditions — meaning money is outside the market and
oversold conditions — meaning there is too much money in the market and it’s time to sell
FRED:M2SL/CRYPTOCAP:BTC*TVC:VIX
For some reason the Bitcoin chart isn’t displaying with all the markings, so I’ll attach a screenshot below.
İşlem aktif
For those who don’t understand the concept at all:the upper chart represents money and the lower chart represents Bitcoin.
The higher the values on the upper chart — the more money is OUT of the market
The lower it goes — the more money is FLOWING inside the market
İlgili yayınlar
Feragatname
Bilgiler ve yayınlar, TradingView tarafından sağlanan veya onaylanan finansal, yatırım, alım satım veya diğer türden tavsiye veya öneriler anlamına gelmez ve teşkil etmez. Kullanım Koşulları bölümünde daha fazlasını okuyun.
İlgili yayınlar
Feragatname
Bilgiler ve yayınlar, TradingView tarafından sağlanan veya onaylanan finansal, yatırım, alım satım veya diğer türden tavsiye veya öneriler anlamına gelmez ve teşkil etmez. Kullanım Koşulları bölümünde daha fazlasını okuyun.