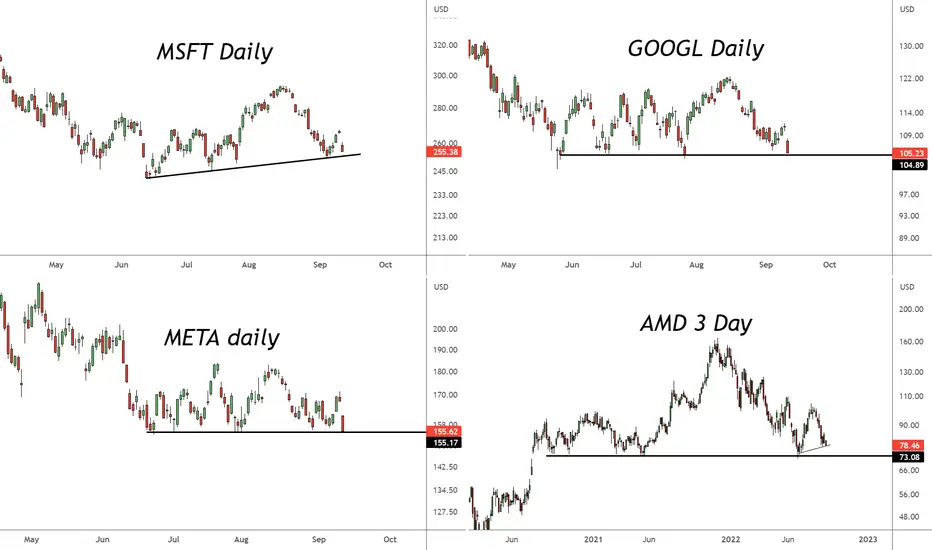
These four big tech stocks are on thin ice.
A break of these necklines suggests more downside. These levels likely indicate around 11,900 on the Nasdaq as the line in the sand.
Question is, does this lead to capitulation or a longer duration downtrend. TBD...
Nasdaq 11,900 level = red line

A break of these necklines suggests more downside. These levels likely indicate around 11,900 on the Nasdaq as the line in the sand.
Question is, does this lead to capitulation or a longer duration downtrend. TBD...
Nasdaq 11,900 level = red line
Not
MSFT potential magnet and buy zone:GOOGL:
Will likely be better buying opportunities on stocks with better RS, but watch these levels for next major support on the Nasdaq if reached around the same time
Feragatname
Bilgiler ve yayınlar, TradingView tarafından sağlanan veya onaylanan finansal, yatırım, alım satım veya diğer türden tavsiye veya öneriler anlamına gelmez ve teşkil etmez. Kullanım Koşulları bölümünde daha fazlasını okuyun.
Feragatname
Bilgiler ve yayınlar, TradingView tarafından sağlanan veya onaylanan finansal, yatırım, alım satım veya diğer türden tavsiye veya öneriler anlamına gelmez ve teşkil etmez. Kullanım Koşulları bölümünde daha fazlasını okuyun.