Technical Analysis Overview:
1-Hour Chart:
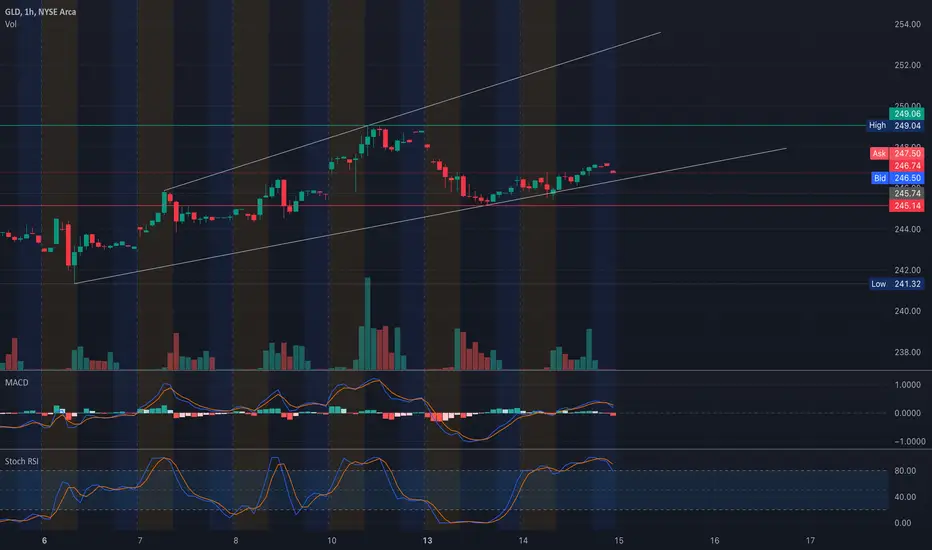
* Trend: GLD is in a steady uptrend, trading within a rising channel and approaching the $248-$249 resistance zone.
* Indicators:
* MACD: Slight bullish momentum, but the histogram is flattening, indicating reduced strength.
* Stochastic RSI: Overbought at 89, suggesting a potential short-term consolidation or pullback.
30-Minute Chart:
* Price Action:
* GLD is consolidating near $247, with key resistance at $248-$249.
* Immediate support at $245 has shown strength in recent sessions.
* Volume: Moderate volume, consistent with the gradual upward movement.
Key Levels to Watch:
Support Levels:
* $245: Immediate support zone, aligning with the HVL and 2nd PUT Wall.
* $243: Secondary support, coinciding with the 2nd PUT Wall (-5.96% GEX).
* $240: Strong support near the 3rd PUT Wall.
Resistance Levels:
* $248: Immediate resistance, aligning with the 2nd CALL Wall.
* $249-$250: Key resistance zone, highlighted by the highest positive NETGEX.
* $253: Long-term resistance, supported by the 3rd CALL Wall.
GEX Insights:

Key Gamma Levels:
* Positive Gamma Walls (Resistance):
* $248: 56.42% GEX (2nd CALL Wall).
* $249-$250: Highest positive NETGEX and immediate resistance.
* $253: 39.99% GEX (3rd CALL Wall).
* Negative Gamma Levels (Support):
* $245: Immediate support backed by HVL and gamma support.
* $243: Strong support with PUT activity (-5.96% GEX).
* $240: Key PUT Wall support (-2.96% GEX).
Options Metrics:
* IVR: 57.2, indicating relatively high implied volatility.
* IVx: 15.2, below average, signaling a stable environment.
* Call/Put Bias: Calls dominate at 49%, reflecting bullish sentiment.
Trade Scenarios:
Bullish Scenario:
* Entry: Above $248 with volume confirmation.
* Target: $249-$253.
* Stop-Loss: Below $245 to limit risk.
Bearish Scenario:
* Entry: Rejection at $248 or a breakdown below $245.
* Target: $243-$240.
* Stop-Loss: Above $249 to control losses.
Directional Bias:
* GLD's continued uptrend and consolidation near $247-$248 suggest bullish momentum, but the resistance zone at $248-$249 is critical. A breakout could lead to a rally toward $250-$253, while a failure to clear resistance may result in a pullback toward $245-$243.
Conclusion:
GLD is approaching a pivotal resistance zone at $248-$249. A breakout could signal further bullish continuation, while a rejection might trigger consolidation or a retracement. Traders should monitor volume and price action closely for confirmation.
Disclaimer: This analysis is for educational purposes only and does not constitute financial advice. Always conduct your research and trade responsibly.
1-Hour Chart:
* Trend: GLD is in a steady uptrend, trading within a rising channel and approaching the $248-$249 resistance zone.
* Indicators:
* MACD: Slight bullish momentum, but the histogram is flattening, indicating reduced strength.
* Stochastic RSI: Overbought at 89, suggesting a potential short-term consolidation or pullback.
30-Minute Chart:
* Price Action:
* GLD is consolidating near $247, with key resistance at $248-$249.
* Immediate support at $245 has shown strength in recent sessions.
* Volume: Moderate volume, consistent with the gradual upward movement.
Key Levels to Watch:
Support Levels:
* $245: Immediate support zone, aligning with the HVL and 2nd PUT Wall.
* $243: Secondary support, coinciding with the 2nd PUT Wall (-5.96% GEX).
* $240: Strong support near the 3rd PUT Wall.
Resistance Levels:
* $248: Immediate resistance, aligning with the 2nd CALL Wall.
* $249-$250: Key resistance zone, highlighted by the highest positive NETGEX.
* $253: Long-term resistance, supported by the 3rd CALL Wall.
GEX Insights:
Key Gamma Levels:
* Positive Gamma Walls (Resistance):
* $248: 56.42% GEX (2nd CALL Wall).
* $249-$250: Highest positive NETGEX and immediate resistance.
* $253: 39.99% GEX (3rd CALL Wall).
* Negative Gamma Levels (Support):
* $245: Immediate support backed by HVL and gamma support.
* $243: Strong support with PUT activity (-5.96% GEX).
* $240: Key PUT Wall support (-2.96% GEX).
Options Metrics:
* IVR: 57.2, indicating relatively high implied volatility.
* IVx: 15.2, below average, signaling a stable environment.
* Call/Put Bias: Calls dominate at 49%, reflecting bullish sentiment.
Trade Scenarios:
Bullish Scenario:
* Entry: Above $248 with volume confirmation.
* Target: $249-$253.
* Stop-Loss: Below $245 to limit risk.
Bearish Scenario:
* Entry: Rejection at $248 or a breakdown below $245.
* Target: $243-$240.
* Stop-Loss: Above $249 to control losses.
Directional Bias:
* GLD's continued uptrend and consolidation near $247-$248 suggest bullish momentum, but the resistance zone at $248-$249 is critical. A breakout could lead to a rally toward $250-$253, while a failure to clear resistance may result in a pullback toward $245-$243.
Conclusion:
GLD is approaching a pivotal resistance zone at $248-$249. A breakout could signal further bullish continuation, while a rejection might trigger consolidation or a retracement. Traders should monitor volume and price action closely for confirmation.
Disclaimer: This analysis is for educational purposes only and does not constitute financial advice. Always conduct your research and trade responsibly.
Feragatname
Bilgiler ve yayınlar, TradingView tarafından sağlanan veya onaylanan finansal, yatırım, işlem veya diğer türden tavsiye veya tavsiyeler anlamına gelmez ve teşkil etmez. Kullanım Şartları'nda daha fazlasını okuyun.
Feragatname
Bilgiler ve yayınlar, TradingView tarafından sağlanan veya onaylanan finansal, yatırım, işlem veya diğer türden tavsiye veya tavsiyeler anlamına gelmez ve teşkil etmez. Kullanım Şartları'nda daha fazlasını okuyun.