AAPL has already been affected by a Bearish Head & Shoulders reversal pattern earlier this year (see related).
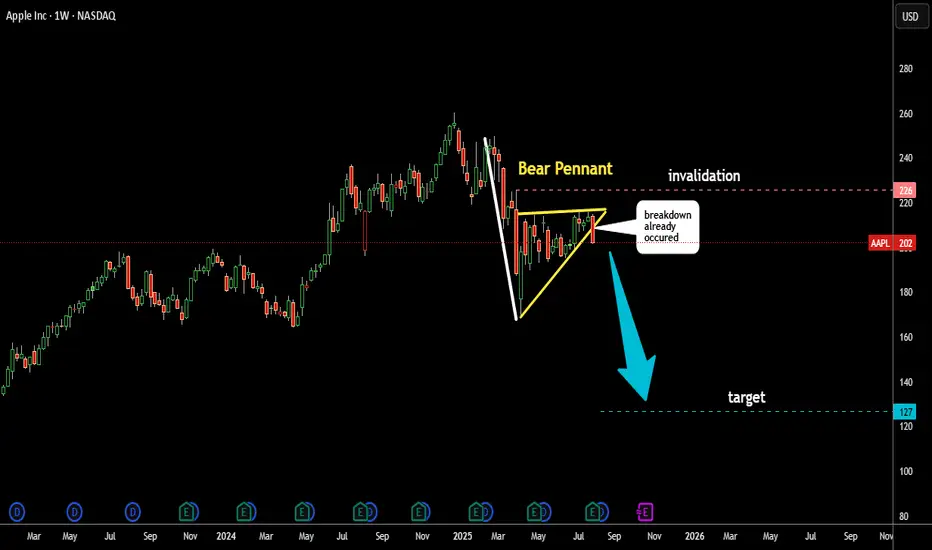
Now, another bearish pattern has formed — a Pennant (highlighted in yellow).
The price has broken below the Pennant’s support, triggering a potential bearish move.
The target is calculated by subtracting the length of the Pole (in white) from the support level of the pattern.
This target is marked with a blue dashed line at $127.
Is Apple melting down again?
I’d love to read your thoughts.
İlgili yayınlar
Feragatname
Bilgiler ve yayınlar, TradingView tarafından sağlanan veya onaylanan finansal, yatırım, alım satım veya diğer türden tavsiye veya öneriler anlamına gelmez ve teşkil etmez. Kullanım Koşulları bölümünde daha fazlasını okuyun.
İlgili yayınlar
Feragatname
Bilgiler ve yayınlar, TradingView tarafından sağlanan veya onaylanan finansal, yatırım, alım satım veya diğer türden tavsiye veya öneriler anlamına gelmez ve teşkil etmez. Kullanım Koşulları bölümünde daha fazlasını okuyun.