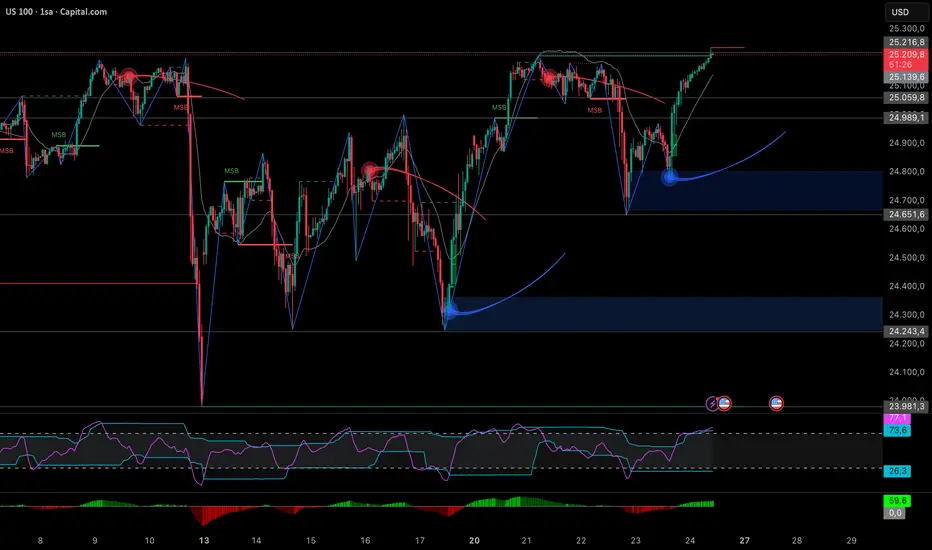
NASDAQ YENİ REKORLAR PEŞİNDE !Geçtiğimiz hafta inişli çıkışlı performans gösteren endeks 25200 direncini kırmasıyla yeni bir yükseliş dalgası başlattı. Bu seviyenin kırılımı fiyatın artık 25500'e kadar yükselişinin işareti niteliğinde.
Hafta sonu yaşanan ABD - Çin olumlu gelişmesi P.tesi açılış ile yükselişlerin devam etmesi mümkün. Ayrıca FED'in faiz kararı endekste manipülatif hareketlerinde yaşanacağını söyleyebilirim. Yani endeks 26000'e kadar yükseliş potansiyeli bulunduruyor. Eğer 25500 direnci aşılırsa 26000 gelir.
Bir diğer senaryo ise açılış ile fiyatın 25200 desteğine temas edip sonrasında yükseliş ivmesi başlayabilir. Ancak 25200 yükseliş ve düşüşler için önemli referans niteliğinde. Desteğin kaybedilmesiyle fiyat ilk olarak 25000'i test eder, istenen tepki alınmaması halinde 24800'e kadar sert düşüş beklenebilir. Bu seviyelerden alıcılar tekrar devreye girebilir.
İşlem fikirleri

Nasdaq Ne olur? Yeniden herkese merhaba arkadaşlar.
Bir haftayı daha atlattık. Altının etkisinde ilerliyor tüm piyasa. O yüzden ne yazık ki buralarda da altından bahsetmek zorunda kalıyoruz. Nasdaq için yükseliş beklentimiz vardı ve çalıştı. Çıkış trendini görüyorsunuz, çarptığı bölge de yeşil çizgimiz. O bölgenin çok az daha üstüne giderse AB-CD formasyonunu oluşturabilir. Ve o bölgeden bir düzeltme gelmesi de muhtemel.
Formasyon çalışırsa hedeflerini Fibonacci zaten çok güzel göstermiş durumda.
Peki temel etkenlerde ne olacak?
Altın bu hafta yükseliş yaparsa özellikle rekora doğru giderse, diğer yatırım ürünlerinden paranın çıkıp Altına girmesi muhtemel. Bu da endekslerde ciddi düşüşe neden olur. Bunun için de Çarşamba günü faiz kararını beklemek makul olacaktır. Endekslerde 1000-2000 puanı inişler bekliyorum. Fakat bu hareketi temelde bir olayla birleştirerek yapmaları muhtemel.
Burada yazdıklarım yatırım tavsiyesi değildir. Herkese iyi günler bol kazançlar :)

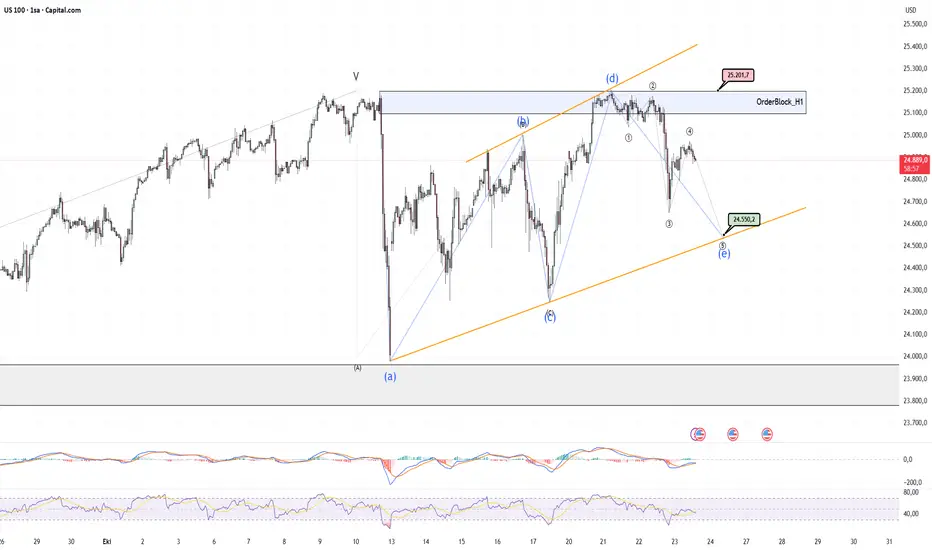
NAS100’de Kritik Seviye: Yönü Belirleyecek Kırılım! 📊 NAS100 – 1 Saatlik Analiz
Dostlarım selamlar,
Sizler için NAS100 analizi hazırladım.
1 saatlik grafiğe baktığımızda kritik bir seviyeye dikkat çekmek istiyorum.
👉 Eğer NAS100 25,038 seviyesini kırar ve mum kapanışı yaparsa, ilk hedef noktası 25,351 olacaktır.
👉 Eğer NAS100 25,038 seviyesini kıramazsa, bu durumda 24,267 seviyesine doğru geri çekilme beklenebilir.
🙏 Dostlarım, her bir beğeniniz bu analizleri paylaşmaya devam etmem için en büyük motivasyon kaynağım.
Destek olan herkese teşekkür ederim!

Us100'de muhtemel düşüş senaryosunu değerlendiriyorum US100 de minör dalgada 5nci dalgaya başladı gibi. 24550 seviyesine kadar inip hem (5)i hem de (e) dalgasını bitirebilir. 25200 üstü saatlik yada 4 saatlik kapanış gelirse stop olunmalı..
Her sabah yayınladığım günlük analiz videolarına 5 dakikanızı ayırarak hem bana destek olabilir hem de majör ürünlerdeki teknik beklentilerimi görebilirsiniz . Bol kazançlar diliyorum herkese .
NASDAQ ANALİZ#NASDAQ güçlü toparlanma sonrası 25.200 direncinde karar aşamasında.
RSI aşırı alımda, MACD pozitif.
24.800 üzerinde tutunma sürerse 25.500 hedefi öne çıkar.
Ancak 24.700 altı kapanışlar düzeltme başlatabilir.
📊25.216 üzeri 1 saatlik kapanışlar olursa 25.500 hedeflenebilir.
Ancak RSI 77 seviyelerinde, bu nedenle 25.300 civarında kısa soluklanma beklenebilir.
#NasdaqNasdaq 4 saatlik grafikte 25.200 üzerinde 4 saatlik kapanış gelmediği sürece alt bölge kanalımız olan 24.250 seviyelerini tekrardan test edebilir.

#NasdaqNasdaq 4 saatlik grafikte 25.200 üzerinde 4 saatlik kapanış gelmediği sürece alt bölge kanalımız olan 24.400 seviyelerini tekrardan test edebilir.

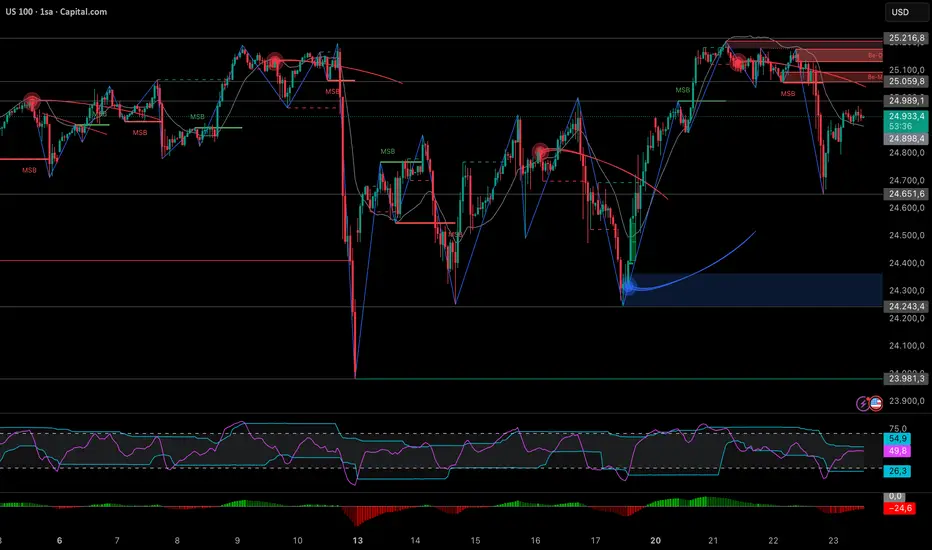
NASDAQ ANALİZ#NASDAQ şu anda 24.930 civarında, 24.300 bölgesinden güçlü tepki aldı.
RSI ve MACD toparlanma sinyali veriyor.
📊25.060 üzeri kapanışlarda hedef 25.216 olur.
24.800 altı kapanışlar trendi zayıflatabilir.
Kısa vadeli yükselişin devamı için 25.060 üzeri kapanışlar gerekiyor.
Bu durumda hedef 25.216 ve 25.400 aralığı olur.

NASDAQ NE OLUR?Arkadaşlar Merhaba.
Analizi gün gün işlem alanlar için yazıyorum. Uzun vadede teknik analizlerde elbette yönler var. Muhakkak görmüşsünüzdür fakat gün içinde ne olacak ben bu yöndeki tahminlerimi yazıyorum..
Öncelikle Altındaki düşüş herkesi korkuttu fakat endekslerde değişiklik olmadı o para da endekslere giriş yapmadı. VIX endeksi de hareket etmedi oysaki, hatta düştü bile. O yüzden Altındaki buy yönlü düşüncemle birlikte, altına para girişi olduğu esnada endekslerde düşüş bekliyorum. Hem de 1000 pips civarı olabilir. Yön çizmedim özellikle. Öncelikle Mor bölgeye (25.000) teste gideceğini düşünüyorum. Bu bölgenin kırılmasının ardından bir daha düşüş yaşanacağını ve 24.000 rakamına kadar iniş görebileceğimizi belirtmek isterim. Oradaki likiditeyi almış gözükse de Endekslerin bu kadar iyimser havaya rağmen düşmesinin mümkün olduğunu anlatmak istiyorum. 22 Ekim tarihinde Nasdaq ve Dax üzerinde 150 pips civarı satışı bekliyorum bilginiz olsun..
Haftaya daha sert hareketler olacaktır. Fed faiz indirimi falan derken piyasadaki hareketin tavan olacağını düşünüyorum. Bir de beklenti üzeri indirim gelirse o zaman şenlenir ortalık. Haftaya kasasını korumak isteyen herkesin Forex ekranlarını kapatmasını şimdiden tavsiye ederim.
İyi günler bol kazançlar :)

#Nasdaq
Nasdaq 4 saatlik grafikte 25.200 üzerinde 4 saatlik kapanış gelmediği sürece alt bölge kanalımız olan 24.780 seviyelerini tekrardan test edebilir.

NASDAQ US100 ANALİZ#NASDAQ Şu anda fiyat 25.120 civarında hafif bir düzeltme hareketi içerisinde.
📌Kısa vadede 25.220 – 25.280 aralığı önemli direnç bölgesi olarak öne çıkıyor. Bu bölgenin aşılması halinde 25.400 – 25.500 seviyelerine kadar yükselişin devam etmesi beklenebilir.
💫Aşağıda 24.960 – 24.850 aralığı ilk destek, bu seviyenin altına inilirse 24.713 ve 24.350 bölgeleri yeniden test edilebilir.
⭐️RSI 61 seviyelerinde seyrediyor, hâlâ pozitif bölgede ancak aşırı alım sınırına yaklaşmış durumda.
Kısa vadede 25.220 üzeri kapanışlar alıcılara avantaj kazandırırken, bu seviyenin altında kalındığı sürece hafif kar realizasyonları görülebilir.

#NasdaqNasdaq 4 saatlik grafikte 25.210 üzerinde 4 saatlik kapanış gelmediği sürece alt bölge kanalımız olan 24.370 seviyelerini tekrardan test edebilir.

USA100 - USA30 - S§P500 - ABD endeksleri 20.10.25ABD endekslerin de durum pozitif görünüyor, gerçekleşen korku satışı ardından gapli gelişen toparlama gücünü korumaya yeterli oldu, VIX tarafında gerçekleşen yoğun fiyatlamaların ardından ürünler gücünü korumayı sürdürüyor. Güçlü kalması halinde muhtemelen yeni zirveler çok uzak bir ihtimal değil, VIX Gap'li yükselişlerin ardından tarihi dipleri test etmeye hazır görünüyor ayrıca uzun süredir zaten dip seviyelerini test etmeye de devam ediyor. Piyasada ki korkunun azalması endeksleri yukarı taşımak için yeterli, zaten gerekli kar satışları ufakta olsa yapıldı ve ardından gücünü koruması ile birlikte yolunu belli ettiğini düşünüyorum.
ABD ürünlerini doğru incelemek için VIX takip etmek sizin için yeterli olacaktır, VIX 21,75 üstünde kaldığı sürece endeksler güç kaybedebilir, son kapanış 20.77 bu seviyeler ve altı endeksleri toparlamaya yeterli olacaktır. Sırası ile hedefleri 20.51 - 19,15 - 17,33 - 15,41 ardından 10,26 ile tarihi diplere ulaşabilir.
Destek - Direnç
USA100
Destek : 24.785 - 24.600 - 24.460 - 24.240
Direnç : 25.070 - 25.155 - 25.295 - 25.425
USA30
Destek : 46.000 - 45.720 - 45.200 - 44.500 - 43.860 ( Yoğun fiyatlamalar aralıkları genişletiyor. )
Direnç : 46.475 - 46.735 - 47.030 - 47690 - 48.500

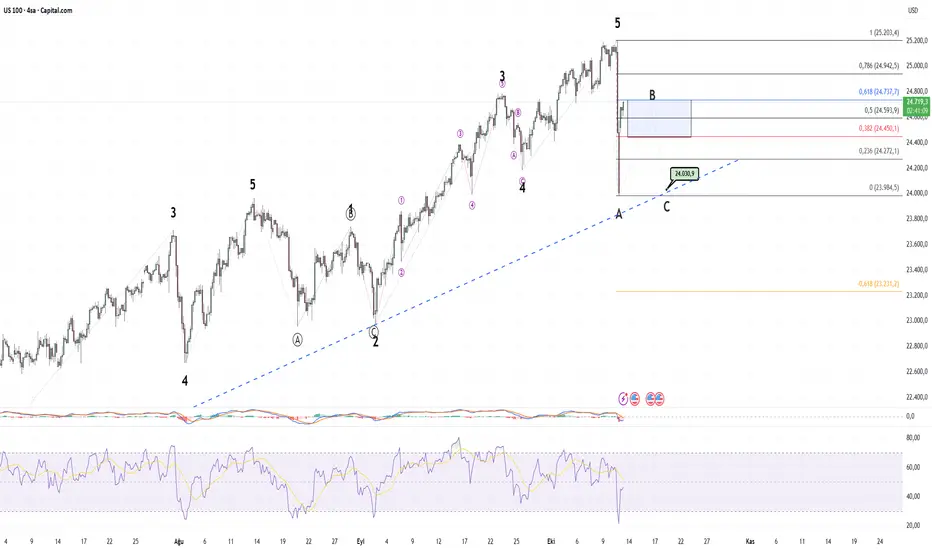
US100 – H4 Elliott & Yol Haritası Özet: Sarı (V) tepe sonrası yapının A–B–C düzeltmeye girdiğini düşünüyorum. B dalgası 0.786 (≈ 24.945) çevresinde ve yükselen kama içinde tamamlanma sinyali verdi; ardından ChoCH oluştu. Ana senaryo, C dalgasında aşağı yönün sürmesi.
Yapı ve Beklenti
Trend bağlamı: 5 dalgalık ana impuls bitti → düzeltme fazı.
B dalgası: 0.786 geri çekilmesine (24.900–25.000) kadar yükseliş; kama ve ChoCH ile zayıflama.
C dalgası hedefi: İlk yoğun bölge 23.800–23.600 gri kutu ((iii) etiketi). Daha derinde 23.40K civarı (v) uzaması ihtimali masada.
Kilit Bölgeler
Dirençler
-24.900–25.000 → B dalgası/0.786, ilk reddedilme alanı.
-25.150–25.250 → OB + kanal üst bandı (B genişlerse yeni satış alanı).
-25.520 → Alternatif senaryonun iptali/stop için üst sınır.
Destekler
-24.660–24.600 → kısa vadeli ara destek, altı hızlandırır.
-24.400–24.300 → diyagonal trend desteği.
-24.000 → psikolojik.
-23.800–23.600 → ana hedef kutusu (C (iii)).
-23.400 → agresif uzama (C (v)).
Momentum (RSI 4H): 50 eşiği altında kaldıkça satış baskısı güçlü. 50 üstüne kalıcı atamazsa, aşağı kırılımlar teyit oluşturur.
İş Planı (operasyon şablonu)
Senaryo 1 – Ana (tercihim): B’den reddedilme → C aşağı
Tetik: 24.90–25.00K bandında reddedilme + M15/H1 ChoCH / LH oluşumu.
Giriş: Kısa;
SL: 25.050–25.100 üstü (kama üstüne tampon).
Hedefler: 24.660 → 24.400/24.300 → 24.000 → 23.800–23.600 (ana boşaltım).
Yönetim: Her hedefte kademeli realize, HL üzerinde trailing (son LH/LH-1).
Senaryo 2 – B genişler (sıkıştırma):
25.050 üzeri 4H kapanış gelirse, B genişlemesi kabul.
25.150–25.250 bandı ikinci satış penceresi;
SL: 25.520 üstü.
Hedefler yine 24.660 → 24.400 → 24.000 → 23.800–23.600
Senaryo 3 – Erken kırılım (tetik altı):
24.660 altı 1H kapanışta direkt trend çizgisine (24.350–24.300) ve ardından 24.000 / 23.800–23.600 hızlanma beklerim.
Ters/Destekleyici Sinyaller
Geçersizlik: 25.502 üzeri 4H kapanış → düzeltme görüşü zayıflar, sayım revizyon gerektirir.
Alıcı bölge izleme: 23.800–23.600'de iğne + dönüş mumu (engulfing/pin), OB testi ve RSI’da failure swing görülürse orta vadeli tepki için izlenir.

NASDAQ ANALİZ#NASDAQ 24.713 seviyesi kırıldıktan sonra fonlar “dipten alıcı kılığıyla likidite topluyorum” moduna girdi.
Şu an fiyat 24.863 civarında, 24.900 – 24.960 bandı ilk tepki satıcısının beklediği yer. Bu bölgeye gelişi ben “niyet testi” olarak okuyorum – alıcılar gerçekten güçlü mü yoksa sadece short squeeze mi izliyoruz, belli olacak.
RSI 59.3, ne aşırı alımda ne de zayıf – yani momentum temiz ama agresif değil.
MACD histogramı toparlanma sinyali veriyor fakat henüz sıfır çizgisine vurmuş değil, bu yüzden 24.960 üzerinde saatlik kapanış görmeden ‘trend dönüyor’ demem.
24.713 artık psikolojik pivot. Bu seviyenin altı 24.412’ye kadar boş. Fonlar oraya kadar alanı temizleyip alıcıları tekrar yoklayabilir.
Eğer 24.960 – 25.201 bandına spike atılırsa, orayı “hedge alanı – short zone” olarak okuyorum. 25.201 kırılırsa oyun değişir, kırılmazsa buradan yine tokadı basarlar.

#NasdaqNasdaq 4 saatlik grafikte 25.000 üzerinde 4 saatlik kapanış gelmediği sürece alt bölge kanalımız olan 23.367 seviyelerini tekrardan test edebilir.

NDX Nasdaq Çok Kötü Günler BekliyorEn doğru short posizyonlarından bir diğeri de NDX Nasdaq ekliyoruz portföyümüze. 2019 yılında 6000 puandan başlayan süreçte günümüz 2025 yılına geldiğimizde 24,745 seviyelerine kadar geldiğini görüyoruz. Yıllardır süren bu yükselişin temel sebebini ulusal piyasada doların spekülatif gücü olduğunu söylemek mümkün. Ancak bu yükselişlerinin sonuna geldiğimizi gerek momentum da başlayan yatay gevşeme gereksede ,rvi+obv,donchian kanalı göstergelerinden kanal içerisine bir hareketin başlangıc seviyeleri olduğunu öngörüyorum. Neticede Envelope de aynı kanal aralığında olması gerektiğini hatırlatıyor bize.
Sonuç itibari ile spekülatif yıllardır süren bu yükselişin bir müddet yavaşlaması ve kademli satış baskılarının gelmesi ve ciddi bir düzeltmenin eşiğinde olduğunu söyleye biliriz. Aksi halde uzun vadede NDX'in yükseliş trendinin devamının geleceğini söyleyemeyiz. Ancak şu aşamalarda bu sürecin durgunluk ve kar satışları sonucu düşüş trendinin haftalık olarak başladığını belirtebiliriz.
Shortlamak için şahsen bundan daha güzel bir zamanlama olamaz diyebilirim.

#NasdaqNasdaq 4 saatlik grafikte 24.890 üzerinde 4 saatlik kapanış gelmediği sürece alt bölge kanalımız olan 24.050 seviyelerini tekrardan test edebilir.

Nasdaq 6 Aylık Ayı Sezonuna Devam EtmekteSizler için bir alım planı hazırladım. Fiyatlar belli, yüzdelikler belli.
10.000$ Yatırım için parası olan bir kişi hangi fiyatlardan kaç dolar alım yapmalı bunu Chatgpt yardımıyla dosyalattırdım.
Bu strateji "Ben uzun vadede gelecek olan yükselişler için garanti şekilde hazır olmak istiyorum. Yani olabildiğince fazla miktarda mal toplayayım geleceğim garantide olsun."
Diyenler için en ideal stratejidir.
Normalde düştükçe daha fazla yüzdelikle alım yapılır. DCA denir buna.
Fakat kesinlikle ben bu düşüşleri indirimleri kaybetmek istemiyorum derseniz benim her zaman önerim en üstten fazla yüzdelik ile alım yaparak düştükçe daha az yüzdelik ile alım yapmaktır.
Çünkü eğer mermilerinizin çoğunu daha aşağılar için saklarsanız fiyat oralara hiç gelmeden uçup gidebilir ve siz de trene arkasından bakakalırsınız.
Risk alınacak bir yüzyılda değiliz artık.
Ya Zengin/Varlıklı olacaksınız yada yok olacaksınız.

NASDAQ 100 (US100) Teknik & Temel Analiz#NASDAQ saatlik grafik,
🔧 Teknik Analiz
#US100, 25.000 bölgesinden aldığı satışlarla geri çekilme sürecine girmiş durumda. Şu an fiyat 24.520 civarında işlem görüyor ve Fibonacci %61.8 (24.440) desteğini test ediyor. Bu bölge kısa vadede kritik — kırılması hâlinde 24.320 – 24.190 aralığına kadar bir geri çekilme görülebilir.
Fiyat, hem EMA50 (24.739) hem de EMA200 (24.901) altında seyrediyor. Bu, kısa vadeli momentumun hâlâ zayıf olduğunu ve boğaların kontrolü kaybettiğini gösteriyor.
POC (25.128) ise hâlen ana direnç konumunda; bu seviye üzerinde kapanışlar gelmedikçe güçlü bir yön değişimi beklenmemeli.
📊 Göstergeler
• RSI (14): 37.46 → Aşırı satım bölgesine yakın, tepki olasılığı artıyor.
• Hacim: 12.66K → Satışlarda artış, ancak düşüşün son barında hacim azaldı.
• Volume Profile / POC: 25.128 → En yoğun işlem seviyesi, güçlü direnç.
• Volume Delta: +1.3K → Zayıf da olsa alıcı tepkisi var.
• Bollinger Bandı: Alt banda temas etti, teknik tepki potansiyeli mevcut.
• Parabolic SAR: 24.845 üzerinde, düşüş trendi hâlâ aktif.
🧱 Destek / Direnç Seviyeleri
Destekler: 24.440 • 24.320 • 23.985
Dirençler: 24.739 • 24.901 • 25.128
📰 Temel Analiz
• ABD borsaları, son dönemde Trump’ın Çin ticaret söylemlerinin yumuşaması ile kısa süreli rahatlama yaşasa da, genel görünümde belirsizlik sürüyor.
• Fed üyelerinin "faiz indirimi takvimi" konusunda net sinyal vermemesi teknoloji hisselerinde satış baskısını artırıyor.
• Nasdaq şirketleri içinde (özellikle yapay zekâ ve yarı iletken hisseleri) yüksek değerlemelere yönelik endişeler devam ediyor.
• Dolar endeksindeki güçlenme ve ABD tahvil faizlerinin yeniden yükselişe geçmesi, risk iştahını sınırlayan bir faktör.

NASDAQ 100 (US100) Teknik & Temel Analiz#NASDAQ saatlik grafik,
🔧 Teknik Analiz
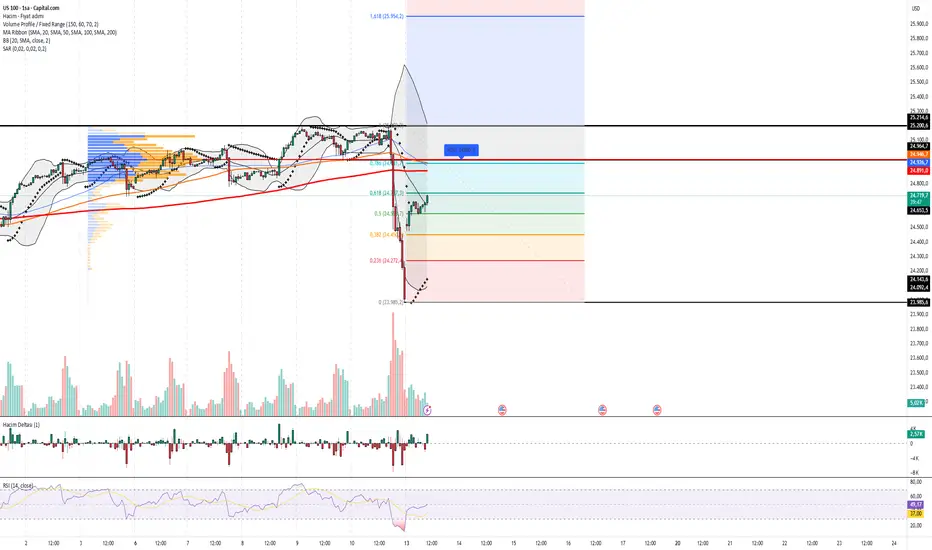
#US100 son sert düşüşten sonra 23.985 desteğinden güçlü bir tepki alarak yaklaşık %3 civarında yükseldi. Fiyat şu anda Fibonacci %61.8 düzeltme seviyesi olan 24.723 civarında işlem görüyor. Bu seviye, kısa vadede yön tayini açısından oldukça kritik.
Fiyat, EMA50 (24.926) ve EMA200 (24.891) civarındaki konsolide direnç alanına yaklaşıyor. Bu bölgenin üzerinde kalıcılık sağlanırsa, 25.150 – 25.214 bandına kadar bir “recovery rally” (tepki yükselişi) görülebilir.
Aksi senaryoda, 24.450 – 24.270 arası geri çekilmeler yeniden test edilebilir. Bollinger orta bandına dönüş de bu düzeltmeyi destekliyor.
📊 Göstergeler
• RSI (14): 49.20 → Nötr, toparlanma işareti.
• Hacim: 4.46K → Tepki alımı hacimle desteklenmiş durumda.
• Volume Profile / POC: 24.986 → Ana direnç noktası, bu bölge geçilmedikçe satış baskısı sürebilir.
• Volume Delta: +2.54K → Alıcılar yeniden kontrolü ele alıyor.
• Bollinger Bandı: Fiyat alt bandtan toparlanıp orta banda yaklaşmış, yukarı momentum artıyor.
• Parabolic SAR: 24.143 altında, yükseliş trend dönüş sinyali aktif.
🧱 Destek / Direnç Seviyeleri
Destekler: 24.272 • 24.042 • 23.985
Dirençler: 24.723 • 24.986 • 25.214
📰 Temel Analiz
• Nasdaq endeksi, ABD-Çin ticaret gerilimlerine rağmen teknoloji hisselerinin öncülüğünde toparlandı.
• Faiz indirim beklentileri ve Fed’in “veri odaklı” mesajları piyasada yeniden alım iştahı yaratıyor.
• Özellikle yarı iletken hisseleri ve AI temalı şirketlerdeki pozitif görünüm Nasdaq’ı destekliyor.
• Ancak jeopolitik ve politik belirsizlikler kısa vadede volatiliteyi artırabilir.
US100 | 4H Elliott GüncellemesiYapı: 1–2–3–4–5’lik impuls tamamlandı. Ardından sert bir A dalgası geldi; şimdi B düzeltmesinin içindeyiz.. Senaryo, klasik A–B–C düzeltmesi.
Plan (kurallı):
B bölgesi: A dalgasının %38,2–%61,8 geri çekilmesiyle uyumlu 24737 çok nadirde olsa %78.6 seviyesi olan 24940a temas etme ihtimali de var.
C hedefi: A≈C eşitliği ve yaygın projeksiyonlarla ≈ 23,606 öne çıkıyor. (Alternatif: alttan gelen direnç çizgisi ve gördüğü bir önceki desteği baz alarak 24030 hedeflenebilir.)
İnvalidation (senaryonun zayıflaması): 25.203k üzeri günlük kapanış → B’nin uzaması/yeniden sayım riski artar.
Momentum/RSI çerçevesi: 5. dalga sonrası görülen aşırı bölge dönüşleri B’den C’ye sarkma ihtimalini destekler; B içinde ivme zayıflarsa C bacağına geçiş kolaylaşır.
Risk yönetimi – işlem fikri (eğitim amaçlı):
B bandına yaklaşan tepki yükselişlerinde kademeli satış düşünülür;
SL: B bandı üzeri günlük kapanış (25.203k)
TP: İlk hedef 24030 sonrasında 23,606; fiyat davranışına göre kârın bir kısmı korunup devam senaryosu yönetilir.
Not: Elliott sayımları olasılık temellidir; yeni fiyat verisi sayımı güncelleyebilir. Yatırım tavsiyesi değildir (YTD).
Etiketler: #US100 #NASDAQ100 #ElliottWave #ABC #TeknikAnaliz #RiskYönetimi #YTD