Lancelot Band - ATR Reversal+Trending IndicatorThis is an indicator I created recently, with the mind of spotting where price might reverse and where the price is trending. You can see this as the primary indicator for your system, however, it is recommended you use this in conjunction with other confirmation indicators.
This script focus solely on ATR or Average True Range.
This indicator is the combination of the baseline from the Ichimoku cloud and the concept of the Keltner channel.
Baseline period = 14
ATR period = 14
ATR Mult = 1.5
For reversal
Long when price crossover Lower band & Stop loss at xLower band
Sell when price crossunder Upper band & Stop loss at xUpper band
For Trend Following
Long when price crossover xUpper band and Stop loss at Upper band
Short when price crossunder xLower band and Stop loss at Upper band
Again, you will need other indicators to help you to succeed in this system. This indicator will not generate the best exit for your position but will generate a good entry signal when you use it with both volume indicator and exit indicator.
Works well on BTCUSD XBTUSD, as well as other major liquid Pair.
Feel free to follow me on Twitter @Lancelot_Auger for more free Alpha.
Please acknowledge my effort by like and follow.
And lastly,
Save Hong Kong, the revolution of our times.
XBTUSD

Alert-QuarryLake Indicator Map - ATR Trend Following Strategy A lot of times I don't like my chart crowding with indicators, thus the reason for creating this script for my strategy QuarryLake.
This script also comes with alert.
Below is the explanation for QuarryLake
I have also updated the script in version 4.
This strategy consists of 3 indicators that I found works quite well together.
Keltner Channel, Waddah Attah Explosion, and Volatility Stop.
You can find WAE here
KC Period = 200
KCATR = 5
Vstop Period = 3
Vstop Mult = 1.5
Long when close > KC, close > Vstop, WAE trendUp
Short when close < KC, close < Vstop, WAE trendDown
Works well on BTCUSD XBTUSD, as well as other major liquid Pair.
Feel free to follow me on Twitter @Lancelot_Auger for more free Alpha.
Please acknowledge my effort by like and follow.
And lastly,
Save Hong Kong, the revolution of our times.

Trend Confirmation Indicator - Triple OBVDear all, you might wonder is there a confirmation indicator that has a high hit rate, is dependable, and could rely on the information it gives you when making a decision?
Here I present an indicator I developed specifically for cryptocurrency, in the minds of eliminating fakeouts and traps.
Trend is always invalid then there is a lack of volume, so by tracking the momentum of price direction & volume, we can have a ballpark about where the market is moving to.
On balance volume
obvshort = ema3
obvmedium = ema9
obvlong = ema26
This is a lagging indicator, which means it's not good at predicting reversal.
This is also the reason why
long signal = obvshort > obvmedium and obvshort > obvlong
shortsignal = obvshort < obvmedium and obvshort < obvlong
both without obvmedium >< obvlong
This indicator will not lie to you.
At last
Save Hong Kong, the revolution of our time.

CloudRest ATR based cloudThis is an indicator I have been working on for the past 2 years, developed specifically for cryptocurrency.
It is primarily a trend following indicator with great success and it performs the best in 4hrs to the weekly chart.
There are two components of this indicator.
The baseline from Ichimoku cloud and volatility stop .
baseline period = 26
volatility stop = 1.5ATR, 3
You can view this as the main component of a trend following system but you will need other confirmation indicators to confirm your entry.
Feel free to modify the script for your own system.
Feel free to follow me on twitter @Lancelot_Auger
I will be posting more content in the future, stay tuned.
And lastly,
Free hong kong, the revolution of our time!

AlphaTradeZone OscillatorAccurate momentum indicator with buy and sell alerts.
Applied to BTC price on 1h timeframe it's giving accurate price predictions.


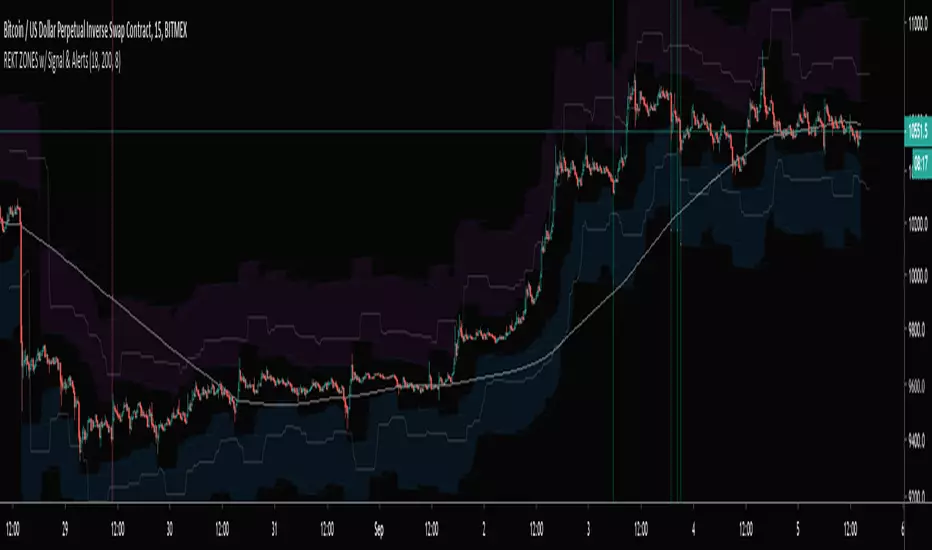
REKT ZONES w/ Signal & AlertsBitmex XBTUSD REKT ZONES with entry signal, stop, target, and alerts! Only use on a 15min charts
MACD Builder ProOur newest indicator, the MACD Builder Pro, gives traders the ability to build a MACD based on 7 different kinds of moving averages. The options include:
1.Standard MACD (EMA)
2.Hull Moving Average MACD
3.Volume Weighted MACD (VWMA)
4.Arnaud Legoux MACD (ALMA)
5.Double EMA MACD
6.MACD based on median
7. Simple Moving Average (SMA) MACD
Additionally, we've included countless plotting options for users to choose from. Users can choose to plot either the MACD or MACD Histogram in addition to the signal line. There is also an option to have the entry and exit signals displayed as green(entry) and red(exit) triangles for the entry and exit signals or red and green vertical highlight lines.
We've also provided the ability to fully customize the entry and exit conditions for the indicators trading logic. As mentioned, we've included over 7 different types of MACD indicators. But, we also included the ability to customize the lengths of the fast and slow Moving Averages used in the MACD calculation, as well as the length of the signal line. For entry conditions, the different options are:
1. MACD Histogram Above/Below Zero- Entry signals are generated when MACD Histogram crosses above the zero line into positive territory and exit signals come when the MACD Histogram crosses under the zero line into negative territory.
2. MACD Histogram Rising/Falling - Entry signals are generated when MACD Histogram first begins rising and exits when MACD Histogram first starts decreasing.
3. MACD Above/Below Zero - Entry signals are generated when MACD crosses above the zero line into positive territory and exit signals come when the MACD crosses under the zero line into negative territory.
4. MACD Rising/Falling - Entry signals are generated when MACD first begins rising and exits when MACD first starts decreasing.
As always, this script comes with pre-set alerts and we will be offering 3 day trials to anyone interested!
To check out more of our indicators head on over to our website : profitprogrammers.com

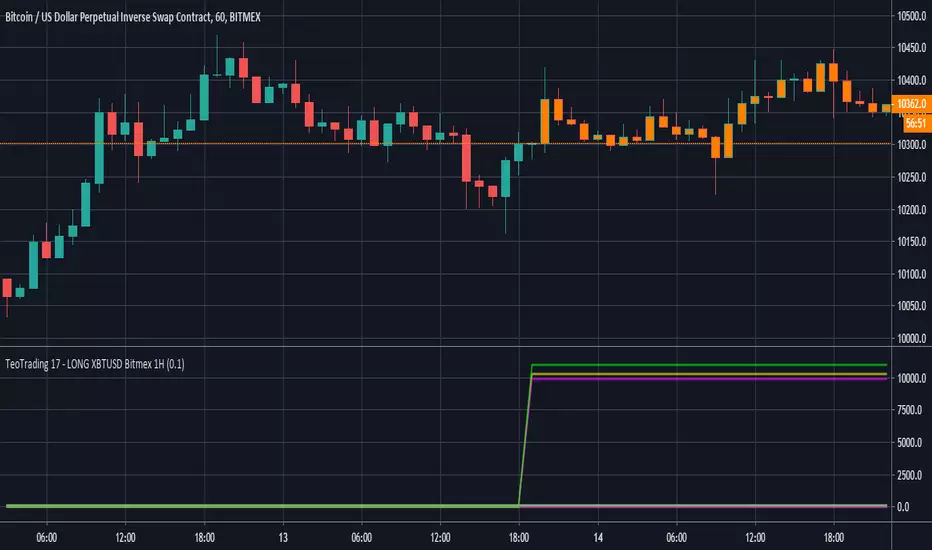
TeoTrading 17 - LONG XBTUSD Bitmex 1HLong Strategy for XBTUSD - Bitmex with real time statistics.
For use in 1 Hour Scale.
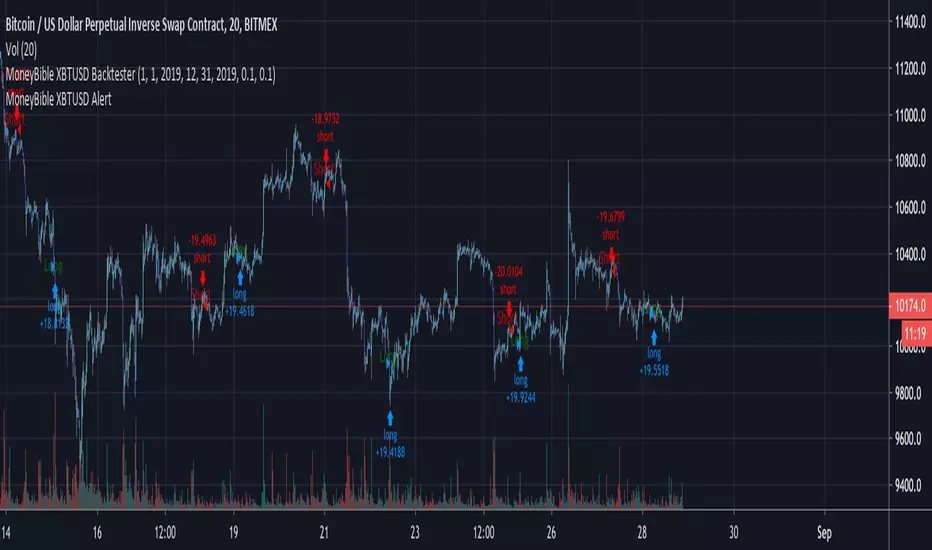
MoneyBible XBTUSD AlertMoneyBible BITMEX:XBTUSD alert on 10m candlestick . It will be re-optimized monthly.
The script is written in PineScript V.3, makes no use of the security() function and does not use the Trailing Stop-Loss function from TradingView. No repainting issue.
Backtester here :
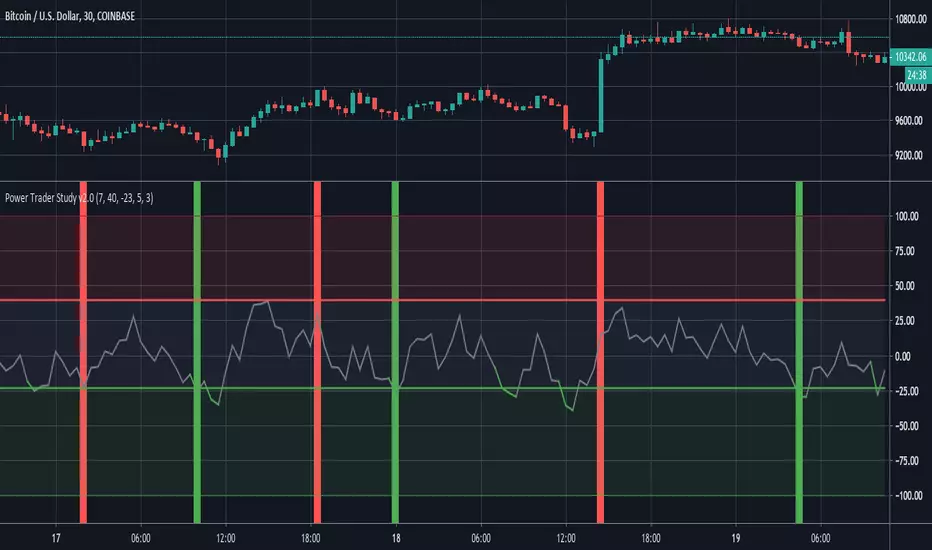
Power Trader Study The Power Trader is an indicator based around the Balance of Power Oscillator. Balance of Power is a price-based measurement that evaluates and compares the strength of buyers and sellers by assessing their respective abilities to push prices to extreme points(both extreme highs and extreme lows).
BoP values fluctuate between a maximum value of 100 and a minimum value of -100. When the BoP value is greater than 0, it indicates that buying pressure is greater than selling pressure. Conversely, negative BoP readings mean that selling pressure is greater than buying pressure.
The exponential moving average of Balance of Power values is displayed as a gray line on the chart. The upper red line represents the upper bound at which a security is considered overbought. The lower green line represents the threshold where we start to consider a security to be in an oversold state.
When the gray BoP EMA line crosses below the lower green line, it changes color to green then changes back to gray once it crosses back above that lower threshold. Similarly, the line turns red when it crosses above the upper red line.
When the EMA line is between the upper and lower bounds, it signifies that there is no significant difference between the power of buyers versus the power of sellers. The top red area indicates that the amount of buying pressure is relatively high. The lower green area means that selling pressure is abnormally high.
When the BoP line falls between the red and green areas, do not take action. When the BoP line turns green and is inside the green area, enter a long position. When the BoP line rises above the red line and into the upper red area, exit the long position.
Entry signals are displayed as vertical green lines that extend the length of the chart. Exit signals are represented by the same lines, except in red.
Users can decide the order of signals in the input option menu through the ‘allow repeat signals’ parameter. If this is set to false, the study will generate signals in the logical chronologic order of . If it is set to true, then signals will be generated as they come, regardless of whether the last signal was its inverse. This means that it could generate sequences like this for example .
Additionally, the stop and limit can also be set in the input menu through the ‘stop’ and ‘limit’ options. This input option accepts parameters of type float (ie: numbers that contain decimals).
The 'Upper Bound for BoP Values' and 'Lower Bound for BoP Values' input options gives traders the option to adjust the upper and lower thresholds for buy and sell signals. It is important to note that setting the upper bound higher or the lower bound lower will result in less frequent signals (and vice versa).
When it is time to enter a long position, an alert with the following message is sent “Power Trader - High Sell Pressure, Enter Long”.
When it is time to exit a long position, an alert with the following message is sent “Power Trader - High Buy Pressure, Exit Long”.
The Power Trader, along with all of our other invite-only scripts, can be found on our website:
profitprogrammers.com
Double RSI StudyHere is the study version of our recent Double RSI strategy based on a Hull RSI and ALMA RSI.
The study version includes alerts for signals generated by both RSI's. It also includes an option to allow repeat signals, as well as tons of plotting options, etc.
If interested in a 3 day trial, feel free to send a message and check out our website ProfitProgrammers.com !


Relative Vigor IndexHere we are looking at a trend strength indicator based on the Relative Vigor Index(RVI). The RVI measures trend strength by comparing the open-close and high-low ranges for the current and three most recent periods. As a zero-centered oscillator, the RVI oscillates above and below zero to signal the strength of the trend.
As there are different ways to interpret the RVI, we have included 3 different modes for traders to choose from in the input option menu:
1. Zero-Crossing:
The RVI Histogram will turn green when it crosses above zero and red when it crosses below. Therefore, a green RVI means the trend is bullish and red means bearish. This mode is better for longer-term swing trading in comparison to the other 2 modes.
2. Increasing / Decreasing:
The RVI histogram will turn green when it is increasing(rvi >= rvi ) and red when it is decreasing. A green RVI is viewed as a bullish signal and red means bearish. This mode is a good middle-ground between the Zero-Crossing and Signal Comparison modes.
3. Signal Comparison:
Here, the RVI is compared to its signal line. If the RVI is greater than its signal line, the histogram is green, indicating a bullish trend, while red means bearish. This mode is preferred for scalping.
Hope everyone finds this one useful!
You can check out our other invite only studies/strategies at our website: profitprogrammers.com

Pulse Profits+ Study v2.0Here is the updated version of our Pulse Profits+ study based on the combination of the Chande Momentum Oscillator and Elder's Force Index . This version was updated to include stop-loss and improved signals
Red background highlights mark sell signals and green highlights represent buy signals. All signals are accompanied by corresponding alerts that can be tailored for the various automated trading platforms.
All indicators can be found on our website in the bio and come with their strategy equivalents

VWMA Trend FilterHere's a simple tool for determining long term trend direction using two Volume Weighted Moving Averages (VWMA). The VWMA's emphasis on volume often makes it a better measurement for trend direction than the more popular Exponential Moving Average (EMA).
Trend direction is determined by comparing a fast and slow VWMA. The default length for the fast VWMA is 50 periods, while the slow uses a default length of 200. Both of these lengths can be modified in the input options menu. The default source for the VWMA's is HLC3((high + low + close) / 3).
If the fast VWMA is greater than the slow VWMA, then the trend is bullish and the background color is green. If the fast VWMA is less than the slow VWMA, then it is bearish and the background color is red.
We included an option to change the candle color based on whether the VWMA's indicate a bullish or bearish trend as well.
Overall, this is one of those utility tools that we like to use as an overlay over the main price chart and in conjunction with other signal generating indicators. Its purpose isn't to generate buy and sell signals, but it works well as a visual confirmation tool to help traders gauge trend direction.

Futures DeltaTakes Most Advanced futures contract and minuses Perp spot.
Unfortunately I need to manually update the contract so drop me a note when there is a new one.
Filb

Sentiment Zone OscillatorHere's a (forgotten but still useful) Sentiment Zone Oscillator. The Sentiment Zone Oscillator takes a sum of positive price candles over a user-specified window length. Normally, a triple exponential moving average of the sum is used, but we opted to just go with a double EMA for the sake of more responsiveness. When the histogram is green it is bullish and red/pink means bears.

Double EMA + ATR Trend FollowerThis indicator consists of a fast and slow EMA (default lengths are 50 and 9 periods) and an upper and lower ATR band. When combined, this combination gives traders an accurate picture of both trend strength and direction.
Users can modify the lengths of the fast and slow EMA , as well as the multipliers and length for the upper and lower ATR bands.

Hull RSI
This is an RSI that is smoothed with a faster Hull Moving Average. The upper pink and bottom teal lines represent the 95th and 5th percentiles of Hull RSI values over a window of user-defined length.
The two percentile bands function identically to the traditional upper and lower bounds used in the standard RSI setup. Buy signals are plotted as the vertical green background highlights and sell signals are the red highlights. Buy signal is generated when RSI is below the lower teal line and then crosses above it. Sell signals occur when Hull RSI was previously above the upper pink line and then crosses back under.

Kairi Relative Index Leading IndicatorHere is a leading indicator based on the relatively obscure Kairi Relative Index. The Kairi comes from Japan and is similar to the popular RSI, although it is believed that it predates the RSI significantly.
The Kairi measures the difference between the current price and its SMA as a percentage of the moving average.
We made a few modifications to the Kairi to improve its timing and balance its sensitivity. First, we calculated a 'fast' and 'slow' Kairi Relative Index. To do this, it calculates the difference between the current price and a SMA with a length of 7 periods for the fast Kairi. Then, the difference between the current price and an SMA of length 24 is calculated for the slow Kairi.
The big modification is using a 25 period SMA of slow Kairi Relative Index values as the threshold for buy and sell signals. When the fast Kairi line crosses above the white line(the threshold) it is considered a bullish signal, while a bearish signal comes when it crosses back below the same white line. This solved the issue with the Kairi having slower reaction time than the RSI. As the chart shows, this setup allowed it to catch not only major trends but also predict unexpected price spikes.
Users can adjust all 3 lengths, as well as adjust the option to have the slow Kairi displayed on the chart(shown in second pane).

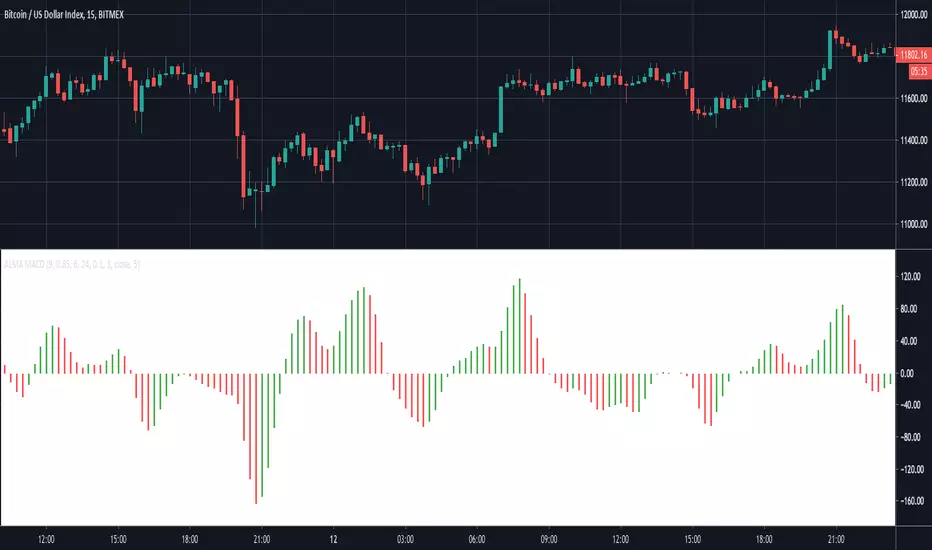
ALMA MACDThis indicator creates a MACD based on Arnaud Legoux Moving Averages (ALMA). I prefer this implementation over the standard MACD based on exponential moving averages as it filters out most of the minor price fluctuations that lead to false signals.
To learn more check out our other posts about the Arnaud Legoux Moving Average:
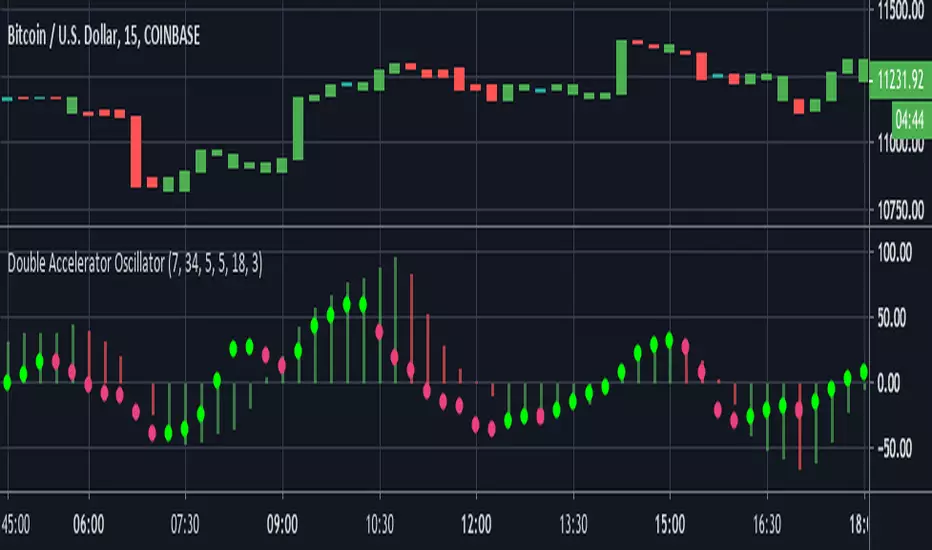
Double Accelerator OscillatorThis is a modified version of Bill Williams' Accelerator. The Accelerator measures the difference between the Awesome Oscillator(another Williams indicator) and its 5 day SMA.
This script plots 2 accelerators rather than 1. Users can define the lengths of the fast and slow SMA's used in the Awesome Oscillator calculation by adjusting the options in the input menu.
We set the default the lengths of the fast and slow SMA's used in the first Awesome Oscillator calculation as 34 and 7 periods. Then to find the Accelerator Oscillator, the difference between the Awesome Oscillator and its 7 period SMA is calculated. The second Accelerator uses shorter window lengths than the first. The fast SMA length is 5 by default and the slow SMA length is 18. Finally, the length of the Awesome Oscillator SMA used to calculate the second Accelerator Oscillator is 3.
By utilizing two Accelerator Oscillators with increasingly shorter window lengths, this indicator identifies changes in momentum very well.
The red and green histogram represents the first Accelerator Oscillator. It is green when the Accelerator is increasing and red when it is decreasing. I found this layout to be more practical than the standard, which plots the AC as green when it is greater than 0 and red when less than zero. The second Accelerator Oscillator is plotted as the bright green and pink circle line. It uses the same coloring conditions as above.