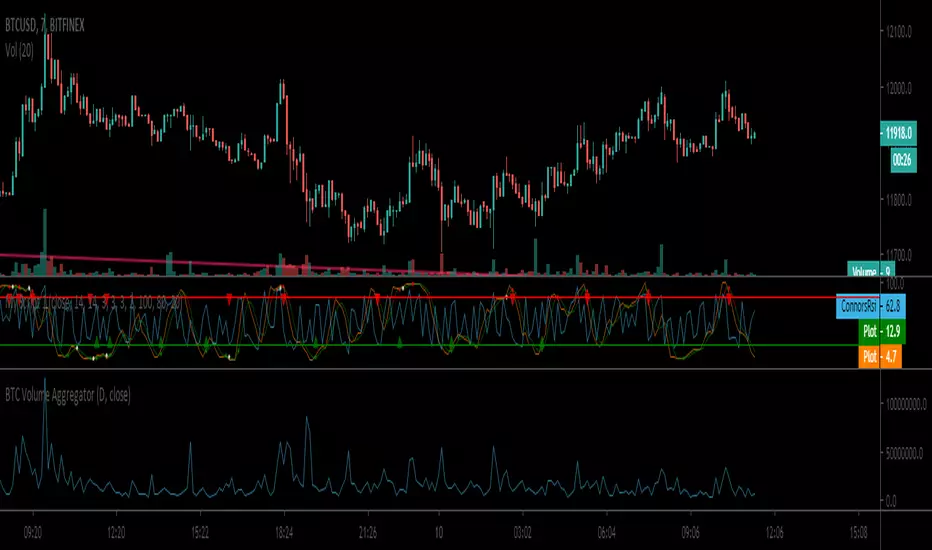
BTC Volume Aggregator"Volume Aggregator" indicator gathering the volume data from usd markets usdt markets and contracts. I will expand is euro, Korean and china pairs.
X-volume
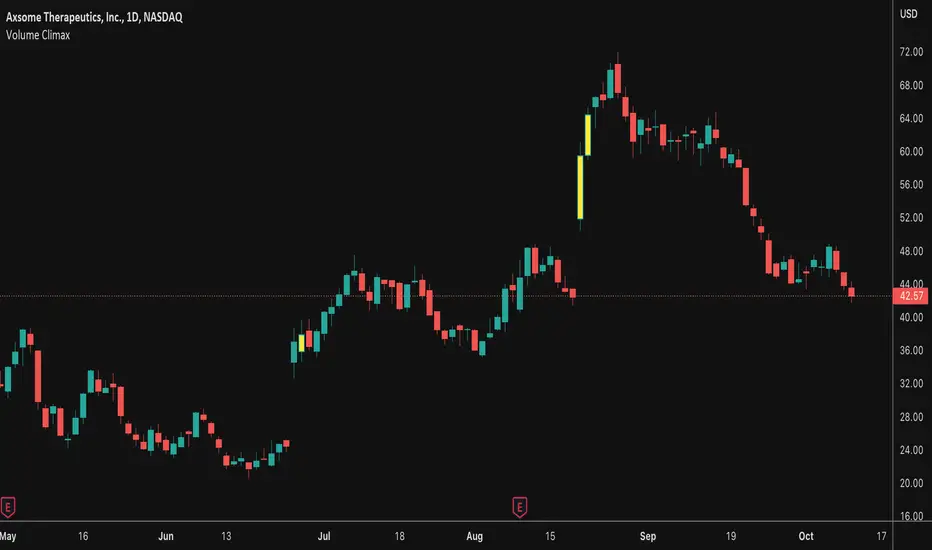
Volume ClimaxThis indicator couples RSI oversold and overbought regions with unusual volume . Often times you will see the final leg of a trend exhaust itself with this volume climax. This indicator is meant to help spot these instances.
User has the ability to customize oversold and overbought regions as well as a multiplier for how much more the volume needs to be relative to the 20 SMA . You can also set an alert with this indicator.
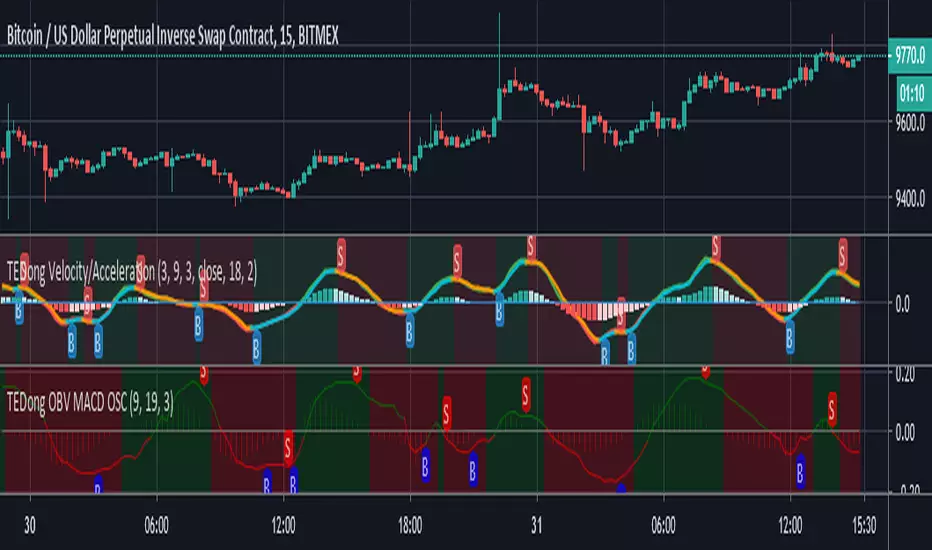
TEDong OBV MACD OSC ==> ProfitHi, Folg,
OBV MACD OSC gives a Buy signal when the OBV value crosses up its EMA and a Sell signal when it crosses down its EMA.
Cross over markers Directional bgcolor, where RED for bearish (S) and GREEN for bullish (B)
If you include volume analyses in your trading strategy, automating OBV MACD OSC will give buy signals whenever volume and price are rising altogether.
DONATE/TIP
BTC: 13nhMN2H4LoRi4VMcPcyR96jitxrH3uivB
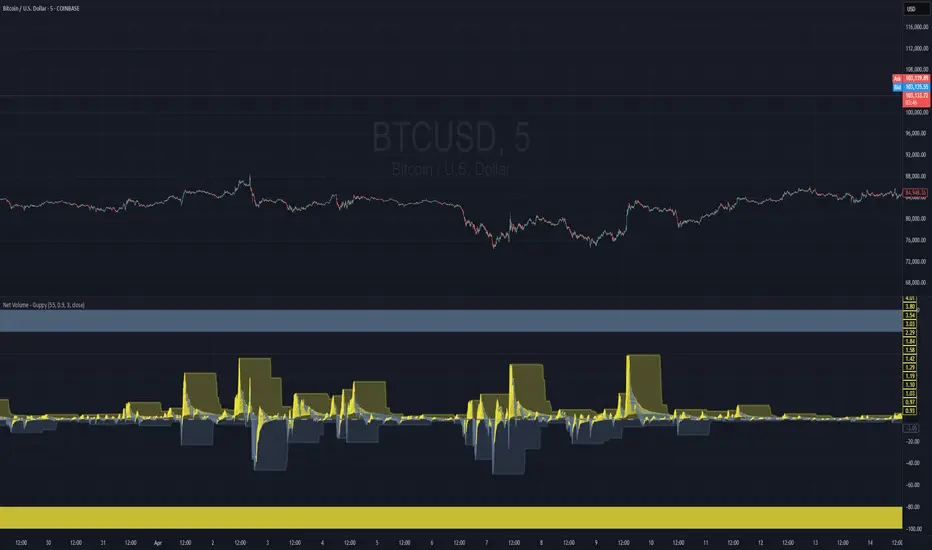
Net Volume - GuppyDisplays the net volume filtered via ALMA in different bands. Default length is 90. It is divided and multiplied into shorter and longer lengths from the mean (the source length). As the faster band crosses the bands towards the mean the color changes. Above 0 net volume is towards the buyers, below 0 the sellers.
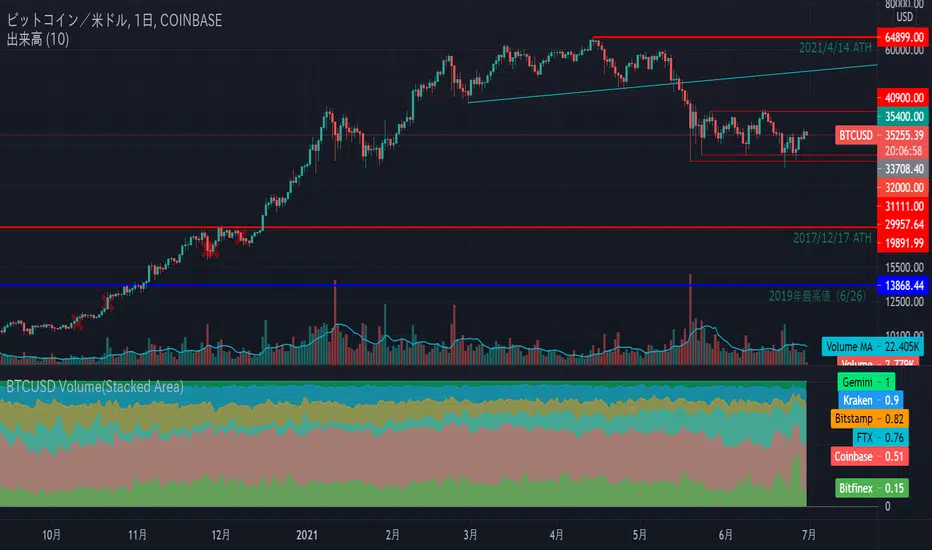
BTCUSD Volume(100 Percent Stacked Area Chart)
Display the volume of 4 exchanges with BTC / USD pair in 100% stacked area chart.
The target exchanges are 3 companies that BitMEX refers to indexes (Coinbase, Bitstamp, Kraken).
And I'm adding Bitfinex, which I think has a strong impact on the market.
If you uncheck the "100 Percent Stacked Area Chart", the volumes of each exchange will be displayed in piles.
Volume Profile Free Ultra SLI (100 Levels Value Area VWAP) - RRBVolume Profile Free Ultra SLI by RagingRocketBull 2019
Version 1.0
This indicator calculates Volume Profile for a given range and shows it as a histogram consisting of 100 horizontal bars.
This is basically the MAX SLI version with +50 more Pinescript v4 line objects added as levels.
It can also show Point of Control (POC), Developing POC, Value Area/VWAP StdDev High/Low as dynamically moving levels.
Free accounts can't access Standard TradingView Volume Profile, hence this indicator.
There are several versions: Free Pro, Free MAX SLI, Free Ultra SLI, Free History. This is the Free Ultra SLI version. The Differences are listed below:
- Free Pro: 25 levels, +Developing POC, Value Area/VWAP High/Low Levels, Above/Below Area Dimming
- Free MAX SLI: 50 levels, 2x SLI modes for Buy/Sell or even higher res 150 levels
- Free Ultra SLI: 100 levels, packed to the limit, 2x SLI modes for Buy/Sell or even higher res 300 levels
- Free History: auto highest/lowest, historic poc/va levels for each session
Features:
- High-Res Volume Profile with up to 100 levels (line implementation)
- 2x SLI modes for even higher res: 300 levels with 3x vertical SLI, 100 buy/sell levels with 2x horiz SLI
- Calculate Volume Profile on full history
- POC, Developing POC Levels
- Buy/Sell/Total volume modes
- Side Cover
- Value Area, VAH/VAL dynamic levels
- VWAP High/Low dynamic levels with Source, Length, StdDev as params
- Show/Hide all levels
- Dim Non Value Area Zones
- Custom Range with Highlighting
- 3 Anchor points for Volume Profile
- Flip Levels Horizontally
- Adjustable width, offset and spacing of levels
- Custom Color for POC/VA/VWAP levels, Transparency for buy/sell levels
WARNING:
- Compilation Time: 1 min 20 sec
Usage:
- specify max_level/min_level/spacing (required)
- select range (start_bar, range length), confirm with range highlighting
- select volume type: Buy/Sell/Total
- select mode Value Area/VWAP to show corresponding levels
- flip/select anchor point to position the buy/sell levels
- use Horiz Buy/Sell SLI mode with 100 or Vertical SLI with 300 levels if needed
- use POC/Developing POC/VA/VWAP High/Low as S/R levels. Usually daily values from 1-3 days back are used as levels for the current day.
SLI:
use SLI modes to extend the functionality of the indicator:
- Horiz Buy/Sell 2x SLI lets you view 100 Buy/Sell Levels at the same time
- Vertical Max_Vol 3x SLI lets you increase the resolution to 300 levels
- you need at least 2 instances of the indicator attached to the same chart for SLI to work
1) Enable Horiz SLI:
- attach 2 indicator instances to the chart
- make sure all instances have the same min_level/max_level/range/spacing settings
- select volume type for each instance: you can have a buy/sell or buy/total or sell/total SLI. Make sure your buy volume instance is the last attached to be displayed on top of sell/total instances without overlapping.
- set buy_sell_sli_mode to true for indicator instances with volume_type = buy/sell, for type total this is optional.
- this basically tells the script to calculate % lengths based on total volume instead of individual buy/sell volumes and use ext offset for sell levels
- Sell Offset is calculated relative to Buy Offset to stack/extend sell after buy. Buy Offset = Zero - Buy Length. Sell Offset = Buy Offset - Sell Length = Zero - Buy Length - Sell Length
- there are no master/slave instances in this mode, all indicators are equal, poc/va levels are not affected and can work independently, i.e. one instance can show va levels, another - vwap.
2) Enable Vertical SLI:
- attach the first instance and evaluate the full range to roughly determine where is the highest max_vol/poc level i.e. 0..20000, poc is in the bottom half (third, middle etc) or
- add more instances and split the full vertical range between them, i.e. set min_level/max_level of each corresponding instance to 0..10000, 10000..20000 etc
- make sure all instances have the same range/spacing settings
- an instance with a subrange containing the poc level of the full range is now your master instance (bottom half). All other instances are slaves, their levels will be calculated based on the max_vol/poc of the master instance instead of local values
- set show_max_vol_sli to true for the master instance. for slave instances this is optional and can be used to check if master/slave max_vol values match and slave can read the master's value. This simply plots the max_vol value
- you can also attach all instances and set show_max_vol_sli to true in all of them - the instance with the largest max_vol should become the master
Auto/Manual Ext Max_Vol Modes:
- for auto vertical max_vol SLI mode set max_vol_sli_src in all slave instances to the max_vol of the master indicator: "VolumeProfileFree_MAX_RRB: Max Volume for Vertical SLI Mode". It can be tricky with 2+ instances
- in case auto SLI mode doesn't work - assign max_vol_sli_ext in all slave instances the max_vol value of the master indicator manually and repeat on each change
- manual override max_vol_sli_ext has higher priority than auto max_vol_sli_src when both values are assigned, when they are 0 and close respectively - SLI is disabled
- master/slave max_vol values must match on each bar at all times to maintain proper level scale, otherwise slave's levels will look larger than they should relative to the master's levels.
- Max_vol (red) is the last param in the long list of indicator outputs
- the only true max_vol/poc in this SLI mode is the master's max_vol/poc. All poc/va levels in slaves will be irrelevant and are disabled automatically. Slaves can only show VWAP levels.
- VA Levels of the master instance in this SLI mode are calculated based on the subrange, not the whole range and may be inaccurate. Cross check with the full range.
WARNING!
- auto mode max_vol_sli_src is experimental and may not work as expected
- you can only assign auto mode max_vol_sli_src = max_vol once due to some bug with unhandled exception/buffer overflow in Tradingview. Seems that you can clear the value only by removing the indicator instance
- sometimes you may see a "study in error state" error when attempting to set it back to close. Remove indicator/Reload chart and start from scratch
- volume profile may not finish to redraw and freeze in an ugly shape after an UI parameter change when max_vol_sli_src is assigned a max_vol value. Assign it to close - VP should redraw properly, but it may not clear the assigned max_vol value
- you can't seem to be able to assign a proper auto max_vol value to the 3rd slave instance
- 2x Vertical SLI works and tested in both auto/manual, 3x SLI - only manual seems to work (you can have a mixed mode: 2nd instance - auto, 3rd - manual)
Notes:
- This code uses Pinescript v3 compatibility framework
- This code is 20x-30x faster (main for cycle is removed) especially on lower tfs with long history - only 4-5 sec load/redraw time vs 30-60 sec of the old Pro versions
- Instead of repeatedly calculating the total sum of volumes for the whole range on each bar, vol sums are now increased on each bar and passed to the next in the range making it a per range vs per bar calculation that reduces time dramatically
- 100 levels consist of 50 main plot levels and 50 line objects used as alternate levels, differences are:
- line objects are always shown on top of other objects, such as plot levels, zero line and side cover, it's not possible to cover/move them below.
- all line objects have variable lengths, use actual x,y coords and don't need side cover, while all plot levels have a fixed length of 100 bars, use offset and require cover.
- all key properties of line objects, such as x,y coords, color can be modified, objects can be moved/deleted, while this is not possible for static plot levels.
- large width values cause line objects to expand only up/down from center while their length remains the same and stays within the level's start/end points similar to an area style.
- large width values make plot levels expand in all directions (both h/v), beyond level start/end points, sometimes overlapping zero line, making them an inaccurate % length representation, as opposed to line objects/plot levels with area style.
- large width values translate into different widths on screen for line objects and plot levels.
- you can't compensate for this unwanted horiz width expansion of plot levels because width uses its own units, that don't translate into bars/pixels.
- line objects are visible only when num_levels > 50, plot levels are used otherwise
- Since line objects are lines, plot levels also use style line because other style implementations will break the symmetry/spacing between levels.
- if you don't see a volume profile check range settings: min_level/max_level and spacing, set spacing to 0 (or adjust accordingly based on the symbol's precision, i.e. 0.00001)
- you can view either of Buy/Sell/Total volumes, but you can't display Buy/Sell levels at the same time using a single instance (this would 2x reduce the number of levels). Use 2 indicator instances in horiz buy/sell sli mode for that.
- Volume Profile/Value Area are calculated for a given range and updated on each bar. Each level has a fixed length. Offsets control visible level parts. Side Cover hides the invisible parts.
- Custom Color for POC/VA/VWAP levels - UI Style color/transparency can only change shape's color and doesn't affect textcolor, hence this additional option
- Custom Width - UI Style supports only width <= 4, hence this additional option
- POC is visible in both modes. In VWAP mode Developing POC becomes VWAP, VA High and Low => VWAP High and Low correspondingly to minimize the number of plot outputs
- You can't change buy/sell level colors from input (only transparency) - this requires 2x plot outputs => 2x reduces the number of levels to fit the max 64 limit. That's why 2 additional plots are used to dim the non Value Area zones
- You can change level transparency of line objects. Due to Pinescript limitations, only discrete values are supported.
- Inverse transp correlation creates the necessary illusion of "covered" line objects, although they are shown on top of the cover all the time
- If custom lines_transp is set the illusion will break because transp range can't be skewed easily (i.e. transp 0..100 is always mapped to 100..0 and can't be mapped to 50..0)
- transparency can applied to lines dynamically but nva top zone can't be completely removed because plot/mixed type of levels are still used when num_levels < 50 and require cover
- transparency can't be applied to plot levels dynamically from script this can be done only once from UI, and you can't change plot color for the past length bars
- All buy/sell volume lengths are calculated as % of a fixed base width = 100 bars (100%). You can't set show_last from input to change it
- Range selection/Anchoring is not accurate on charts with time gaps since you can only anchor from a point in the future and measure distance in time periods, not actual bars, and there's no way of knowing the number of future gaps in advance.
- Adjust Width for Log Scale mode now also works on high precision charts with small prices (i.e. 0.00001)
- in Adjust Width for Log Scale mode Level1 width extremes can be capped using max deviation (when level1 = 0, shift = 0 width becomes infinite)
- There's no such thing as buy/sell volume, there's just volume, but for the purposes of the Volume Profile method, assume: bull candle = buy volume, bear candle = sell volume
P.S. I am your grandfather, Luke! Now, join the Dark Side in your father's steps or be destroyed! Once more the Sith will rule the Galaxy, and we shall have peace...

Pump|Dump Tickerthis is just a study to investigate the pumps and dumps that have been happened in a crypto market and it should not be used as an indicator. this is also my very first Pine Script that I've written and I am sure it is not perfect. actually I am curious to know when (I mean the exact time of the day) most pumps and dumps happen as a self investigation. the method that is used to define pumps and dumps is not good (and I know that) but I will modify it for better result in next version.
to use this study, you should define whether you want to display pumps or dumps or both and also you should define percent of change (threshold).

Suspicious Volumethis script can use for detecting the suspicious volume. In this indicator the ratio of the current volume to the average of several previous candlesticks has been defined as standardized between 0 and 100. So when this indicator go to 100 we can understand that trading volume is increasing and vice versa.
Good luck
Emad Koosha

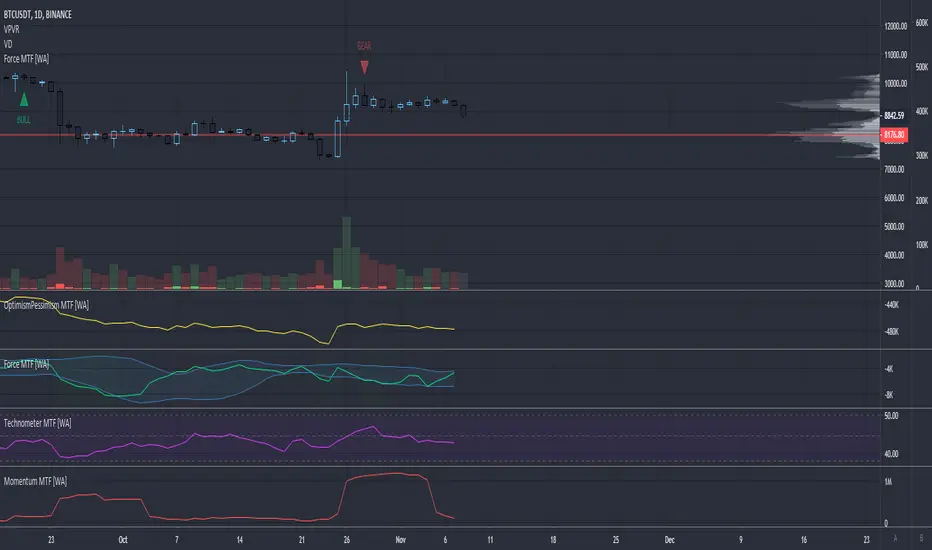
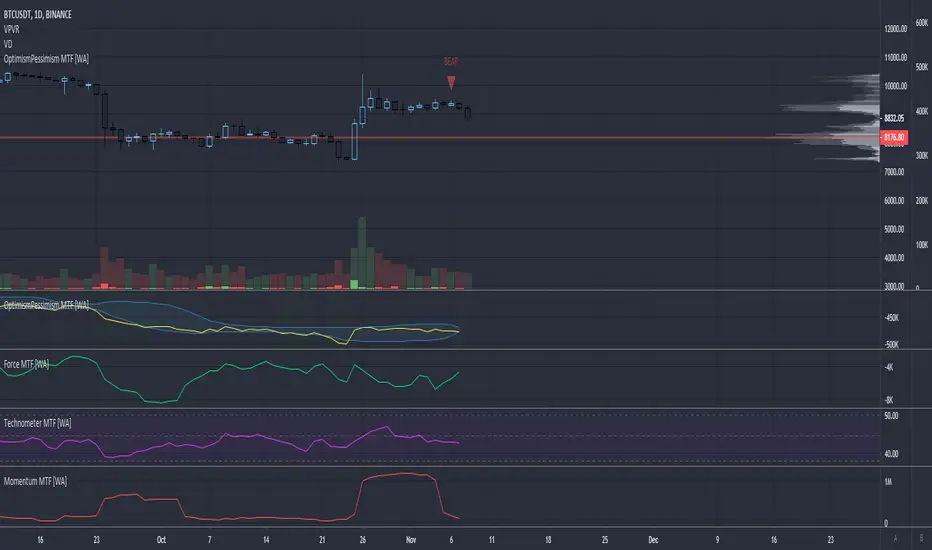
Momentum - Multi Timeframe [WYCKOFF ARSENAL]WYCKOFF ARSENAL is now available on TradingView!
Based on <> (Richard D. Wyckoff)
Noted Indicators:
▪ Optimism Pessimism Index
▪ Force Index
▪ Technometer
▪ Momentum ◄
Main Features:
▪ Multi Timeframe is available
▪ Volume based indicators
▪ Can be used on pairs that have volume data
────────────────────────────
Highlights
> Optimism Pessimism Index or OP
The value of the OP is not important.
The action of the OP is important.
The action of the index must be compared to its previous action or to the price index over the same period of time.
> Technometer or TEC
The purpose of the Technometer is to provide a mathematical indication of the degree to which the market is overbought or oversold.
The value of the Technometer could be as high as 100 or as low as 0.
The other possible values would represent degrees of overbought or oversold.
How to read the Technometer:
| Overbought means vulnerable to a reaction |
100 - completely overbought market.
── 60 - actual overbought extreme.
──── 50 or higher is considered to be clearly over bought.
────── lower than 50 - relatively overbought.
──────── Everything in between clearly overbought and clearly oversold is neutral.
────────── A reading of 44.4 is absolute neutrality.
──────── Everything in between clearly overbought and clearly oversold is neutral.
────── higher than 38 - relatively oversold.
──── 38 or lower is considered to be clearly over sold.
── 28 - actual oversold extreme.
0 - completely oversold market.
| Oversold means vulnerable to a rally |
> Force
The purpose of the Force Index is to provide an indication of the pressure being applied to push the market lower or the pull being applied to the market to pull it higher.
> Momentum
The purpose of the Momentum is to provide a measure of the speculative interest in the market.

Technometer - Multi Timeframe [WYCKOFF ARSENAL]WYCKOFF ARSENAL is now available on TradingView!
Based on <> (Richard D. Wyckoff)
Noted Indicators:
▪ Optimism Pessimism Index
▪ Force Index
▪ Technometer ◄
▪ Momentum
Main Features:
▪ Multi Timeframe is available
▪ Volume based indicators
▪ Can be used on pairs that have volume data
────────────────────────────
Highlights
> Optimism Pessimism Index or OP
The value of the OP is not important.
The action of the OP is important.
The action of the index must be compared to its previous action or to the price index over the same period of time.
> Technometer or TEC
The purpose of the Technometer is to provide a mathematical indication of the degree to which the market is overbought or oversold.
The value of the Technometer could be as high as 100 or as low as 0.
The other possible values would represent degrees of overbought or oversold.
How to read the Technometer:
| Overbought means vulnerable to a reaction |
100 - completely overbought market.
── 60 - actual overbought extreme.
──── 50 or higher is considered to be clearly over bought.
────── lower than 50 - relatively overbought.
──────── Everything in between clearly overbought and clearly oversold is neutral.
────────── A reading of 44.4 is absolute neutrality.
──────── Everything in between clearly overbought and clearly oversold is neutral.
────── higher than 38 - relatively oversold.
──── 38 or lower is considered to be clearly over sold.
── 28 - actual oversold extreme.
0 - completely oversold market.
| Oversold means vulnerable to a rally |
> Force
The purpose of the Force Index is to provide an indication of the pressure being applied to push the market lower or the pull being applied to the market to pull it higher.
> Momentum
The purpose of the Momentum is to provide a measure of the speculative interest in the market.

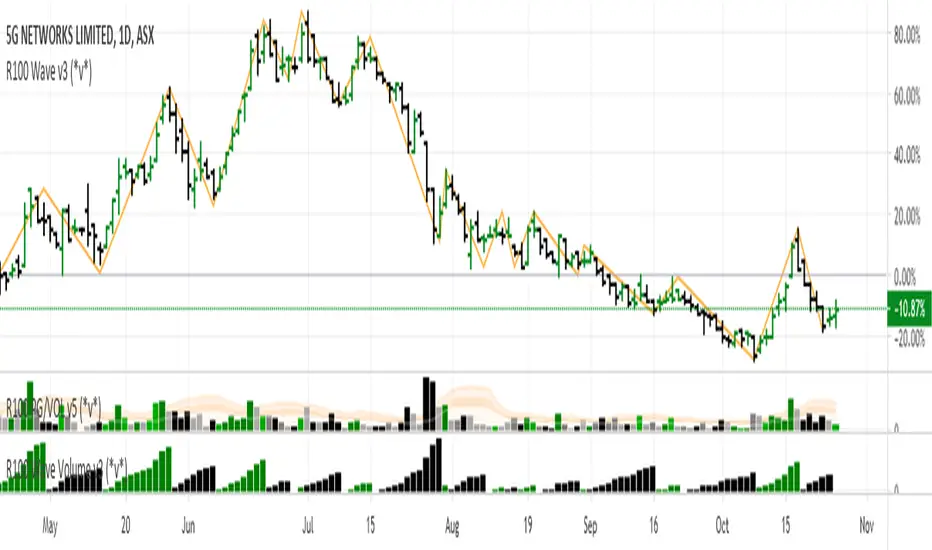
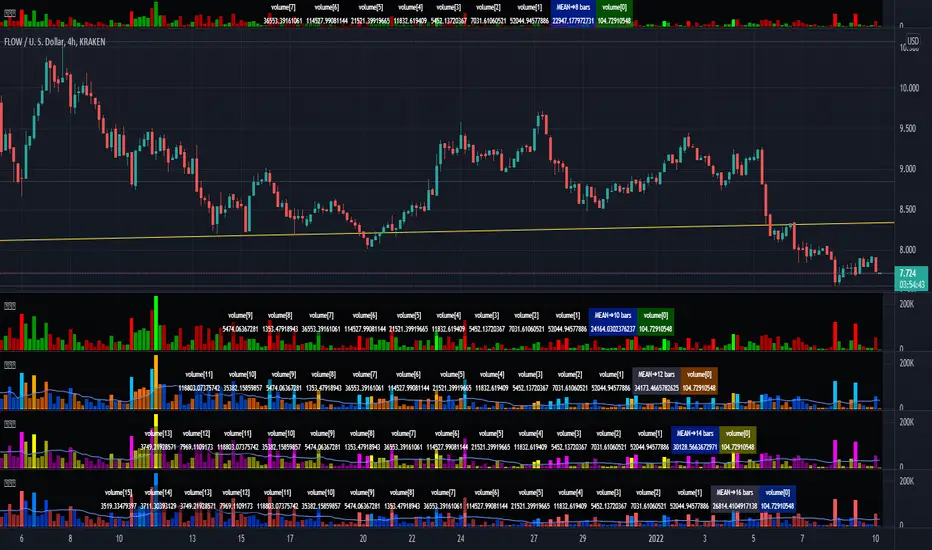
R100 Wave Volume v2 (*v*)This indicator is similar to the Weis Wave Volume indicator in that it shows cumulative volume for each up and down price wave. However it is calculated differently, using the Jurik moving average to determine turning points. Use this in conjunction with the R100 Wave indicator to determine the best fit Jurik length and power settings.
A great indicator to help analyse the strength of pullbacks, continuation moves and changes in behaviour.
I hope you get some value out of it. Only conditions of use are that if you improve it, let me know and if you publish something that uses it, don't hide the code! Enjoy!
Code pinched and modified from Zero Lag ZigZag by Duyck - thankyou
Jurik Moving Average (for turning points) by Everget - thankyou
and Weis Wave by Modhelius - thankyou
Force Index - Multi Timeframe [WYCKOFF ARSENAL]WYCKOFF ARSENAL is now available on TradingView!
Based on <> (Richard D. Wyckoff)
Noted Indicators:
▪ Optimism Pessimism Index
▪ Force Index ◄
▪ Technometer
▪ Momentum
Main Features:
▪ Multi Timeframe is available
▪ Volume based indicators
▪ Can be used on pairs that have volume data
────────────────────────────
Highlights
> Optimism Pessimism Index or OP
The value of the OP is not important.
The action of the OP is important.
The action of the index must be compared to its previous action or to the price index over the same period of time.
> Technometer or TEC
The purpose of the Technometer is to provide a mathematical indication of the degree to which the market is overbought or oversold.
The value of the Technometer could be as high as 100 or as low as 0.
The other possible values would represent degrees of overbought or oversold.
How to read the Technometer:
| Overbought means vulnerable to a reaction |
100 - completely overbought market.
── 60 - actual overbought extreme.
──── 50 or higher is considered to be clearly over bought.
────── lower than 50 - relatively overbought.
──────── Everything in between clearly overbought and clearly oversold is neutral.
────────── A reading of 44.4 is absolute neutrality.
──────── Everything in between clearly overbought and clearly oversold is neutral.
────── higher than 38 - relatively oversold.
──── 38 or lower is considered to be clearly over sold.
── 28 - actual oversold extreme.
0 - completely oversold market.
| Oversold means vulnerable to a rally |
> Force
The purpose of the Force Index is to provide an indication of the pressure being applied to push the market lower or the pull being applied to the market to pull it higher.
> Momentum
The purpose of the Momentum is to provide a measure of the speculative interest in the market.
Optimism Pessimism Index - Multi Timeframe [WYCKOFF ARSENAL]WYCKOFF ARSENAL is now available on TradingView!
Based on <> (Richard D. Wyckoff)
Noted Indicators:
▪ Optimism Pessimism Index ◄
▪ Force Index
▪ Technometer
▪ Momentum
Main Features:
▪ Multi Timeframe is available
▪ Volume based indicators
▪ Can be used on pairs that have volume data
────────────────────────────
Highlights
> Optimism Pessimism Index or OP
The value of the OP is not important.
The action of the OP is important.
The action of the index must be compared to its previous action or to the price index over the same period of time.
> Technometer or TEC
The purpose of the Technometer is to provide a mathematical indication of the degree to which the market is overbought or oversold.
The value of the Technometer could be as high as 100 or as low as 0.
The other possible values would represent degrees of overbought or oversold.
How to read the Technometer:
| Overbought means vulnerable to a reaction |
100 - completely overbought market.
── 60 - actual overbought extreme.
──── 50 or higher is considered to be clearly over bought.
────── lower than 50 - relatively overbought.
──────── Everything in between clearly overbought and clearly oversold is neutral.
────────── A reading of 44.4 is absolute neutrality.
──────── Everything in between clearly overbought and clearly oversold is neutral.
────── higher than 38 - relatively oversold.
──── 38 or lower is considered to be clearly over sold.
── 28 - actual oversold extreme.
0 - completely oversold market.
| Oversold means vulnerable to a rally |
> Force
The purpose of the Force Index is to provide an indication of the pressure being applied to push the market lower or the pull being applied to the market to pull it higher.
> Momentum
The purpose of the Momentum is to provide a measure of the speculative interest in the market.

Enhanced Volume MonitorThis is my enhanced volume monitor using Pine Script version 4.0 freely available to ALL! It's very much like the built-in TV volume monitor displayed in the overlay chart, but it isn't dockable like TV's, sorry. Maybe one day they will find it in thier hearts to adopt this script for thier built-in replacement. I would gladly do so and already offered it previously. I preferably put it over top of the overlay chart by itself, just like you see above, and then I can expand it down easily for a substantially better quick inspection. I provided a wide assortment of vibrant color schemes to choose from for anyone who may have vision impairments. This also displays that color scheming is VERY possible in Pine.
I would personally like to thank the talented individuals at TV for providing a platform that embraces an initial free membership, which I first obtained myself, for individuals like me to freely code in Pine with mathemagical ideas and mental wizardry, creating ultimately, inventions like this eye candy display above.
Features List Includes:
I.P.O.C.S.(Initial Public Offering Clean Start) Technology - plotting from day one, minute one of IPO with all 4 moving averages
Enable/disable dark background for enhanced visibility
Color schemes (all displayed above)
Enable/disable tricolor scheme
Enable/disable volume moving average
Moving average "type" option with multiple selections
Adjustable moving average period
If you do have any questions or comments regarding this indicator, I will consider your inquiries, thoughts, and ideas presented below in the comments section, when time provides it. As always, "Like" it if you simply just like it, and also return to my scripts list occasionally for additional postings. Have a profitable future everyone!
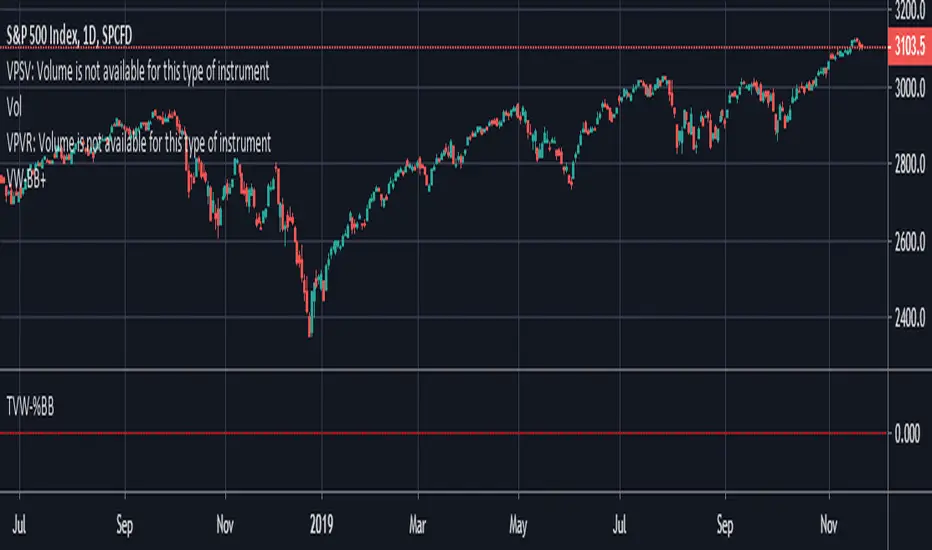
Volume Weighted Bollinger (Final, cleaned up visuals)Volume-weighted bollinger (normal stats application of weighting mean) with cleaned up visualization. Shaded area represents1sd-2sd move size for trailing 20 period average on timeframe for individual candles.
Volume Weighted Ichimoku (Cleaned Up Visuals)Ichimoku with cleaned up appearance on chart and volume-weighted highs / lows. Publishing this final version with open script.

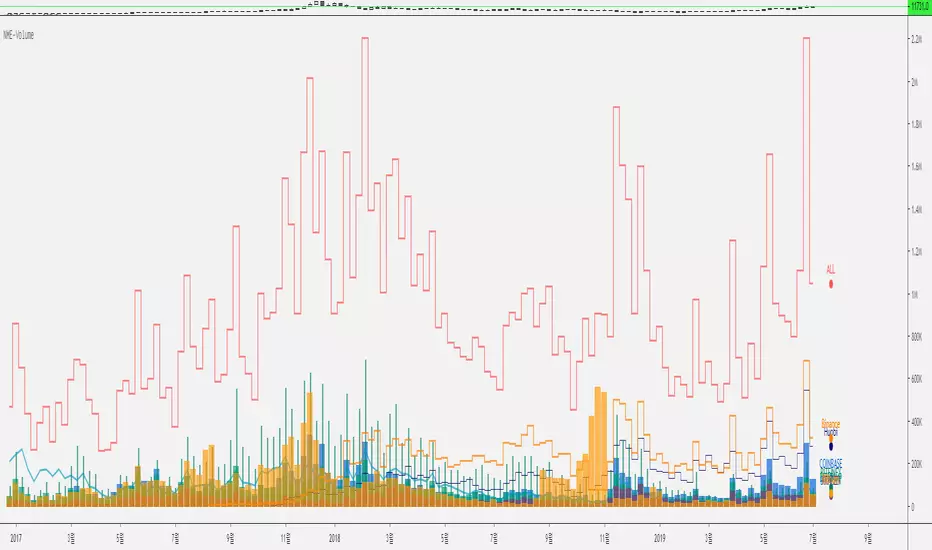
Nexgen Multi-Exchange-Volume V 1.0 by rEPLAYEr1. Hello, Everyone.
2. This is a very simple indicator that sums up the Bitcoin's total trading volume of the major exchanges such as Bitfinex, Binance, Huobi Global, Bitstamp, Kraken, Coinbase, and Bitflyer.
3. This indicator was created to comprehend the fluctuation of the overall market volume.
4. We did not add the BITMEX because it uses leverage-weighted volume and thus is quite different from the actual volume indicator used by other exchanges.
5. It automatically sums up the volumes according to the various time frame.
6. It may be difficult to see the indicator by default setup, so you can customize the display to your aesthetic point of view.
7. We will continue to update to help you find the overall volume flow.
8. Thank you and we wish your succesful investment.
===============================================================
皆さん、こんにちは。
これは非常に単純な指標であり、主要取引所のビットコインの量を合計したものです。
この指標は、Bitfinex、Binance、Huobi Global、Bitstamp、Kraken、Coinbase、Bitflyerなどのいくつかの有名な取引所の取引量の合計であり、市場全体の取引量の変動を調べるために作成されました。
BITMAXを追加しませんでした。 BITMEXの量はレバレッジ加重量であるため、実際の量とは異なります。
タイムゾーンと連動して自動的に変更することができます。
デフォルト設定ではインジケータを見るのが難しい場合があるので、美的観点に合わせて表示をカスタマイズできます。
私達はあなたが全体のボリュームフローを見つけるのを助けるために更新し続けるでしょう。
ありがとうございます。私たちはあなたの成功した投資を願っています。
================================================================
안녕하세요.
넥스젠의 투더문입니다. 저희 훌륭한 개발자인 RE님을 갈아서 또 매우 심플하고 간단하지만 비트코인 거래에 도움이 되는 지표를 만들었습니다.
이 지표는 매우 간단한 볼륨지표로서 주요 거래소의 볼륨을 합산한 것입니다.
비트파이넥스, 바이낸스, 후오비 글로벌(후오비코리아 아님), 크라켄, 코인베이스, 비트플라이어 그리고 빗썸에서 거래되는 BTC의 거래량을 합산한 것입니다.
비트맥스의 경우에는 레버리지가 가중되기 때문에 정확한 거래량으로 보기 어려워 비트맥스는 제외했습니다.
타임프레임을 옮겨가면 해당 타임프레임에 맞게 자동으로 조절되게 해뒀습니다.
디폴트 설정은 그 나름 최대한 보기 좋게 꾸며뒀지만, 불필요한 거래소도 있을 것이고, 본인의 심미적 관점에 따라 보게 꾸밀 수 있게 옵션이 제공됩니다.
감사합니다. 여러분의 성투를 기원합니다.
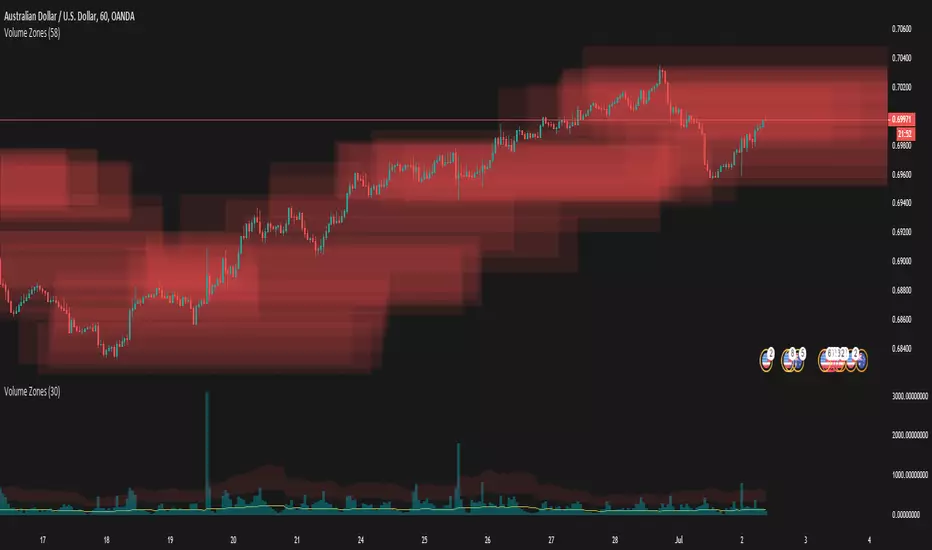
Volume ZonesThis a script that shows where price is trapped in the market based on the volume traded
The plots uses pixels. To correctly see the zones, adjust your zoom and set your level density appropriately

Trend Scores + Volume-Weighted Trend ScoresHere is a simple indicator based on Tushar Chande's TrendScore .
The main purpose of the TrendScore is to determine the strength and direction of a trend, which it does by comparing the current price to the prices within a user-defined window of historical prices.
In the input menu, the user defines the starting and ending period. The current price is then compared to each historical price. If the current price is greater than the given historical price, then the TrendScore is incremented, while it is decremented if it is below the given historical price. TrendScore values fluctuate between a maximum of 100 and a minimum of -100, with 100 meaning that the current price is greater than each historical price in the window and a value of -100 meaning the inverse is true.
We then use the same process to calculate the volume trend score by passing in volume to the 'getTrendScore' function. Lastly, the indicator also also calculates a 'volume-weighted trend score'. This is simply the average of the price trend score and the volume trend score. It is not plotted by default, but users can set the input option to true in the input menu and it will be plotted as a yellow line (as seen in the bottom chart).
The Chart:
The trend scores for price are plotted as a histogram. We've summarized the meaning behind its color changes below:
-If ( trendScore == 100)
then color = dark green
-if ( trendScore < 100 and trendScore is increasing)
then color = light green
-if ( trendScore > 0 and trendScore is DECREASING)
then color = pink
-if ( trendScore < 0)
then color = red
The volume trend score is plotted as a blue line. We felt that using a similar coloring system for the volume trend scores would over-crowd the chart and take away from the simplicity that makes this indicator useful. The volume-weighted trend score is plotted as a yellow line.
The main price bars change color based on the price trend score to make the values easier to visualize as well.
Interpretation:
This is a pretty versatile indicator. We summarized the ways in which traders can use it:
-Enter Long Positions when the trend score crosses zero from negative to positive territory.
-Exit Long Positions when the trend score was previously 100 and begins decreasing (ie bar color changes from dark green to pink).
-Spot bearish divergences when price trend score is 100 or relatively high and the volume trend score decreases significantly.
-Identify bullish divergences when price trend score is relatively low and volume trend score is increasing.
~Happy Trading~

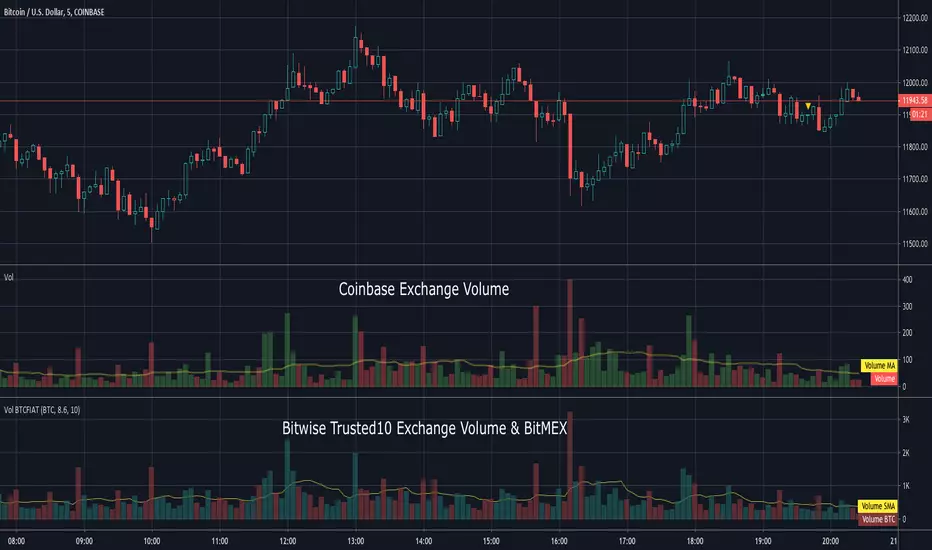
Volume BTCFIATThis indicator shows the aggregated volume of BTCFIAT of the Bitwise "Trusted 10" Exchanges that are available on TradingView.
I did not include every currency or stable coin available on these exchanges due to some being inconsequential in volume .
I also included option to show BitMEX deleveraged amount. Recent report suggests average leverage used there is 8.6X.
Volume can be shown in BTC or USD amounts. The moving average can be adjusted and if set to 0 will hide it.
Due to the number of lookups please be patient while loading. It will take a moment to display.
To load search Indicators for "Volume BTCFIAT" and click to load.
This indicator does not require access from me.