Key LevelsKey Levels Indicator
Description
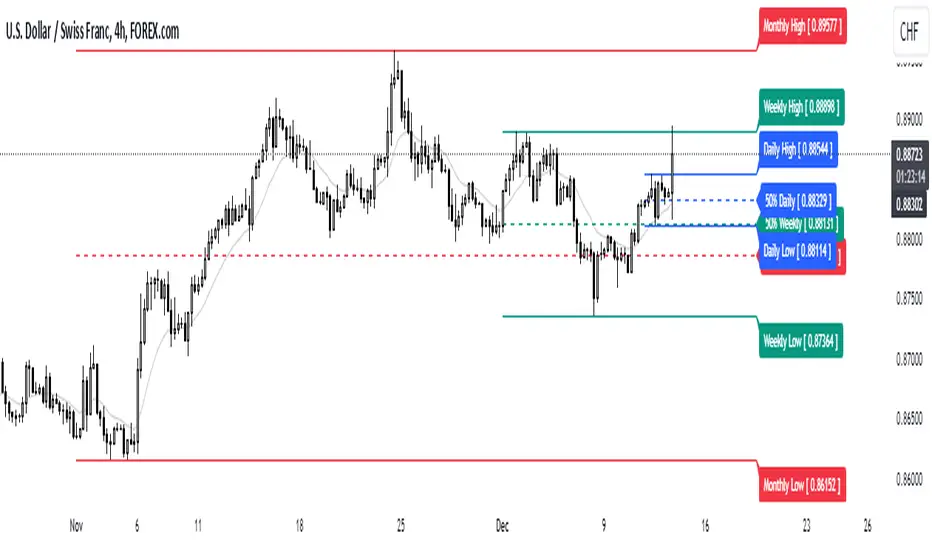
The Key Levels indicator is a powerful tool for traders, displaying major institutional price levels from daily, weekly, and monthly timeframes on your chart. It plots horizontal lines for previous period highs, lows, and midpoints (50% levels), as well as current period opens, helping you identify critical support and resistance zones used by institutional traders. Labels are provided for the most recent levels, positioned at the rightmost bar for easy reference.
Features
Daily Levels: Plots Previous Day High, Previous Day Low, Day Open, and Previous Day 50% Level.
Weekly Levels: Plots Previous Week High, Previous Week Low, Week Open, and Previous Week 50% Level.
Monthly Levels: Plots Previous Month High, Previous Month Low, Month Open, and Previous Month 50% Level.
Customizable Colors: Adjust the color of each line via the settings panel to suit your chart preferences.
Customizable Labels: Enable/disable labels, adjust label size, and change the label background color for optimal visibility.
Clean Visualization: Lines are plotted with breaks at the start of each period, ensuring a clear and uncluttered display.
Settings
Show Labels: Toggle to show or hide all labels (default: enabled).
Label Size: Choose from "tiny," "small," "normal," "large," or "huge" to adjust label text size (default: normal).
Label Background Color: Customize the background color of labels to ensure text visibility (default: black).
Line Colors: Individual color pickers for each level (e.g., Previous Day High, Day Open), allowing full customization of line colors.
Usage
The Key Levels indicator is designed for futures markets, such as S&P 500 futures (ES), Nasdaq futures (NQ), or crude oil futures (CL), where institutional price levels like daily, weekly, and monthly highs, lows, and opens are key for getting into positions. For day trading, use these levels to identify short-term support and resistance for intraday entries and exits. For long-term trading, they provide context for swing positions or trend continuation, helping you align with institutional flow. Apply the indicator to a 1-hour or 15-minute timeframe to capture precise market structure. While optimized for futures, the indicator's key levels apply to every single thing that can be traded, including forex, stocks, and cryptocurrencies, making it versatile for all asset classes.
Notes
Labels are shown only for the current day, week, and month to focus on recent price action.
For best visibility, adjust the label background color if text blends into your chart background.
Ideal for traders analyzing major institutional levels for market structure and trading decisions.
Weeklylevels

Daily Weekly Monthly Highs & Lows [Dova Lazarus]Daily Weekly Monthly Highs & Lows
📊 Overview
This Pine Script indicator displays key support and resistance levels by plotting the highs and lows from Daily, Weekly, and Monthly timeframes on your current chart. It's designed as an educational tool to help traders understand multi-timeframe analysis and identify significant price levels.
🎯 Key Features
Multi-Timeframe Support & Resistance
- Daily Levels: Shows previous daily highs and lows
- Weekly Levels: Displays weekly highs and lows
- Monthly Levels: Plots monthly highs and lows
- Smart Display: Only shows relevant timeframes based on your current chart timeframe
Fully Customizable Appearance
- Individual Colors: Set unique colors for each timeframe
- Line Styles: Choose between Solid, Dashed, or Dotted lines
- Line Width: Adjust thickness from 1-4 pixels
- Lookback Periods: Control how many historical levels to display
User-Friendly Options
- Enable/Disable: Toggle any timeframe on/off
- Line Extension: Option to extend lines into the future
- Clean Interface: Organized settings groups for easy configuration
🔧 Settings
Timeframes Group
- Show Daily/Weekly/Monthly Levels: Enable or disable each timeframe
- Lookback Periods: Number of historical levels to display (1-10)
Line Settings Group
- Color: Choose custom colors for each timeframe
- Style: Select line appearance (Solid/Dashed/Dotted)
- Width: Set line thickness (1-4 pixels)
Display Options Group
- Extend Lines Forward: Project lines 20 bars into the future
📈 How to Use
1. Add to Chart: Apply the indicator to any timeframe chart
2. Configure Timeframes: Enable the timeframes you want to see
3. Customize Appearance: Set colors and line styles for easy identification
4. Identify Levels: Use the plotted levels as potential support/resistance zones
5. Plan Trades: Look for price reactions at these key levels
💡 Trading Applications
- Support & Resistance: Identify key price levels where reversals may occur
- Entry Points: Look for bounces or breaks at these levels
- Stop Loss Placement: Use levels to set logical stop losses
- Target Setting: Previous highs/lows can serve as profit targets
- Multi-Timeframe Analysis: Understand the bigger picture context
🎓 Educational Value
This indicator is perfect for:
- Learning Pine Script: Clean, well-commented code structure
- Understanding Multi-Timeframe Analysis: See how different timeframes interact
- Practicing Technical Analysis: Identify key support/resistance concepts
- Code Study: Full variable names and detailed comments for learning
⚙️ Technical Details
- Version: Pine Script v6
- Overlay: True (plots directly on price chart)
- Max Lines: 500 (handles multiple timeframes efficiently)
- Compatibility: Works on all timeframes (shows relevant levels only)
🔍 What Makes This Different
- Educational Focus: Designed for learning with clear code structure
- Simplified Interface: Easy-to-use settings without overwhelming options
- Visual Clarity: Clean line display with customizable appearance
- Practical Application: Real trading tool, not just a demonstration
📋 Requirements
- TradingView account (any plan)
- Basic understanding of support/resistance concepts
- Any chart timeframe (indicator adapts automatically)
🚀 Quick Start
1. Add indicator to your chart
2. Default settings work great out of the box
3. Customize colors if desired (Green=Daily, Orange=Weekly, Red=Monthly)
4. Watch for price reactions at the plotted levels
5. Use as part of your technical analysis toolkit
---
*This indicator is designed as an educational tool and should be used in conjunction with other forms of analysis. Past performance does not guarantee future results.*

High/Mid/Low of the Previous Month, Week and Day + MAIntroducing the Ultimate Price Action Indicator
Take your trading to the next level with this feature-packed indicators. Designed to provide key price insights, this tool offers:
- Monthly, Weekly, and Daily Levels : Displays the High, Midpoint, and Low of the previous month, week, and day.
- Logarithmic Price Lines : Option to plot price levels logarithmically for enhanced accuracy.
- Customizable Labels : Display labels on price lines for better clarity. (This feature is optional.)
- Dual Moving Averages : Add two customizable Moving Averages (Simple, Exponential, or Weighted) directly on the price chart. (This feature is optional.)
This code combines features from the Moving Average Exponential and Daily Weekly Monthly Highs & Lows (sbtnc) indicators, with custom modifications to implement unique personal ideas.
Perfect for traders who want to combine precision with simplicity. Whether you're analyzing historical levels or integrating moving averages into your strategy, this indicator provides everything you need for informed decision-making.
To prevent change chart scale, right click on Price Scale and enable "Scale price chart only"
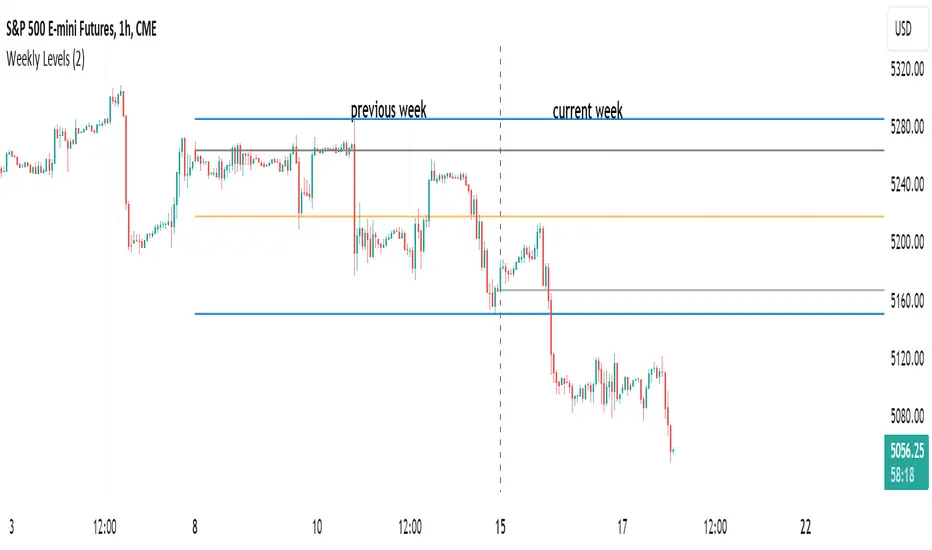
HT: Weekly LevelsIndicator draws several most important weekly levels on the lower timeframe: last week high/low, halfback, week close and current week open. These levels often act as support/resistance for price movements. Also, they can help to assess week character and control of power.
Indicator can be used on any timeframe, lower than weekly, for any type of instrument, including futures. It also provides an option to draw levels for any selected week back in time.
Important notes:
• Levels for the last week are drawn after the new week opens.
• Half-back is calculated as a middle line between week High and Low.
Parameters:
Date – user can select date, belonging to week, for which levels will be plotted. Works only if “Use” check box is on. Otherwise, levels will be plotted for the last week. (“time” value doesn’t matter; unfortunately, there is no way to hide the input box)
Time zone – your chart time zone (as UTC offset). Only needed if you use “Date” parameter.
Visuals – controls visibility and colors
Script is published as an open source. It uses two libraries: Levels Lib and Functions Lib. First one demonstrates how to work with pine-script object model and arrays. You can also reuse it in your custom scripts where there is need to construct any support/resistance levels. The second library contains some useful functions for working with time and dates.
Disclaimer
This indicator should not be used as a standalone tool to make trading decisions but only in conjunction with other technical analysis methods.
Week designationThe script is primarily used for visualizing the beginning and end of the week. It is particularly helpful when working with time intervals shorter than one day. In a very simple and clear manner, you can see when a specific week has started. This makes it easier to assess the market sentiment in a short timeframe.
Here are the operating principles of this script:
Initialization:
The script begins with initialization, where basic parameters and settings such as line colors and line style are defined.
Determining the Session Start:
The startSession(hour, minute) function is used to calculate the starting time of a session on the chart. Sessions can be divided into different time intervals, such as the daily session (D), weekly session (W), and monthly session (M).
Checking for Session Start:
The script checks if a new session is starting. If so, a vertical line is inserted on the chart to mark the beginning of that session.
isSessionStart checks for the start of the daily session.
isSessionStart_2 checks for the start of the weekly session.
isSessionStart_3 checks for the start of the monthly session.
Marking Mondays:
The script checks if the current day is Monday (the day of the week number 2 represents Monday).
If the current session is starting or it is Monday, a vertical line is inserted on the chart with the day designation (color color_day).
Marking Lines on the Chart:
The lines inserted on the chart are vertical and have a specified style and color, which can be customized in the settings.

Simple Trader - LevelsThis indicator plots the below levels in the chart.
Note: This is not a buy/sell recommendation. Reach Simple Trader to understand how to trade these levels.
Current day open,
Prev. day close,
Prev. day high,
Prev. day low.
Prev. week high,
Prev. week low,
Prev. month high,
Prev. month low.

Daily and Weekly Moving Averages on Daily ChartThis script is designed to be used on Swing and Position style approaches.
Based on moving averages that I use with the integration of a weekly moving average that is visible on the daily chart /all timeframes.
The moving averages are:
9EMA;
21EMA;
10 week SMA ;
50EMA;
150EMA;
and 200EMA.
Base script from CaptainBrett with Matt Caruso's chat with Richard Moglen showing me that this can be done on Tradingview. When searching for the script, I couldn't find it within the public library.
Please Enjoy

[astropark] price levelsDear Followers,
today another awesome Analysis Tool, that you can use in your trading journey: Price Levels !
Are you a range trading player? a scalper? or maybe a day-trader or a swing-trader? This is for you then. Indeed it's for everyone.
This indicator works on every timeframe, market and pair.
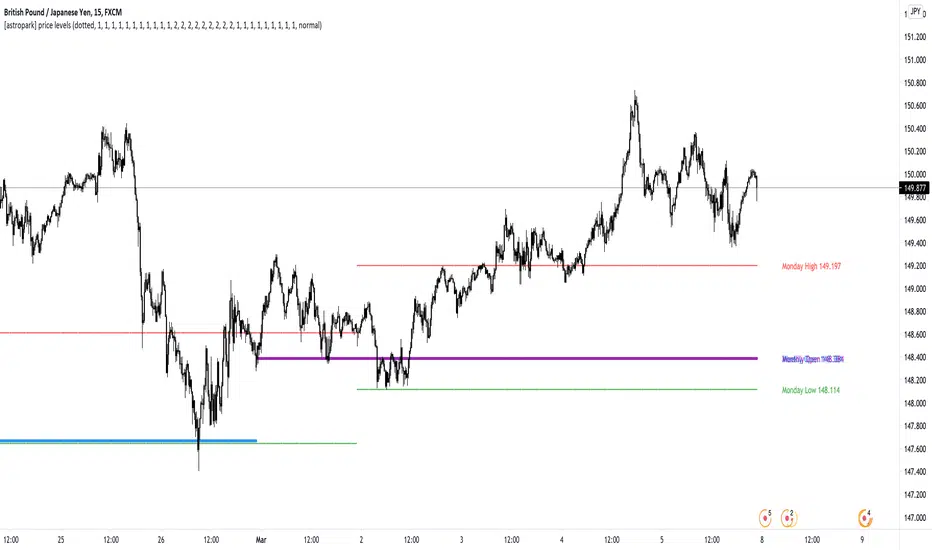
It keeps track of recent important levels generated by price action:
Monday high, low and middle range level
Tuesday high and low
Wednesday high and low
Thursday high and low
Friday high and low
Weekly open, high and low
Monthly open, high and low
Yearly open, high and low
Previous weekly open, high and low
Previous monthly open, high and low
Previous yearly open, high and low
You can:
choose price levels to hide and show
change each level color / thickness / display style (solid or dotted)
choose to show or hide price labels and change their size
Why such indicator should be helpful? How can I use it to do profit?
In multiple ways! Let's talk about Monday Range :
when Monday range is formed, price acceptance below Monday low is a bearish signal, so will more likely want to short / sell
equally price acceptance above Monday high is a bullish signal, so will more likely want to long / buy
it can happen that Monday high is simply retested, with price not being able to stay above it: this is called a retest (in case of a simple wick) or a deviation (in case of price staying above the level just for some candles) and what usually happens is price falling back to Monday middle range level and even back to Monday low.
the opposite can happen of course: you will become bullish if Monday low is tested or a deviation appears below Monday low: price tends to bounce on such occasions back to Monday middle range or even Monday high
Tuesday is usually a marker day within a trading week:
if Monday was pretty bullish, Tuesday high may mark the weekly top, following some red days
if Monday was pretty bearish, Tuesday low may mark the weekly bottom, following some green days
Thursday is the day when big players start to take profits, as the trading week is going to end the next day, so in an all-green week Thursday may be a red one, while in an all-red week it may be a bullish day
Thursday is the day when big players start to take profits, as the trading week is going to end the next day:
in an all-green week, Thursday may be a red one and it's low tends to mark the weekly low
while in an all-red week, it tends to be a bullish day, so here you will refill your shorts for the next blooding day
Let's talk now about the Weekly, Monthly and Yearly price levels : here it is the interesting part for Swing Traders
Weekly open is usually a defining level: on retest, if price keeps staying below then more downside is expected, if price keeps staying above then more upside is expected (similarly to what we said about Monday high and low)
Monthly and Yearly open price levels are usually a "no-brainer" buy level in a bullish trend or equally a sell level in a bearish trend: in this scenarios, a deviation structure is even more powerful in term of price reaction and efficiency
We trade Weekly, Monthly and Yearly high and low price levels as explained for the Monday high and low, but with a swing traders perspective (so a medium-long term trade)
Previous Weekly/Monthly/Yearly price levels are usually very useful as targets in your trades
Here below some screenshots that resumes what said above.
Weekly Open as support (bullish) and Monday High deviation (bearish)
Tuesday High, Weekly Open failing as support: bearish
Monday Low deviation (bullish)
Price Acceptance above Monday High and Weekly Open (bullish)
Yearly Open retests as buy opportunities
Deviation below Monthly Open (bullish), Price Acceptance below Monthly and Yearly Open (bearish)
This is a premium indicator , so send me a private message in order to get access to this script.
Key Levels SpacemanBTC IDWMKey levels, plotted automatically
Additional timeframes can be added on request
Useful for seeing strength of the trend in the market
