Weekly Monthly Yearly Open LevelsThis script displays the weekly, monthly, and yearly opens for the last few periods.
I added an option to extend the previous opens to the current period as well.
Haftalık Grafikler

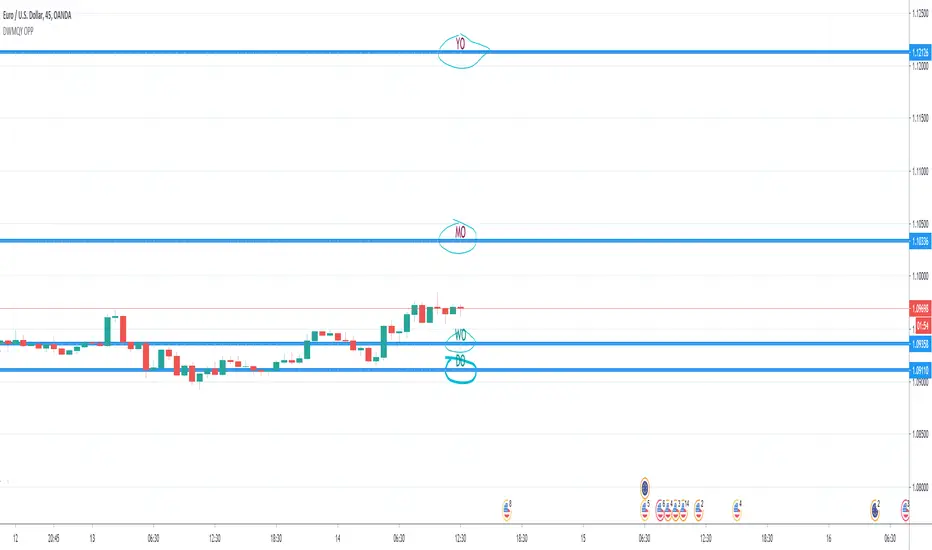
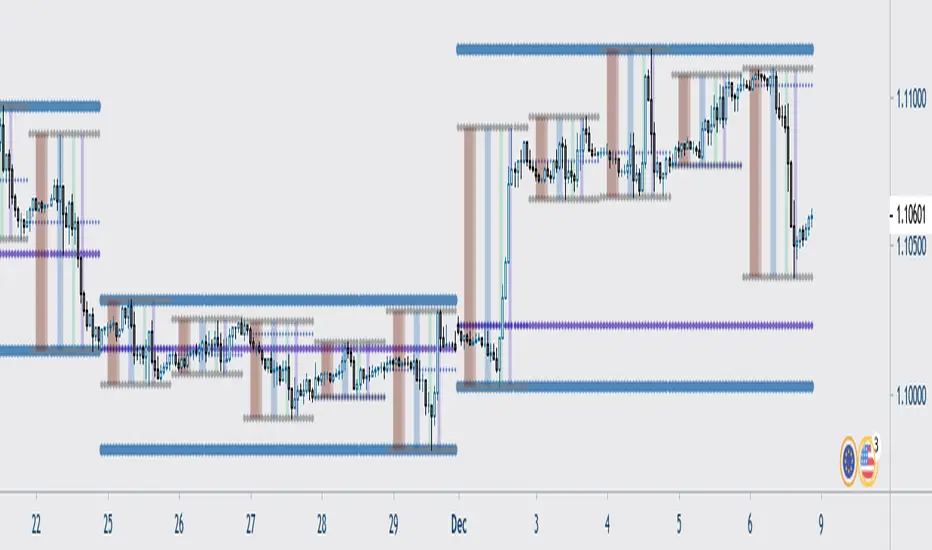
Day & Week & Month & Quarter & Year Open Price PointsPresent to your attention, basic “Day & Week & Month & Quarter & Year Open Price Points Indicator” !
You can determine support & resistance using Yearly, Quarterly, Monthly and Weekly open price points on a chart with any timeframe.
It is not a widely used technique, but according to different academic studies, levels are reliable. Google it! You can enhance your trading by adding that technique in your tool list.
At the current stage, Indicator shows Open Price Points.
Opening price points are extended into the future from the opening candle of each year, quarter, month and week and day.
By nature of that points, every level may be used as a support and as a resistance level at a similar time.
Initial setup:
1) Open the indicator Inputs settings, enable/disable additional Price Points.
2) Open the indicator Style settings, click on a style of each line and click on a “Price Line.”
How to use that?
With a lot of available strategies, there are two leading: Level convergence and Trend line convergence.
1) Level convergence involves locating two or more opening points that merge. This confluence can lead to greater accuracy and profitability.
2) Trend line convergence - The intersection of a trend line at a weekly, monthly, quarterly or even yearly opening level can produce fast and profitable reactions.
Try that!
As a stand-alone strategy, you can utilize that:
Price action under the WO (DO, MO, QO, YO) – Bearish
Price action above the WO (DO, MO, QO, YO) – Bullish
TIP: opening level not always good as a stand-alone tool!
Indicator Settings:
Show Daily Open (disabled by default)
Show Weekly Open (ON by default)
Show Monthly Open (ON by default)
Show Quarter Open (disabled by default)
Show Yearly Open (disabled by default)
Indicator Styling:
By default, each line is shown in the form of circles, line-width 1, silver colour.
Labels can be only in one of two states: Maroon (if open price less than ((open + high + low + close)/4) or Teal (if open price high than ((open + high + low + close)/4).
Alerts:
With the Indicator you can add a few different alerts:
DO Alert
WO Alert
MO Alert
QO Alert
YO Alert
Play with it:
Add a new alert with following condition: your SYMBOL crossing DWMQY OPP Weekly Open.
Options: Once per Bar.
Future of the Indicator:
The Indicator is a necessary part of more prominent Indicator which will include 8 modules in total:
2~ Arabian Wise Tunnels Module
3~ RH Waves Module (something like Vegas Waves)
4~ Trend Channels Module
5~ Opening Range Zoning Module
6~ Breakout Module
7~ BS Hemisphere Module
8~ Price Action Module
DISCLAIMER! RISK WARNING!
PAST PERFORMANCE IS NOT NECESSARILY INDICATIVE OF FUTURE RESULTS. TRADERS SHOULD NOT BASE THEIR DECISION ON INVESTING IN ANY TRADING PROGRAM SOLELY ON THE PAST PERFORMANCE PRESENTED, ADDITIONALLY, IN MAKING AN INVESTMENT DECISION, TRADERS MUST ALSO RELY ON THEIR OWN EXAMINATION OF THE PERSON OR ENTITY MAKING THE TRADING DECISIONS.
//Written by iambitboy request.
D/W/M/Y OpenThis is just a small Script
It show you:
Low and high of
Yesterday, last week, last month and last year
+
Open today

MTF Ichimoku CloudIchimoku Cloud , Multiple Time Frames, based on the script : MTF Selection Framework functions (PineCoders)
Possible display:
- four differents Ichimoku
- Tenkan, Kijun, Chikou and Kumo (monochrome or not)
- labels : offset from line, color if you change style and with/without abbreviation
Time Frames :
- 1m
- 3m
- 5m
- 15m
- 30m
- 45m
- 1h
- 2h
- 3h
- 4h
- Daily
- Weekly
- Monthly

Ichimoku Timeframe - [Silver-Wong]"Ichi Time" displays an Ichimoku indicator from another timeframe.
IE: Displays Ichimoku Daily while you are on the 4H chart.
Available timeframes:
- 1H
- 4H
- 12H
- Daily
- Weekly

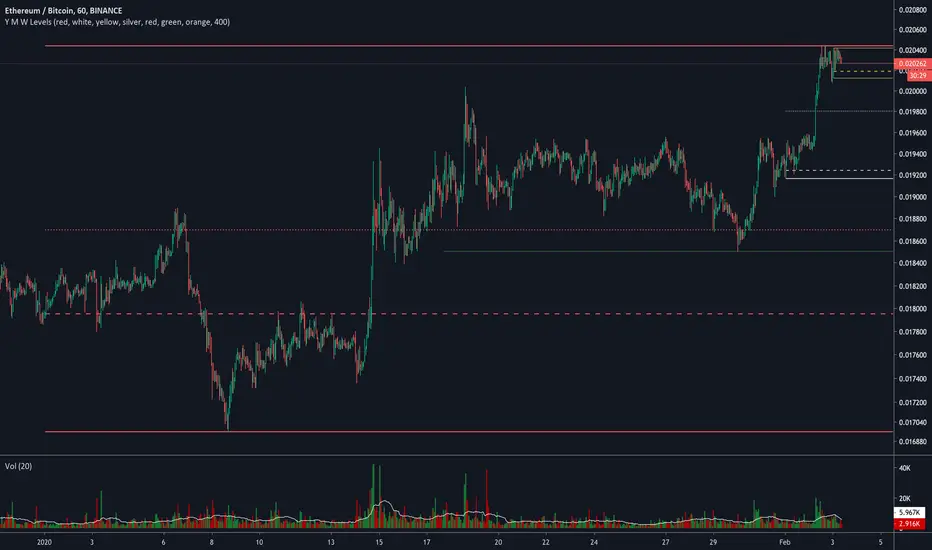
Yearly Weekly Monthly Monday Levels This script displays the Open, High, Low and Mid ranges for Yearly levels, Monthly levels, Weekly levels, and Monday range levels (useful support and resistance levels)
Opens are displayed in dashed lines, and mid-levels in dotted lines. Other lines (highs and lows) are in plain lines.
Each color represent a time horizon:
- Red: Yearly levels
- White: Monthly levels
- Yellow: Weekly levels
Colors are changeable (even though color inputs are not still available in Version 4 of TradingView PineScript).

Levels Compound v.2Daily, weekly, monthly support and resistance levels. Also paints 2 different daily WMAs and the daily weekly monthly avg.

Oasis Group - VWAP / OHLC (Daily / Weekly / Monthly)
5min with the Daily overlay
4hour with the Weekly overly
This Script was influenced be Chris Moody's OHLC Script.
I have created my version of the script and used it to Overlay Daily/Weekly/Monthly Candles over any chosen Intraday Time Frame.
**Important**
The "Stepline" Line style function in pine script is defective so anyone who wants to use this must change all line
styles to "Stepline" manually except for the VWAP Line.
This gives traders a great overall candle experience and also insight into the noise of the intraday.
Intraday traders can keep watch of the highs and Lows along with open and close levels for the larger time frames chosen.
Give us a Follow and Like. This can be used on any Asset class.
I personally use this on Intraday Trading.
Helps me Identify the Prior day Highs and Lows, Closing price compared to the next mornings Opening Price, and daily, weekly, or monthly ranges.
Also included is the powerful VWAP indicator for identifying bullish or bearish pysche.

Superstock 10-30 WMA Band script I was reading Jesse Stine's Insider Buy Superstocks book, and one of the technical traits he mentioned of a superstock (read the book, seriously, very strongly recommended) was a breakout above the 30 weekly moving average. He goes on to mention that after breakout, the 10 WMA often acts as a support line where you can add to your position. This script is inspired by the visual direction of Chris Moody's slingshot system, and how it displays MA's. The skinny line is the 10 WMA and the bigger line is the 30.


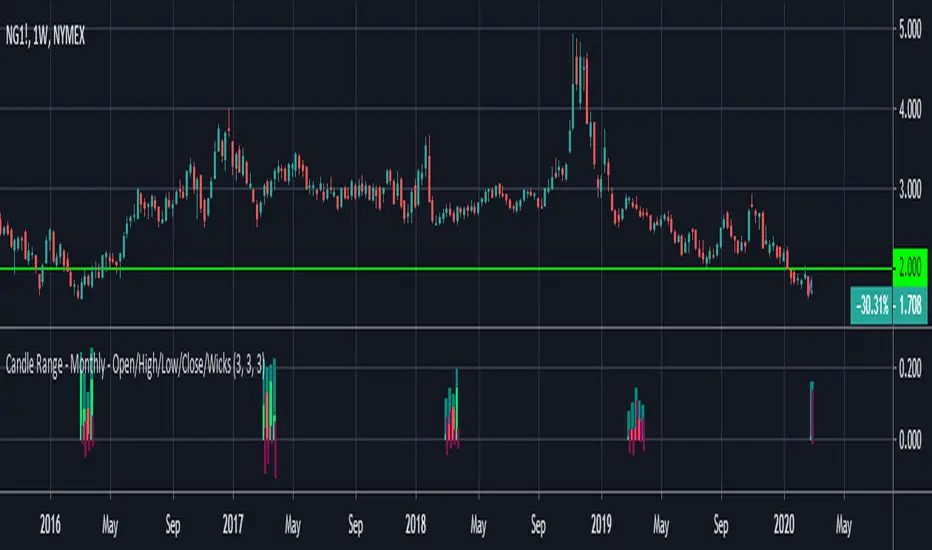
Candle Range - Monthly - Open/High/Low/Close/Wicks (Oldinvestor)This candle range comparison is similar to my original script Candle Range Compare .
This script is to compares the size of open/close high/low and wick size side by side. This version of the script allows you to only show a chosen month of each year to compare. I hadn't even thought to try and vanish the part of the chart I'm not looking at. I'll consider that later (may never happen, I am limited on time).
I have also included check boxes to turn on/off certain candles. This part is pretty self explanatory. For example: if you wish to not see wicks in front of the open/close, go to the settings for the study and uncheck the box for "Show Wicks".
Warning: The script does not work so well on monthly candles? Some of the candles are missing...
Good luck
Oldinvestor
Custom Time ranges. Daily price ranges.Addition to previous time range script, now containing daily ranges. You can select a day of the week, and have it show the high, low, mid, and open of that day.
For the time bands:
Monday = 2
Tuesday = 3
Wednesday = 4
Thursday = 5
Friday = 6
Saturday = 7
Sunday = 1
Example 1:
1500-1800:2
This will colour the background between 3pm and 6pm on Mondays.
Example 2:
0000-0600:247
This will colour the background between midnight and 6am on Mondays, Wednesdays, and Saturdays.
For the Daily price ranges:
Just select the tick-box forthe day, and then the price levels you'd like to see.
I want to add specific weekly levels to this, for example: week 06 of year 2020, but I've not figured out how to do it yet. If anyone knows, I'd appreciate it if you let me know. I'll then update this script.
As always, any questions you may have, please leave in comments below and I'll respond when I have time.
If you notice anything good with this indicator, let me know. We are all in this to make money after all! ;)

RVC-Weekly-Pivots-GANN-LevelsPurpose:
Weekly - Fibonacci pivot levels and Gann levels calculation and marking on Chart automatically.
Mainly expected to use for trading on NIFTY and BankNifty
Kindly share your comments and suggestions to improve

MultiTimeFrame Fractals D W M [xdecow]This indicator shows fractals in different timeframes. With the possibility of coloring the bars with any combination of current, daily, weekly and monthly timeframes.
The return points are calculated as follows:
high > last 3 highs and close above highest low
low < last 3 lows and closes below lowest high
The direction of higher timeframes fractals tend to be more durable and reliable. This indicator helps to find the fractal alignment of different timeframes, so that you can look for trade opportunities in the same direction as the higher timeframes and improve your chances.

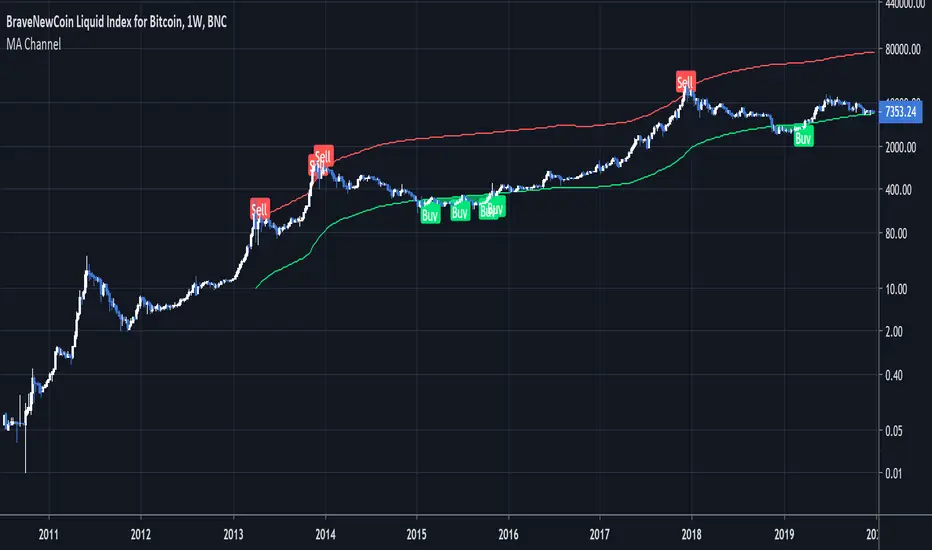
Moving Average ChannelIntended for use on BTC long term (BNC:BLX Weekly) with Logarithmic charts only
As Bitcoin is adopted, it moves through market cycles. These are created by periods where market participants are over-excited causing the price to over-extend, and periods where they are overly pessimistic where the price over-contracts. Identifying and understanding these periods can be beneficial to the long term investor. This long term investment tool is a simple and effective way to highlight those periods.
Buying Bitcoin when the price drops below the green line has historically generated outsized returns. Selling Bitcoin when price goes above the red line has been historically effective for taking profits.
NOTE: 144 Week = 2¾ Years. 104 Weeks = 2 Years. Originally created by Philip Swift

Yearly Weekly Monthly Monday LevelsThis script displays the Open, High, Low and Mid ranges for Yearly levels, Monthly levels, Weekly levels, and Monday range levels (useful support and resistance levels)
Opens are displayed in dashed lines, and mid-levels in dotted lines. Other lines (highs and lows) are in plain lines.
Colors are selectable (even though color inputs are not still available in Version 4 of TradingView PineScript).
Let me know your username in the comment below if you want to have access.
Crypto Daily-Weekly Range + KZsWeekly OHL + Daily OHL + Intraday Killzones
For markets that open the daily candle at 12AM UTC

Daily-Weekly Range + KZsWeekly OHL + Daily OHL + Intraday Kill zones
For markets that open daily candle at 10pm UTC
SPY Weekly Trading Strategy - ARK IndicatorDisclaimer: This is not financial advise, please consult with your licensed Financial Advisor for investment advise
Hello everyone,
This Script is designed to spot trends and provide you with an entry and exit points.
Rules of Trading with this Indicator:
1- The best risk/reward ratio of this indicator is that you buy at the very first buy Signal "B" and Sell at the very first Sell Signal "S"
2- and Repeat ....as simple as that
Few notes:
1- The repeats of the buy/sell signal are just confirmation of the the trend so to maximize the chances of being profitable, always start when the trend flips (From Sell to buy and vice versa).
2- No signal indicates that you maybe on an up/down trend depending on what the last signal was but the trend is starting to get weak
3- Once a trend is spotted by the algorithm, it will plot a line to establish, entry and exit depending on the direction of the trend (green for buying and red for selling)
4- you will notice that during up trend since the indicator recommends buying only entry points will be suggested with the help of a green line to give you an exact entry point, it is important that the price reaches that entry point for you to pull the trigger, however once the trend gets exhausted it will start to plot a red line so you are mentally prepared that a counter trend might be just around the corner (this is a pretty useful feature)
5- Recommended Settings: The most important setting that you need to be mindful of is "Signal Frequency", based on my observation so far, 2 works best with Weekly & monthly Charts, 8 with Daily Charts , and 10 with hourly charts or lower. As you know the price of a security depends on countless variables, including but not limited to general market condition, success/failure of the underlying security, and the psychology of the market participants of the security, so you can play around with the signal frequency to see what gives you the optimal/profitable signal in the historical candles.
6- the indicator comes with 3 moving averages since some traders/investors like to use moving averages, if you don't need them feel free to turn them off in the settings. they aren't part of any thing used behind the scene.
any questions feel free to contact me by commenting below.
Note: if you have any useful ideas on how to enhance the indicator, please don't be shy!
Warm regards & best of luck!
Ahmad

X0_Trading_levelsScript which marks out the trading ranges I often like to have mapped out on the charts:
Mondays Trading range - open, high, low
Daily open, high, low
Weekly open
Monthly open.
Can change all colours

Weekly VWAP - Starts Monday 12AMThere are a number of VWAP indicators out there, but it's difficult to find VWAP calculations that take the entire week into account. This helps with analyzing longer-term trends on daily and intraday charts. As with all VWAP indicators, this one is also more sensitive to price starting at the open of trading at the beginning of the week.

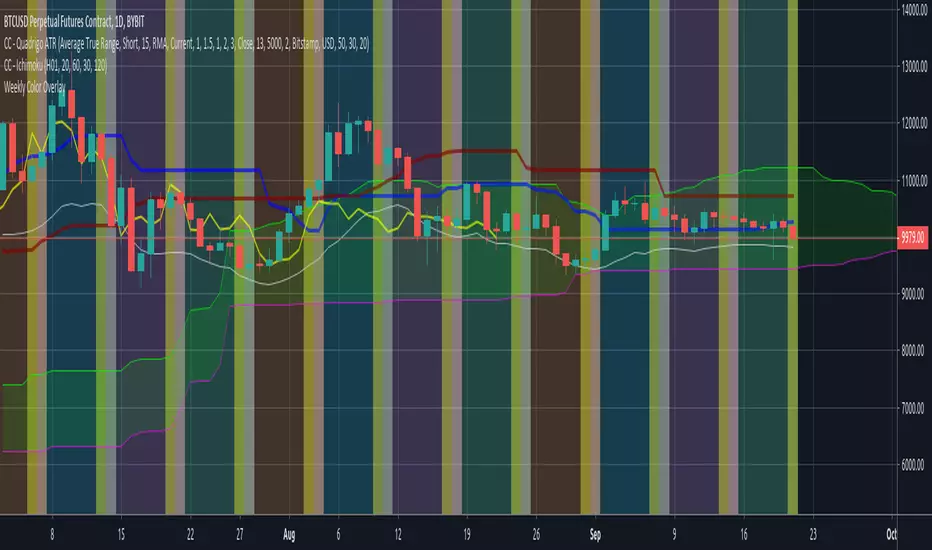
Weekly Color OverlayThis script facilitates visualization of week-of-the-month breaks with Sunday highlighting the beginning of a new week. Code breaks at the monthly time-period and since I don't ever look at that time period i'm not inclined to fix it unless someone sends me a 'push' via message.