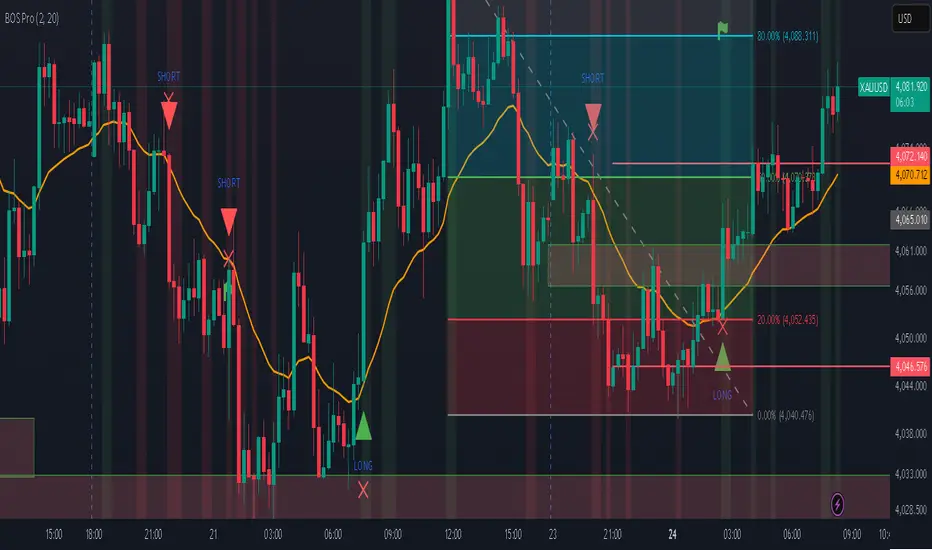
Professional BOS IndicatorThis is a trend following indicator that focuses on BOS, pullback and entry
Dalga Analizi
Price Action - LegsRooted in Al Brooks' leg counting philosophy from "Trading Price Action Trends," this draws zigzag lines connecting swing points: green for up legs (until low < previous low), red for down legs (until high > previous high). Updates dynamically to new extremes, with optional count labels (0 resets on stronger pivots). Visualizes twists in channels or ranges—markets always test with two legs; use for pullback entries or reversals.

趋势波段型警报When to enter the market is important.
When to exit the market is even more important.
When to take profit is important.
When to stop loss is even more important.
This indicator has undergone 400 backtests with a basic win rate of approximately 65%, which can help people significantly improve their win rate in manual trading.
什么时候进场很重要
什么时候离场更重要
什么时候止盈很重要
什么时候止损更重要

Price Action - H/L BarBased on Al Brooks' "Bar by Bar" (Chapter 09A, p.45-50) and "Trends" (p.98-105), this marks H (higher high with close above mid) and L (lower low with close below mid) swings. Marking pauses after each, resuming on pullback. Labels "H" above and "L" below bars for swing counting in trends or ranges. Key: Markets form two legs—use for measured moves or failed breakouts, always in context of prior extremes.

S1XP4C Bear Klr 2.1.1BTC|USD 8d
Double EMA and SMA lines with a subtle offset to show bearish and bullish changes on an 8 day chart and a WMA to show extreme lows.

Supertrend Filtered SniperSupertrend + QQE MOD + DEMA + VWAP Multi-Confluence Strategy
A professional-grade indicator combining multiple technical confluences for high-probability trade signals
━━━━━━━━━━━━━━━━━━━━━━━━━━━━━━━━━━━━━━━━━━━
📊 OVERVIEW
This indicator combines 4 powerful technical systems into one comprehensive trading tool. It only generates signals when ALL confluences agree, resulting in fewer but higher-quality trade opportunities. Perfect for day traders, scalpers, and prop firm challenges.
✅ Signals only fire when ALL conditions align:
- Both Supertrends bullish/bearish
- Price on correct side of DEMA 200
- QQE MOD confirmation
- Optional: VWAP filter, ADX filter, RSI filter, Session filter
━━━━━━━━━━━━━━━━━━━━━━━━━━━━━━━━━━━━━━━━━━━
🔧 CORE COMPONENTS
1. Dual Supertrend System
- Supertrend #1: Primary trend identification (default: 10 period, 2.0 multiplier)
- Supertrend #2: Fast trend + exit signal (default: 1 period, 2.0 multiplier)
- Both must agree for entry signals
- ST2 flip triggers automatic exit signals
2. DEMA 200 Filter
- Double Exponential Moving Average for major trend direction
- Longs only: Price above DEMA
- Shorts only: Price below DEMA
- Gradient visualization shows trend strength
3. QQE MOD (Quantitative Qualitative Estimation)
- Advanced momentum oscillator with Bollinger Bands
- Identifies strong directional moves
- Filters out weak/choppy conditions
- Based on dual RSI calculations with dynamic thresholds
4. VWAP Filter (Optional)
- Volume Weighted Average Price for institutional flow
- Longs only: Above VWAP
- Shorts only: Below VWAP
- Ensures you trade with institutional momentum
━━━━━━━━━━━━━━━━━━━━━━━━━━━━━━━━━━━━━━━━━━━
⚙️ ADDITIONAL FILTERS
Session Filter
Choose which trading sessions to allow signals:
- Asian: 6PM - 3AM EST (Tokyo hours)
- London: 3AM - 8AM EST (London open)
- New York: 8AM - 4PM EST (US market hours)
- After Hours: 4PM - 6PM EST
- Enable multiple sessions or just one - your choice!
ADX Filter (Optional)
- Only take signals when ADX > threshold (default 18)
- Ensures strong trending conditions
- Filters out ranging/choppy markets
RSI Filter (Optional)
- Avoid overbought longs (>80 RSI)
- Avoid oversold shorts (<20 RSI)
- Prevents counter-trend entries at extremes
━━━━━━━━━━━━━━━━━━━━━━━━━━━━━━━━━━━━━━━━━━━
📈 HOW TO USE
Entry Signals:
- BUY: Green "BUY" label appears when all bullish confluences align
- SELL: Red "SELL" label appears when all bearish confluences align
- Signals only fire once per setup (no repetitive alerts)
Exit Signals:
- EXIT: Orange "X" appears when Supertrend #2 flips direction
- Automatic exit logic built-in
- Can also exit at predetermined R:R targets
Status Table:
- Real-time confluence dashboard
- Shows each indicator's current state
- Green checkmarks = conditions met
- Easy visual confirmation before entering
━━━━━━━━━━━━━━━━━━━━━━━━━━━━━━━━━━━━━━━━━━━
🎨 VISUAL FEATURES
- Gradient Supertrend lines with transparency
- Color-coded candles based on DEMA position
- Automatic highlighting of trend zones
- Clear BUY/SELL/EXIT labels
- Yellow VWAP line (toggleable)
- Professional status table with checkmarks
- Small circles mark Supertrend direction changes
━━━━━━━━━━━━━━━━━━━━━━━━━━━━━━━━━━━━━━━━━━━
🔔 ALERT SYSTEM
Pre-configured alerts for:
- BUY Signal Confirmed
- SELL Signal Confirmed
- EXIT Long Position
- EXIT Short Position
- Any Entry Signal (combined)
- Any Exit Signal (combined)
Set once-per-bar-close alerts for automated trading
━━━━━━━━━━━━━━━━━━━━━━━━━━━━━━━━━━━━━━━━━━━
⚠️ RISK DISCLAIMER
This indicator is a tool for analysis and should not be used as the sole basis for trading decisions. Always:
- Backtest thoroughly before live trading
- Use proper risk management (1% rule)
- Consider market conditions and fundamentals
- Practice on demo accounts first
- Never risk more than you can afford to lose
Past performance does not guarantee future results.
━━━━━━━━━━━━━━━━━━━━━━━━━━━━━━━━━━━━━━━━━━━
📝 CREDITS
Original concept inspired by UNITED's confluence strategy
Enhanced and coded by jaredskii with assistance from ChatGPT
QQE MOD calculations based on standard QQE indicator methodology

One Leg Scalper, Aren TradingOne Leg Scalper — Precision Buy/Sell Signals for Every Market:
One Leg Scalper is a clean, fast and lightweight signal-based indicator designed for traders who want simple, accurate, rule-based entries without noise or chart clutter.
This tool detects a unique three-point market formation and automatically generates Buy or Sell signals when price confirms the structure with momentum.
It works on all markets (Crypto, Forex, Indices, Commodities) and on all timeframes, including scalping charts such as 1s,5s, 15s, 1m, 5m....
No complicated settings.
No repainting beyond the natural pivot confirmation.
Just clear signals based on price structure.
Key Features
✔ Automatic Buy & Sell signals:
Signals appear only after the market completes a verified structure and confirms it with price action.
✔ Works on all timeframes (including seconds):
Ultra-fast reactions for scalpers + higher-timeframe confirmation for swing traders.
✔ Non-intrusive chart design:
No extra shapes or distracting drawings — only clean labels placed exactly where they matter.
✔ Multi-market support:
Crypto, Forex, Stocks, Indices, Metals, Futures — fully compatible with every chart on TradingView.
✔ Smart internal filtering (three filters):
Reduces noise and ignores weak structures to focus only on meaningful setups.
How it Works (Simple Version — No Mechanism Revealed)
The indicator continuously tracks price structure and identifies a specific pattern formed by three market swing points.
When this structure completes and price confirms it, the indicator prints:
Buy → when bullish validation occurs
Sell → when bearish validation occurs
This ensures signals are triggered only after confirmation, avoiding premature or fake setups.
🔥free trial is available
“A 3-day free trial is available upon request.
Message me to unlock temporary access and test the indicator in real market conditions.”
Repainting Notice
The indicator waits for confirmed swing points, which requires a few bars of confirmation.
This is normal behavior for all pivot-based tools and does not repaint after confirmation.
Version 1.0 — Initial Release
Added delay confirmation settings.
Added minimum distance & price-difference filters.
Added customizable labels and alerts.
Early-signal raw-bar system (no repaint).
Optimized pivot storage for performance.
Disclaimer:
This indicator is a tool for technical analysis. Trading involves risk. Always use proper risk management and never risk more than you can afford to lose.

Swing High-Low Line ConnectorSwing High-Low Line Connector is a simple and intuitive tool that automatically detects swing highs and swing lows using fractal-style pivot logic and connects them with clean, continuous lines. This indicator helps traders visualize market structure, trend shifts, and swing-based support/resistance levels at a glance.
The script identifies each confirmed swing point based on a user-defined lookback window (left/right bars). When a new swing is confirmed, the indicator updates the previous leg or creates a new one, effectively drawing the classic “zigzag-style” connections used in discretionary trading and price-action analysis.
A dynamic tail extension is included to show the most recent swing extending toward the current price. By default, the tail follows a ZigZag-style logic—extending upward after a swing low and downward after a swing high—but users can also anchor it to Close, High, Low, or HL2.
Features
Automatic detection of swing highs and swing lows
Clean line connections between swings (similar to discretionary market-structure mapping)
Proper consolidation handling: weaker highs/lows are ignored
Optional ZigZag-style dynamic tail extension
Fully customizable lookback window, line color, and line width
Works on any market and timeframe
Use Cases
Identifying market structure (HH, HL, LH, LL)
Visualizing trend transitions
Spotting breakout levels and swing-based support/resistance
Aiding discretionary swing trading, trend following, or pattern recognition
This indicator keeps the logic simple and visual—ideal for traders who prefer clean chart structure without unnecessary noise.

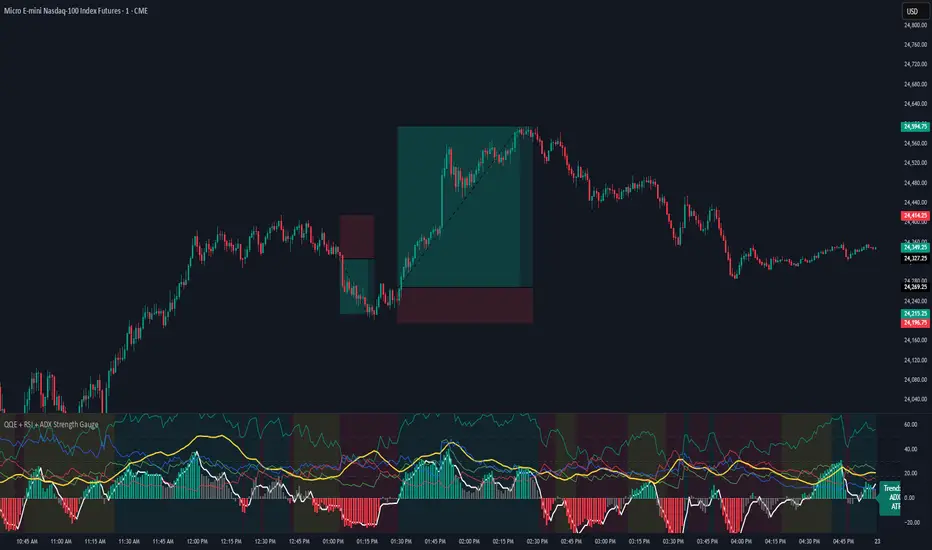
QQE + RSI + ADX Strength GaugeQQE + RSI + ADX Strength Gauge - Release Notes
A comprehensive multi-indicator oscillator combining QQE MOD momentum analysis with RSI, ADX, and ATR strength metrics for complete market analysis.
Features
+QQE MOD Oscillator
Primary & Secondary QQE calculations with Bollinger Band integration
Dynamic momentum-based column coloring (strong vs weak signals)
Clear bullish/bearish threshold zones
Strength Indicators
RSI (14) with overbought/oversold reference lines
ADX + DI lines for trend strength measurement
ATR for volatility context
Live trend gauge label (BULLISH/BEARISH/CHOP)
Visual Design
Clean, professional gradient aesthetic
Customizable colors for all indicators
Background coloring (oscillator pane + optional chart overlay)
Adjustable transparency settings
Settings
Fully adjustable QQE parameters (Primary/Secondary RSI, smoothing, factors)
Customizable Bollinger Bands (length, multiplier)
Adjustable indicator lengths (RSI, ADX, ATR)
ADX threshold control
Complete color customization
Credits
Original RSI + ADX + ATR Strength Gauge - Base structure and gauge concept - jaredskii
QQE MOD Indicator - QQE calculation logic - Mihkel00
Smart Cloud by Ilker (Custom Matriks)A Proprietary Hybrid Trend System for All Major Financial Assets
This indicator, originally developed for the Matriks platform, is a highly effective hybrid trend identification system designed for day-to-day analysis across all major asset classes, including Stocks, Forex, Indices, and Cryptocurrencies. It combines the forward-looking principle of the Ichimoku Kinko Hyo Cloud with heavily smoothed Moving Averages (MAs) to create a clear, visually guided trading signal. (Daily Timeframe recommended for optimal results).
📊 Algorithmic Structure and Parameters
The "Smart Cloud" utilizes six primary user-adjustable parameters that govern its sensitivity and shape, moving away from standard Ichimoku settings to provide a robust, customized trend view:
P1, P2, P3 (60, 56, 248): These long-term settings define the core structure and width of the cloud, acting as the primary dynamic support and resistance zone. The significantly longer P3 (Lagging Period) ensures the cloud reflects strong, deep market cycles.
P4 (Displacement 26): Maintains the traditional Ichimoku principle of projecting the cloud 26 periods forward to provide a predictive view of future trend support/resistance.
P5 (MA50 - Blue) & P6 (MA10 - Purple): These are the two primary Moving Averages plotted inside the cloud. They serve as fast-response momentum lines:
P5 (MA50): Represents the middle-term trend average.
P6 (MA10): Represents the short-term market momentum.
📈 Core Trend and Signal Interpretation
The indicator provides powerful trend identification based on three key components:
The Cloud (Kumo):
Green Cloud (Bullish): Indicates the dominant trend is up, suggesting dynamic support for price action.
Red Cloud (Bearish): Indicates the dominant trend is down, suggesting dynamic resistance.
The thickness and slope of the cloud are key indicators of trend strength.
MA Crossover Signal (Blue/Purple):
Buy Signal: When the faster Purple MA (P6=10) crosses above the slower Blue MA (P5=50).
Sell Signal: When the faster Purple MA (P6=10) crosses below the slower Blue MA (P5=50).
Price Action & Confirmation:
The most powerful signals occur when a MA Crossover is confirmed by price breaking out of the cloud in the same direction.
Price above the cloud and MA crossover to the upside suggests a strong buy entry.
Disclaimer: This tool is intended for analysis and decision-making support. It is not financial advice. Always use stop-loss orders and manage your risk accordingly.

Cumulative Volume Delta (HA Option)# **📘 Ultimate Guide to Trading With CVD Heikin Ashi (CVD+)**
## **🔍 What This Indicator Shows**
This tool plots **Cumulative Volume Delta (CVD)** as candlesticks—optionally transformed into **Heikin Ashi CVD candles**.
Instead of price, each candle represents the *battle between buyers and sellers* within your chosen timeframe.
**Volume Delta = Buying Volume – Selling Volume**
CVD takes all deltas and stacks them cumulatively, showing who is controlling the auction *over time*.
With Heikin Ashi smoothing layered on top, trend detection becomes cleaner, letting you see the “true pressure” behind price moves.
---
# **💡 Why CVD Is a Game Changer**
Most traders only see price.
Serious traders watch **pressure**.
CVD exposes what price hides:
* Absorption
* Hidden accumulation
* Seller exhaustion
* Fake breakouts
* True reversals
* Momentum strength / weakness
* Smart money footprint
When combined with Heikin-Ashi smoothing, you get delta trends with way less noise and fewer fake flips.
---
# **📈 How to Actually Use It (The Edge)**
## **1. Spot True Trend vs. Fake Trend**
If **price goes up** but **CVD goes down**, that’s:
* Passive sellers absorbing
* A weak rally
* High probability of reversal
If **price pulls back** but **CVD keeps rising**, that’s:
* Secret accumulation
* A continuation setup
* Great dip-buy opportunity
**Rule of thumb:**
🔹 *Follow the CVD trend, not the price noise.*
---
## **2. Catch Reversals Early**
Watch for:
### **🔻 Bearish Reversal Signals**
* CVD makes a **lower high**
* Heikin Ashi CVD prints **red bodies with rising upper shadows**
* Price makes one final push up on low delta
This is classic distribution → the drop usually follows fast.
### **🔹 Bullish Reversal Signals**
* CVD forms a **higher low**
* HA CVD flips from red to green with full bodies
* Price still looks weak = bottom forming
This is exactly how pros catch bottoms early.
---
## **3. Identify Absorption Levels**
If price hits a level multiple times but CVD keeps climbing (or falling), that level is being defended.
Example:
* Price stalls at support
* CVD keeps rising
= **Buyers absorbing sells → high-probability bounce**
Opposite works for resistance.
---
## **4. Validate Breakouts**
A breakout with *weak or negative CVD* is usually a trap.
A breakout with **strong, rising HA CVD** is real.
If CVD diverges from the breakout direction → fade it.
If CVD confirms → ride it.
---
## **5. Use Heikin Ashi to Stay in Trends**
HA smoothing removes the nasty chop of raw delta data.
Look for:
* Consecutive **full-body teal candles = strong buying wave**
* Consecutive **full-body red candles = strong selling wave**
* Small-bodied candles after a trend = momentum dying
This keeps you in winners longer and cuts losers faster.
---
# **🎯 Practical Trading Playbook**
### **A) Long Setup**
1. Price pullback into support
2. CVD stays bullish or makes a higher low
3. HA CVD flips green or prints a strong body
4. Enter long
5. Stop under CVD structural low
### **B) Short Setup**
1. Price pushes into resistance
2. CVD forms bearish divergence
3. HA CVD prints red bodies
4. Enter short
5. Stop above CVD swing high
### **C) Chop Filter**
No clear HA CVD trend = avoid trading → stop donating money to the market.
---
# **🧠 Tips for Mastery**
* Use lower timeframe delta (1m–5m) for scalping entries
* Use a higher anchor timeframe (1D) to define direction
* When price trends but CVD is flat → expect a fakeout
* When CVD trends but price is flat → expect a breakout
* Trade WITH delta, fade AGAINST delta
---
# **⚠️ Important Notes**
* Crypto = full tick-by-tick volume → CVD is extremely accurate
* Stocks = depends on your broker/data vendor
* Futures = best signal-to-noise ratio
* If your symbol has no volume → indicator will warn you
---
# **📥 Recommended Settings**
* **Anchor timeframe**: 1D or 4H
* **Lower timeframe**: 1m, 3m, or 5m
* **Heikin Ashi**: ON for trend filtering, OFF for raw delta
---
# **🔥 Final Word**
Price can lie.
Delta usually doesn’t.
CVD + Heikin Ashi gives you the closest thing to reading the market’s heartbeat in real time.
Use it to confirm breakouts, detect reversals early, identify real trend strength, and avoid getting caught in manipulation.
If you learn to read CVD well…
you stop trading price, and start trading the **intent** behind the price.

Eagle WavesEagle Waves is a precision trend-tracking and wave-reading system designed to help traders spot the real market direction early and stay aligned with momentum.
The indicator focuses on identifying clean waves, spotting trend shifts, and filtering out noise—giving you a clear view of where the market is likely heading next.
Eagle Waves highlights wave strength, trend continuation, exhaustion points, and momentum shifts so you can enter on strong legs and avoid weak or late positions.
What Eagle Waves Gives You
Clear wave visualization to read the market flow easily
Accurate trend direction with high-clarity color transitions
Wave strength indication to avoid weak or fading moves
Momentum confirmation before entering any wave
Reversal and exhaustion alerts when waves lose power
Smooth filters to reduce noise, especially on lower timeframes
Works on all markets: Forex, Crypto, Indices, Metals, and Stocks
Compatible with any strategy: scalping, intraday, or swing
Why Traders Use It
Helps you catch early trend legs
Keeps you out of choppy or uncertain zones
Makes wave reading visual and simple
Improves timing on entries and exits
Summary
Eagle Waves is built to make wave-based trading straightforward:
Clear waves. Clean trends. Better timing.

Wick-RSI-CandleBody_SEZERthis strategy is ideal to recognize peaks for both long and short positions in 1h and 4h periods. for quick response and faster trade, please use 15m period but keep in mind targeting lower profits. otherwise you may lose your profit.


Test shift level strategyTesting this on all timelines where in it checks the candle color and takes call to buy or sell

Dynamic Elliott Wave By Lucky-CBTIndicator overview
Dynamic Elliott Wave v5 detects and visually labels single-degree Elliott impulse (1–5) and corrective (A–B–C) structures using robust pivot detection and optional Fibonacci validation. It’s designed as a mechanical, configurable helper to identify clear wave structures across timeframes and instruments — useful as a structural guide for analysis and strategy development.
Key features
Mechanical pivot detection (zigzag-style) evaluated on confirmed bars for stability
Automatic detection and persistent drawing of 1–5 impulse and A–B–C corrective structures
Optional Fibonacci-based validation for Wave 2 / Wave 4 retracements with tolerance control
Configurable pivot lookback and minimum move threshold to reduce noise on different timeframes
Visuals: colored lines and labels for impulses (1–5) and corrections (A–B–C)
Lightweight memory use with bounded pivot storage and safe redraw logic
How it works (short)
Detects pivot highs/lows using ta.highestbars / ta.lowestbars over a user-set lookback
Builds candidate 5-pivot sequences and validates alternation, magnitude, and optional Fibonacci relationships
When a valid impulse is found the script stores and draws the 1–5 chain; if a following 3-pivot corrective is found it stores and draws A–B–C
Visuals persist until a new validated structure replaces them so charts remain readable
Inputs and recommended settings
Pivot lookback (bars): controls sensitivity. Lower for faster markets / lower TF (e.g., 3–7), higher for slow markets / higher TF (e.g., 10–30).
Min move size (%): filters tiny swings. Start ~0.5% for volatile symbols, 0.1–0.3% for large-cap equities on daily.
Use Fibonacci checks: on/off. Turn on to enforce common retrace rules; turn off if you prefer looser mechanical counts.
Fibonacci tolerance: widen for noisy markets, tighten for strict validation.
Show lines / Show labels: toggle visuals to reduce clutter.
Practical notes and limitations
Elliott Wave counting remains partly subjective; this script provides a consistent mechanical count, but it will not match every manual analysis. Use as a guide, not a final trading signal.
The script detects single-degree structures only. For nested multi-degree analysis, consider adding recursive detection layers or complementing with manual degree assignment.
Requires sufficient chart history (max_bars_back) to retain older pivots when reviewing long-term structures. Increase max_bars_back if needed.
Test and tune pivot_len and min_move_pct for your instrument and timeframe before relying on counts in live trading.
Change log (high level)
v1.0 — Initial release: mechanical pivot detection, impulse 1–5 and corrective A–B–C detection, persistent visuals, Fibonacci validation.
Future: planned options for ATR-based pivots, multi-degree nesting, manual clear/aging controls, and degree coloring.
Disclaimer
This indicator is provided for educational and analytical purposes only. It does not provide financial, investment, or trading advice. Always combine structural analysis with risk management and validate any strategy on historical data before trading live.
If you want, I can produce: (1) a shorter “one-sentence” blurb for the publish header, (2) example default settings for specific markets (BTC, Nifty, Forex), or (3) release notes formatted for TradingView — tell me which.

Forex Session TrackerForex Session Tracker - Professional Trading Session Indicator
The Forex Session Tracker is a comprehensive and visually intuitive indicator designed specifically for forex traders who need precise tracking of major global trading sessions. This powerful tool helps traders identify active market sessions, monitor session-specific price ranges, and capitalize on volatility patterns unique to each trading period.
Understanding when major financial centers are active is crucial for forex trading success. This indicator provides real-time visualization of the Tokyo, London, New York, and Sydney trading sessions, allowing traders to align their strategies with peak liquidity periods and avoid low-volatility trading windows.
---
Key Features
📊 Four Major Global Trading Sessions
The indicator tracks all four primary forex trading sessions with precision:
- Tokyo Session (Asian Market) - Captures the Asian trading hours, ideal for JPY, AUD, and NZD pairs
- London Session (European Market) - Monitors the most liquid trading period, perfect for EUR, GBP pairs
- New York Session (American Market) - Tracks US market hours, essential for USD-based currency pairs
- Sydney Session (Pacific Market) - Identifies the opening of the trading week and AUD/NZD activity
Each session is fully customizable with individual color schemes, making it easy to distinguish between different market periods at a glance.
🎯 Session Range Visualization
For each active trading session, the indicator automatically:
- Draws rectangular boxes that highlight the session's time period
- Tracks and displays session HIGH and LOW price levels in real-time
- Creates horizontal lines at session extremes for easy reference
- Positions session labels at the center of each trading period
- Updates dynamically as new highs or lows are formed within the session
This visual approach helps traders quickly identify:
- Session breakout opportunities
- Support and resistance zones formed during specific sessions
- Range-bound vs. trending session behavior
- Key price levels that institutional traders are watching
📱 Live Information Dashboard
A sleek, professional information panel displays:
- Real-time session status - Instantly see which sessions are currently active
- Color-coded indicators - Green dots for active sessions, gray for closed sessions
- Timezone information - Confirms your current timezone settings
- Customizable positioning - Place the dashboard anywhere on your chart (Top Left, Top Right, Bottom Left, Bottom Right)
- Adjustable size - Choose from Tiny, Small, Normal, or Large text sizes for optimal visibility
The dashboard provides at-a-glance awareness of market conditions without cluttering your chart analysis.
⚙️ Extensive Customization Options
Every aspect of the indicator can be tailored to your trading preferences:
Session-Specific Controls:
- Enable/disable individual sessions
- Customize colors for each trading period
- Adjust session times to match your broker's server time
- Toggle background highlighting on/off
- Show/hide session high/low lines independently
General Settings:
- UTC Offset Control - Adjust timezone from UTC-12 to UTC+14
- Exchange Timezone Option - Automatically use your chart's exchange timezone
- Background Transparency - Fine-tune the opacity of session highlighting (0-100%)
- Session Labels - Show or hide session name labels
- Information Panel - Toggle the live status dashboard on/off
Style Settings:
- Turn session backgrounds ON/OFF directly from the Style tab
- Maintain clean charts while keeping all analytical features active
🔔 Built-in Alert System
Stay informed about session openings with customizable alerts:
- Tokyo Session Started
- London Session Started
- New York Session Started
- Sydney Session Started
Set up notifications to never miss important market opening periods, even when you're away from your charts.
---
How to Use This Indicator
For Day Traders:
1. Identify High-Volatility Periods - Focus your trading during London and New York session overlaps for maximum liquidity
2. Monitor Session Breakouts - Watch for price breaks above/below session highs and lows
3. Avoid Low-Volume Periods - Recognize when major sessions are closed to avoid false signals
For Swing Traders:
1. Mark Key Levels - Use session highs and lows as support/resistance zones
2. Track Multi-Session Patterns - Observe how price behaves across different trading sessions
3. Plan Entry/Exit Points - Time your trades around session openings for better execution
For Currency-Specific Traders:
1. JPY Pairs - Focus on Tokyo session movements
2. EUR/GBP Pairs - Monitor London session activity
3. USD Pairs - Track New York session volatility
4. AUD/NZD Pairs - Watch Sydney and Tokyo sessions
---
Technical Specifications
- Pine Script Version: 5
- Overlay Indicator: Yes (displays directly on price chart)
- Maximum Bars Back: 500
- Drawing Objects: Up to 500 lines, boxes, and labels
- Performance: Optimized for real-time data processing
- Compatibility: Works on all timeframes (recommended: 5m to 1H for session tracking)
---
Installation & Setup
1. Add to Chart - Click "Add to Chart" after copying the script to Pine Editor
2. Configure Timezone - Set your UTC offset or enable "Use Exchange Timezone"
3. Customize Colors - Choose your preferred color scheme for each session
4. Adjust Display - Enable/disable features based on your trading style
5. Set Alerts - Create alert notifications for session starts
---
Best Practices
✅ Combine with Price Action - Use session ranges alongside candlestick patterns for confirmation
✅ Watch Session Overlaps - The London-New York overlap (1300-1600 UTC) typically shows highest volatility
✅ Respect Session Highs/Lows - These levels often act as intraday support and resistance
✅ Adjust for Your Broker - Verify session times match your broker's server clock
✅ Use Multiple Timeframes - View sessions on both lower (15m) and higher (1H) timeframes for context
---
Why Choose Forex Session Tracker Pro?
✨ Professional Grade Tool - Built with clean, efficient code following TradingView best practices
✨ Beginner Friendly - Intuitive design with clear visual cues
✨ Highly Customizable - Adapt every feature to match your trading style
✨ Performance Optimized - Lightweight code that won't slow down your charts
✨ Actively Maintained - Regular updates and improvements
✨ No Repainting - All visual elements are fixed once the session completes
---
Support & Updates
This indicator is designed to provide reliable, accurate session tracking for forex traders of all experience levels. Whether you're a scalper looking for high-volatility windows or a position trader marking key institutional levels, the Forex Session Tracker Pro delivers the insights you need to make informed trading decisions.
Happy Trading! 📈
---
Disclaimer
This indicator is a tool for technical analysis and should be used as part of a comprehensive trading strategy. Past performance does not guarantee future results. Always practice proper risk management and never risk more than you can afford to lose. Trading forex carries a high level of risk and may not be suitable for all investors.

Elliott Wave + SMC Fusion # Elliott Wave + SMC Fusion
## TITLE:
Elliott Wave + Smart Money Concepts Fusion
---
## SHORT DESCRIPTION:
Automated Elliott Wave pattern detection with Smart Money Concepts confirmation, EWO oscillator integration, and confluence scoring system.
---
## FULL DESCRIPTION:
### 📊 OVERVIEW
This indicator combines three powerful trading methodologies into a unified system:
- **Elliott Wave Theory** - Automated detection of Wave 1-2 impulse patterns
- **Smart Money Concepts (SMC)** - Order Blocks and Fair Value Gaps for institutional confirmation
- **Elliott Wave Oscillator (EWO)** - Momentum-based signal validation
The core concept is to identify high-probability Wave 3 entries by detecting completed Wave 1-2 structures and validating them with SMC and momentum indicators.
---
### 🔧 HOW IT WORKS
**1. Pattern Detection (ZigZag Method)**
- Uses pivot high/low detection to identify swing points
- Validates Wave 2 retracement using Fibonacci ratios (default: 38.2% - 88.6%)
- Requires minimum wave size to filter noise
- Applies confirmation bars to avoid premature signals
**2. Wave Projections**
- Wave 3 target: Fibonacci extension of Wave 1 (default: 1.618)
- Wave 4 retracement: Percentage of Wave 3 (default: 38.2%)
- Wave 5 projection: Extension of Wave 1 from Wave 4
**3. Smart Money Validation**
- **Order Blocks**: Identifies last opposing candle before breakout (institutional footprint)
- **Fair Value Gaps**: Detects price imbalances for potential support/resistance
**4. EWO Confirmation**
- Calculates momentum: (EMA5 / EMA34 - 1) × 100
- Signal line crossovers confirm trend direction
- Strong signals occur at extremes (< -13 or > 13 threshold)
**5. Confluence Scoring (0-100%)**
Points awarded for:
- Fibonacci quality of Wave 2 retracement (10-30 pts)
- Order Block presence (15 pts)
- Fair Value Gap presence (10 pts)
- Volume confirmation (10-15 pts)
- Trend alignment with EMA50 (10 pts)
- EWO confirmation (10-20 pts)
---
### 🎯 UNIQUE FEATURES
**Pattern Locking System**
- Once a valid pattern is detected, it locks until:
- Pattern invalidates (price breaks Wave 0)
- Pattern completes (Wave 5 reached)
- Auto-timeout (configurable bars)
- Prevents rapid signal flipping and false alerts
**Signal Stability Controls**
- Adjustable cooldown between signals (default: 20 bars)
- Minimum bar distance between wave points
- Direction change requirement option
- Confirmation bars after Wave 2 formation
**Visual Wave Tracking**
- Solid lines for impulse waves (0→1, 2→3, 4→5)
- Dashed lines for corrective waves (1→2, 3→4)
- Numbered labels on each wave point
- Real-time projection lines to targets
**Comprehensive Dashboard**
- Current wave status and lock state
- Pattern grade (A+ to D based on confluence)
- Projected vs actual wave levels (✓ when completed)
- SMC confirmation status
- Risk/Reward ratio calculation
- EWO trend direction
---
### 📈 TRADING APPLICATION
**Entry Strategy**
- Wait for Wave 1-2 pattern detection (diamond signal)
- Check confluence score (>65% = higher probability)
- Verify EWO alignment with pattern direction
- Enter after 30% retracement of Wave 2 (customizable)
**Risk Management**
- Stop Loss: Below Wave 0 (with buffer)
- Take Profit 1: Wave 3 projection
- Take Profit 2: Wave 5 projection
- R:R displayed in dashboard
**Invalidation Rules**
- Price breaks below Wave 0 (bullish) or above (bearish)
- Wave 2 level violated before Wave 3 forms
- Pattern timeout exceeded
---
### ⚙️ KEY SETTINGS
**Elliott Wave**
- ZigZag Length: Pivot detection sensitivity
- Fib Tolerance: Acceptable retracement range
- Min Wave Size: Filter small movements
**Signal Stability**
- Signal Cooldown: Minimum bars between signals
- Lock Pattern Until Invalid: Prevent signal changes
- Confirmation Bars: Wait after Wave 2
**Wave Projection**
- Wave 3/4/5 Fibonacci extensions
- Projection display distance
**EWO Settings**
- Fast/Slow EMA lengths
- Signal smoothing
- Strength threshold
**SMC Settings**
- Order Block lookback period
- FVG minimum size percentage
---
### 🔔 ALERTS
- New bullish/bearish pattern detected
- High confluence setup (>75%)
- Pattern invalidation
- Wave completion
---
### ⚠️ IMPORTANT NOTES
- This indicator identifies **potential** Elliott Wave patterns based on mathematical rules
- Elliott Wave analysis is subjective - patterns may be interpreted differently
- Always combine with other analysis methods and proper risk management
- Past pattern performance does not guarantee future results
- Pattern locking prevents repainting but delays new pattern detection
- Best used on higher timeframes (1H+) for cleaner wave structures
---
### 📚 METHODOLOGY REFERENCES
**Elliott Wave Theory**
- Wave 2 typically retraces 38.2% - 88.6% of Wave 1
- Wave 3 is often the strongest, extending 161.8% of Wave 1
- Wave 4 usually retraces 38.2% of Wave 3
- Wave 5 completes the impulse structure
**Smart Money Concepts**
- Order Blocks represent institutional supply/demand zones
- FVGs indicate price inefficiencies that may act as magnets
**Elliott Wave Oscillator**
- Developed to identify wave momentum
- Crossovers signal potential wave transitions
- Extreme readings often coincide with wave completions
---
### 🎨 VISUAL ELEMENTS
- **Green**: Bullish patterns and projections
- **Red**: Bearish patterns and projections
- **Orange**: Wave projection levels
- **Purple**: Order Block zones
- **Yellow**: Fair Value Gaps
- **Blue**: Entry levels
- **Diamond shapes**: New pattern signals
- **Triangle shapes**: EWO crossover signals
---
### 💡 TIPS FOR BEST RESULTS
1. Use on liquid markets with clear trend behavior
2. Higher timeframes produce more reliable patterns
3. Look for confluence scores above 65%
4. Verify EWO alignment before entry
5. Consider market context (overall trend, key levels)
6. Adjust ZigZag length based on your trading style
7. Increase cooldown period for longer-term signals
---
**Indicator Type**: Overlay
**Markets**: All (Crypto, Forex, Stocks, Commodities)
**Timeframes**: All (1H+ recommended)
**Style**: Pattern Recognition + Momentum + Price Action

TrenVantage TRADER - Market Structure Intelligence 📘 TrenVantage TRADER – Market Structure Intelligence
Hello Traders!
We are excited to introduce TrenVantage TRADER! This indicator is a professional-grade market structure tool designed for active traders and analysts who require deeper insight and more precise control. It combines advanced pivot-based level detection, a dynamic ZigZag engine, multi-timeframe trend awareness, and Fibonacci integration into a clear and actionable visual layout. The TRADER edition offers enhanced logic that highlights multiple key levels (up to 8) with strength ratings, making it ideal for traders who need full market context without oversimplification. Whether you are day-trading, swing-trading, or managing multiple assets, TrenVantage TRADER empowers you to understand price structure, identify confluence zones, and monitor directional bias in real time.
✨ Key Features
🔹 Smart Support & Resistance (Max 8 Levels – TRADER Version)
- Auto-detected levels using precision candle-body logic
- Prioritizes the strongest zones with strength ratings
- Includes tested vs. untested levels for professional analysis
- Ideal for reaction-based trading and advanced setups
🔹 Advanced Pivot Engine
- Timeframe-aware, body-focused pivot detection
- Dynamic lookback for professional-level accuracy
- Filters weak pivots to reduce chart clutter
🔹 Dynamic Trend Detection (ZigZag Core)
- Real-time uptrend / downtrend state with swing-based mapping
- Adjustable deviation and sensitivity for professional precision
- Tracks higher highs, higher lows, lower highs, lower lows
🔹 Multi-Timeframe Trend Integration
- Detects trends across multiple higher timeframes
- Displays trend confluence scores for actionable insight
- Helps identify alignment with larger market bias
🔹 Status Box Dashboard
- Displays current trend, price, price change, and SMA & EMA trend position
- Nearest S/R with distance and strength information
- Multi-timeframe trend direction and confluence
- Market position summary (above, below, or between levels)
- Active S/R count and proximity detection status
🔹Dual SMA & EMA Overlay
- Fully adjustable period and visual style
- Acts as a directional filter and confluence tool
- Integrated into status box for instant comparison
- Crossover signals printed
🔹 Proximity & Trend Alerts
- Alerts when price approaches key S/R within defined distance
- Alerts on trend changes (Uptrend / Downtrend)
- Level break alerts for advanced breakout and reversal strategies
- Once-per-bar logic to avoid excessive notifications
🔹 Fibonacci Levels Overlay
- Auto-detects recent swing high/low for retracements and extensions
- Retracements: 23.6%, 38.2%, 50%, 61.8%
- Extensions: 127.2%, 161.8%
- Labels percentage levels directly on chart
- Works alongside S/R for confluence-based analysis
🔍 In-Depth Feature Breakdown
1. Smart Support & Resistance Levels
TrenVantage TRADER uses a refined pivot-based engine combined with candle-body logic to detect the strongest support and resistance zones. Unlike simpler tools, it can maintain up to 8 key levels with visual strength ratings.
How It Works
- Prioritizes zones with multiple touches and tested/untested status
- Tracks both current timeframe and higher timeframe context
- Highlights levels with color-coded clarity:
- Green = Support
- Red = Resistance
How It Helps Traders
- Provides comprehensive market structure overview
- Helps identify strong confluence zones for trading setups
- Reduces guesswork and supports data-driven decisions
2. Advanced Pivot Engine
Professional-grade pivot detection ensures only significant pivots are plotted, improving the reliability of support/resistance levels.
How It Works
- Dynamically adapts lookback periods based on volatility
- Focuses on candle bodies for more robust zone detection
- Filters out weak or irrelevant pivots
How It Helps Traders
- Clean, reliable chart with actionable levels
- Supports both breakout and reaction strategies
- Works across scalping, day, and swing-trading approaches
3. Dynamic Trend Detection (ZigZag Core)
Tracks real structural swings for professional trend analysis, avoiding guesswork or noise.
How It Works
- Detects higher highs/lows and lower highs/lows
- Adjustable deviation filtering for precision
- Smoothly updates trend direction without excessive repainting
How It Helps Traders
- Quickly identifies trend shifts and continuation setups
- Aligns positions with market structure for higher probability trades
- Reduces false signals by focusing on meaningful swings
4. Multi-Timeframe Trend Integration
Professional traders need to see trend alignment across multiple timeframes.
How It Works
- Detects trend direction on 2–3 higher timeframes
- Displays MTF confluence in status box
- Provides a clear bias score for informed decision-making
How It Helps Traders
- Confirms entries and exits with higher timeframe alignment
- Improves risk management with multi-level awareness
- Supports advanced strategy building
5 . Status Box Dashboard
A compact information hub displaying essential market data in real time.
What It Shows
- Trend direction & momentum bias
- SMA position & influence
- Nearest support & resistance levels
- Distance and strength of each level
- Multi-timeframe trend confluence
- Market position summary
- Active S/R count and proximity alerts
How It Helps Traders
- Reduces need to constantly scan the chart
- Improves situational awareness and trade timing
- Supports multi-asset monitoring with clarity
6. Dual SMA & EMA Overlay
Adds professional-grade trend filters with both SMA and EMA, giving traders more clarity and confluence without chart clutter.
How It Works
- Plots two adjustable moving averages: one SMA and one EMA
- SMA serves as a directional trend filter, EMA highlights momentum shifts
- Both moving averages can be integrated into the status box for instant comparison
- Optional cross signals indicate potential trend reversals or acceleration
How It Helps Traders
- Confirms trend alignment across both smooth (SMA) and reactive (EMA) perspectives
- Detects momentum shifts early to support entries, exits, and trade management
- Adds confluence when combined with support/resistance levels and multi-timeframe trends
- Provides a clear visual guide for swing, day, and position trading
7. Proximity & Trend Alerts
Professional-grade alerts ensure traders never miss actionable events.
How It Works
- Alerts when price approaches key levels within set distance
- Alerts on trend change or level break
- Configured once-per-bar for clarity
How It Helps Traders
- Supports breakout, reaction, and reversal strategies
- Reduces chart monitoring time
- Ensures key market shifts are noticed immediately
8. Fibonacci Levels Overlay
TrenVantage TRADER integrates dynamic Fibonacci retracements and extensions directly into your chart, giving you an advanced tool to anticipate potential reversal, continuation, and breakout zones.
How It Works
- Automatically detects the most recent significant swing high and swing low
- Draws retracement levels: 23.6%, 38.2%, 50%, 61.8%
- Draws extension levels: 127.2%, 161.8%
- Retracements follow the direction of the last swing; extensions project potential breakout targets
- Optional labels show the percentage level directly on the chart for clarity
- Fully adjustable opacity and visibility settings for clean visual representation
How It Helps Traders
- Highlights areas where price is likely to react or stall
- Supports both trend-following and counter-trend strategies
- Works in conjunction with support/resistance levels for confluence-based decision-making
- Adds an objective, mathematically-based reference for target setting and trade management
🚀 Getting Started (Quick Guide)
🔹Add the Indicator to Your Chart
- Works instantly on any timeframe or market
🔹Adjust the Settings
- Configure S/R levels, SMA, MTF trend, and alerts
🔹Watch Key Levels
- Red = Key Resistance Levels, Green = Key Support Levels
🔹Level Types
- By default, Tested Levels = Dotted, Untested Levels = Solid
🔹Monitor Status Box
- Check trend, SMA position, nearest levels, and market context
🔹Set Alerts
- Enable proximity, trend change, and level break notifications
📈 Best Practices for TrenVantage TRADER
🔹 Trend Confirmation:
- Combine ZigZag trend state, SMA, and MTF trend alignment.
🔹 Level Reactions:
- Observe price at the nearest support/resistance zones; proximity alerts help anticipate reactions.
🔹 Market Positioning:
-Use status box to quickly assess whether price is above, below, or between levels.
🔹 Confluence Building:
- Combine multiple levels, SMA, and MTF alignment for higher probability setups.
🔹 Professional Clarity:
- Up to 8 key levels are shown with strength ratings, balancing insight and chart readability.
📌 Disclaimer
This indicator is a technical analysis tool provided for informational and educational purposes only. It does not constitute financial advice, trading advice, or investment recommendations. All trading involves risk, and past performance does not guarantee future results. Always perform your own analysis and use proper risk management. You are solely responsible for any decisions made based on this tool.
If you'd like access or have any questions, feel free to reach out to me directly via DM.

TrenVantage RETAIL - Smart Support and Resistance📘 TrenVantage RETAIL – Smart Support & Resistance
Hello Traders!
We are excited to introduce this new tool TrenVantage RETAIL! This indicator is a precision-built market structure tool designed to help traders easily identify actionable Support & Resistance zones, emerging trends, and proximity-based reaction areas. It combines pivot-based level detection, a dynamic ZigZag engine, and trend-awareness analytics into a clean, non-cluttered visual layout. The RETAIL edition offers simplified yet powerful logic that highlights only the most relevant 2–3 key levels, making it ideal for traders who prefer clarity over chart overload. Whether you are day-trading or swing-trading, TrenVantage RETAIL helps you understand price behavior, locate nearby reaction zones, and monitor directional bias in real time.
✨ Key Features
🔹 Smart Support & Resistance (Max 3 Levels – Retail Version)
- Auto-detected levels using precision body logic
- Keeps only the most relevant 2–3 zones
- Clean, minimal, and ideal for reaction-based trading
🔹 Clean Pivot Engine
- Uses timeframe-based pivots
- Body-focused calculations improve accuracy
- Fixed retail-friendly lookback ensures consistency
🔹 Trend Detection (ZigZag-Based)
- Real-time uptrend / downtrend state
- Swing-based structure mapping
- Adjustable deviation settings
🔹 Status Box Dashboard
- Trend direction + momentum bias
- Current price & price change
- SMA position and trend influence
- Nearest S/R with point distances
- Market position summary
- Level counts and proximity status
🔹 SMA Overlay
- Fully adjustable period
- Useful for extra confirmation
🔹 Real-Time Alerts
- Proximity alerts near S/R
- Trend change alerts (Uptrend / Downtrend)
- Clean once-per-bar confirmations
🔍 In-Depth Feature Breakdown
1. Smart Support & Resistance Levels
TrenVantage RETAIL uses a refined pivot-based engine combined with candle-body logic to detect only the most meaningful support and resistance zones. Instead of flooding your chart with lines, the algorithm intelligently maintains up to three major levels at any time.
How It Works
- Uses primary pivots from the current timeframe
- Prioritizes candle bodies over wicks for more reliable zones
- Removes outdated levels to keep the chart clean
- Highlights levels with color-coded clarity:
Green = Support
Red = Resistance
How It Helps Traders
- Keeps focus on the levels that matter
- Reduces noise and over-analysis paralysis
- Helps anticipate reactions, rejections, consolidations, and tests
- Works across all markets and timeframes
2. Streamlined Pivot Engine
While many indicators use fixed pivot logic, TrenVantage RETAIL uses a timeframe-aware pivot engine optimized for retail traders who prefer precision without complexity.
How It Works
- Pulls pivots from the trader’s active timeframe
- Uses body-to-body pivot recognition to improve accuracy
- Reduces over-plotting by filtering out weak pivots
How It Helps Traders
- Provides cleaner, more accurate structural points
- Enhances the reliability of support/resistance levels
- Adapts naturally whether you're scalping or swing trading
3. Dynamic Trend Detection (ZigZag Core)
TrenVantage RETAIL includes a clean and efficient ZigZag engine that tracks real structural swings, allowing traders to see trend direction with clarity rather than guessing.
How It Works
- Identifies higher highs, higher lows, lower highs, lower lows
- Uses deviation-based swing filtering
- Smoothly updates trend direction without excessive repainting
- Visually displays structure transitions
How It Helps Traders
- Quickly identifies early trend shifts
- Supports both breakout and pullback strategies
- Helps traders align positions with market structure
- Reduces false signals by focusing on meaningful swings
4. The Status Box Dashboard
The Status Box is your real-time information hub. It reads the current market environment and displays the most essential data in a compact, easy-to-follow format.
What It Shows
- Trend direction
- Price & price change
- SMA position (above/below)
- Nearest support & resistance
- Distance to each level
- Market position: above, below, or between levels
- Count of active S/R zones
- Proximity detection status
How It Helps Traders
- Gives instant situational awareness
- Reduces the need to constantly check chart details
- Helps traders avoid impulsive or uninformed decisions
- Makes multi-timeframe analysis quicker
5. SMA Overlay
The optional SMA is a lightweight trend filter. It adds another layer of clarity without overwhelming the chart.
How It Works
- Plots a standard, adjustable period SMA
- Works as a directional or momentum filter
- Integrates into the status box for quick comparison
How It Helps Traders
- Confirms trend direction
- Adds confluence when combined with levels
- Helps detect momentum shifts early
6. Proximity & Trend Alerts
TrenVantage RETAIL includes clean, actionable alerts that work in real time.
How It Works
- Alerts when price approaches support/resistance within your chosen distance
- Alerts on trend changes (Uptrend / Downtrend)
- Uses once-per-bar logic to avoid excessive notifications
How It Helps Traders
- Removes the need to stare at charts
- Supports breakout, reaction, and reversal strategies
- Ensures traders never miss major structure shifts
🚀 Getting Started (Quick Guide)
1) Add the Indicator to Your Chart
Works instantly on any timeframe or market
2) Adjust the Settings
Toggle S/R, SMA, Alerts, and the Status Box to match your style
3) Watch Key Levels
Red = Key Resistance Levels, Green = Key Support Levels
4) Monitor Status Box
Check Trends, Nearest Levels, SMA Position, and Market Context at a Glance
5) Set Alerts
Enable Trend-Change and Proximity alerts through TradingViews alert menus
📈 Best Practices for TrenVantage RETAIL
🔹Trend Confirmation:
Use the ZigZag trend state and SMA position to confirm whether the market is leaning bullish or bearish.
🔹Level Reactions:
Watch how price behaves as it approaches the nearest S/R line.
Proximity alerts notify you when price is within your chosen distance threshold.
🔹Market Positioning:
The dashboard helps you quickly assess whether price is above all levels, below all levels, or trading between them—useful for breakout and range traders.
🔹Confluence Building:
Combine S/R zones with SMA direction to identify areas of confluence where reactions are more likely.
🔹Chart Clarity Focus:
Since this is the RETAIL version, only the most meaningful three levels are shown at a time—ideal for traders who prefer a clean, structured view.
📌 Disclaimer
This indicator is a technical analysis tool provided for informational and educational purposes only. It does not constitute financial advice, trading advice, or investment recommendations. All trading involves risk, and past performance does not guarantee future results. Always perform your own analysis and use proper risk management. You are solely responsible for any decisions made based on this tool.
If you'd like access or have any questions, feel free to reach out to me directly via DM.

ChanLun Pro|HL标准化与分形 (v6) — 主图ChanLun Pro
There are multiple automatic drawing modes for the candlestick pattern in Chan Theory, including the sub-high/sub-low mode and the high/low mode.

Slope Rank ReversalThis tool is designed to solve the fundamental problem of "buying low and selling high" by providing objective entry/exit signals based on momentum extremes and inflection points.
The System employs three core components:
Trend Detection (PSAR): The Parabolic SAR is used as a filter to confirm that a trend reversal or transition is currently underway, isolating actionable trade setups.
Dynamic Momentum Ranking: The indicator continuously measures the slope of the price action. This slope is then ranked against historical data to objectively identify when an asset is in an extreme state (overbought or oversold).
Signal Generation (Inflection Points):
Oversold/Buy: A 🟢 Green X is generated only when the slope ranking indicates the market is steeply negative (oversold), and the slope value begins to tick upwards (the inflection point), signaling potential mean reversion.
Overbought/Sell: A 🔴 Red X is generated only when the slope ranking indicates the market is steeply positive (overbought), and the slope value begins to tick downwards, signaling momentum exhaustion.
The core philosophy is simple: Enter only when the market is exhausted and has started to turn.

ECG PRICE - mauricioofsousa📉 ECG PRICE – The Price Electrocardiogram
(explained for traders, scientists, and complete beginners)
🔍 1. WHAT IS THE ECG PRICE?
The ECG PRICE protocol is a market-reading system based on the RSI, but with a surgical twist:
👉 You don’t just calculate RSI from price.
👉 You adjust the price using the RSI, and then calculate RSI over this adjusted price.
This creates a filtered, amplified signal that behaves like a heart monitor for price, detecting micro-impulses and subtle market movements long before they show up in the standard RSI.
🧬 2. CORE IDEA
Just like a real ECG amplifies and reveals electrical rhythms hidden inside the heartbeat,
the ECG PRICE amplifies micro-deformations hidden inside the price’s momentum.
It works in three stages:
Compute the regular RSI
Use the RSI to adjust the price (creating an electrocardiographic price)
Compute a second RSI over this modified price
The result is a meta-derived oscillator—more sensitive, more precise, and better at detecting structural changes.
🧩 3. TECHNICAL BREAKDOWN
3.1. First RSI (classic)
The script calculates:
average gains
average losses
relative strength (RS)
and then the standard 0–100 RSI
This is the “normal heart rate monitor” everyone uses.
3.2. Creating the “Adjusted Price”
adjustedPrice = close * (rsi / 100)
This means:
➡️ When RSI is high (strong buying momentum), price is amplified.
➡️ When RSI is low (strong selling momentum), price is compressed.
This converts raw price into a bio-electrical signal, where the price itself is modulated by its own internal momentum.
It’s the financial equivalent of ECG gain adjustment.
3.3. RSI of the Adjusted Price
Now the script calculates a new RSI from this modified price.
That is the actual ECG PRICE.
This second-order oscillator becomes extremely sensitive to:
micro-momentum shifts
early trend fading
volatility shocks
micro-divergences
institutional pressure waves
It reads the electrical pattern behind the price rather than the superficial movement.
🟩🟥 4. Diagnostic Lines of the Protocol
35 (green dotted)
Pre-oversold fatigue zone.
65 (red dotted)
Pre-overbought exhaustion zone.
30 (white solid)
Classic oversold.
70 (white solid)
Classic overbought.
Together they create two diagnostic corridors:
1. Medical corridor (30–70):
Standard RSI clinical range.
2. Electrical corridor (35–65):
The ECG-sensitive zone where micro-shifts appear first.
🧠 5. In Engineering Language (MGO style)
The ECG PRICE is essentially:
A nonlinear second-order oscillator where the RSI feeds back into price, creating a recursive momentum-modulated signal.
It functions like a:
bioinformational modulator
feedback-driven wave processor
impulse amplifier
micro-PID sensitivity enhancer
Very similar to the informational-wave transformations inside the MGO pipeline.
👨⚕️📉 6. Explained for a Total Beginner
Imagine the price is a heart.
The normal RSI shows if the heart is beating fast or slow.
But the ECG PRICE takes that heartbeat…
feeds it back into the heart…
and then measures the new heartbeat.
This creates a much more sensitive exam that detects problems before the normal test would.
💡 7. What It Gives You in Practice
earlier reversal signals
better trend-fatigue detection
clearer micro-divergences
a clean RSI with reduced noise
a smoother momentum curve
advanced behavioral readings before breakouts
It’s an upgrade.
A second-layer RSI that “hears” the inner electrical impulses of price.
