Gann Swings Trend CounterBased on Rick Santos ' Swing Charts V1 Darvas Box V0.1' However I have migrated script to pine version 3, customized to suite and added a higher number for the trend count Pine Script® göstergesiLij_MC tarafındanGüncellendi 1111 1 K
ZigZag Repaint Examplesimple example showing how to use na to create straight lines that "repaint" as the latest bars update.Pine Script® göstergesiParCorn tarafından113
Levels and Zones • Minimalist TradingThe Levels and Zones is a leading indicator which automatically identifies the best support and resistance levels as well as their corresponding bullish and bearish zones. The indicator constantly detects and highlights for you the optimum levels and zones where you will find the greatest opportunities to go long or short . As soon as the market moves to a new level with the Levels and Zones you will be ready to catch the next profitable trade . The indicator is available via subscription and you can enjoy a free trial . To know more about the indicator and start the trial simply visit the link below. ➡ Try the indicatorPine Script® göstergesia.b tarafındanGüncellendi 3939326
[RS]ZigZag Percent ReversalRequest by popular demand. :pPine Script® göstergesiRicardoSantos tarafındanGüncellendi 33528
BullTrading ZigZagSome people say the ZigZag indicator is the Holy Grail... I think half of this statement is true :) This is an alert friendly ZigZag indicator with MultiTimeframe Capabilities, it will alert you each time the ZigZag plots a new line (Higher Timeframe ZigZags are plotted with respective timeframe offset). Note: The indicator works on higher timeframes (D and above) Default Resolution is D, adjust resolution to your favorite timeframe and Min % Use in conjunction with your Fib tool and enjoy. Pine Script® göstergesiBullTradingAM tarafındanGüncellendi 55375
Ppsignal Average True Range IndicatorPpsignal atr measures candle true ranges when there are a breakdown o breakout of range, we have a buy or sell signalsPine Script® göstergesiPpSignal01 tarafındanGüncellendi 111169
Weis Wave ChartThis indicator is based on the Weis Wave described by David H. Weis in his book Trades About to Happen: A Modern Adaptation of the Wyckoff Method, more info how to use this indicator can be found in this video . The Weis Wave is an adaptation of Richard D. Wyckoff’s method Wave Charts. It works in all time periods and can be applied to all asset types. Unlike other implementations I found here on TradingView, this implementation make use of a Renko-like zig zag pattern, very similar to how it is described in David H. Weis' book. The settings for the zig zag pattern are very similar to the standard Renko settings here on TradingView, in the "Renko Assignment Method" you either chose "ATR" or "Traditional" (read more about it here ). The ATR length or the brick size is then entered in the textbox "Value". You can also chose another setting in the "Renko Assignment Method" drop down named "Part of Price" which calculate the brick size from the current close and divide it by the value in the text box "Value". It is also possible to chose if the zig zag pattern shall use the high/low, the open/close or just the close as the most extreme values in its calculation, you select this in the drop down "Price Source". TradingView's pine script does currently not support to print non-static text on the chart, so it is not possible at this point to write out the volume on the zig zag chart. It is also not possible to have both an overlay and separate chart pane in the same indicator, therefor this indicator is split up in two. You can find the volume indicator here: Pine Script® göstergesimodhelius tarafındanGüncellendi 2020 2.3 K
Weis Wave VolumeThis indicator is based on the Weis Wave described by David H. Weis in his book Trades About to Happen: A Modern Adaptation of the Wyckoff Method, more info how to use this indicator can also be found in this video . The Weis Wave is an adaptation of Richard D. Wyckoff’s method Wave Charts. It works in all time periods and can be applied to all asset types. For assets that do not support volume Weis propose in his book to use the true range instead, so if you want to use this indicator for assets that do not support volume, make sure to enable the checkbox "Use True Range instead of Volume". Unlike other implementations I found here on Trading, this implementation make use of a Renko-like zig zag pattern, very similar to how it is described in David H. Weis' book. The settings for the zig zag pattern are very similar to the standard Renko settings here on TradingView, in the "Renko Assignment Method" you either chose "ATR" or "Traditional" (read more about it here ). The ATR length or the brick size is then entered in the textbox "Value". You can also chose another setting in the "Renko Assignment Method" drop down named "Part of Price" which calculate the brick size from the current close and divide it by the value in the text box "Value". It is also possible to chose if the zig zag pattern shall use the high/low, the open/close or just the close as the most extreme values in its calculation, you select this in the drop down "Price Source". If you want the price to oscillate around a zero value, enable the "Oscillating" checkbox. TradingView's pine script does currently not support to print non-static text on the chart, so it is not possible at this point to write out the volume on the zig zag chart. It is also not possible to have both an overlay and separate chart pane in the same indicator, therefor this indicator is split up in two. You can find the zig zag indicator here: Pine Script® göstergesimodhelius tarafındanGüncellendi 8989 5.9 K
Tender Zones and Cam Pivots [AK] WiPWork in progress..Pine Script® göstergesiandkii tarafından1818259
Wolfe Waves Signals [NXT2017] by the rules of Bill WolfeScript to find entries of Wolfe Wave Point 5 for Pinescript in Tradingview Dear followers, in my search for a good Wolfe Wave screener I havn't success. This is why I wrote my own script for find good Wolfe Waves entries for Pinescript in Tradingview. The script calculate the relationsship between wave 4 (point 4 to point 5) and wave 3 (point 3 and point 4) in combination with the relationsship of wave 3 and wave 2 (point 2 to point 3). The first relationship should like the rules be 127.2 % and the second relationship 68.2% - but not every pattern join in this rule. This is why I give a little room to move around this values. In one hand the higher the green peak, the longer and stronger the wave for buysetup and on the other hand the lower the red Peak, the longer and stronger the wave for sellsetup. My skills didn't sufficient for show the lines of Wolfe Waves. If you have a modified version with lines with EPA and ETA Points, so please be so Kind to inform me. Of course, not every signal is a good signal, so look to the rules of Bill Wolfe and on a perfect pattern be active. At least I wish everyone a good tradingtime.Pine Script® göstergesiNXT2017 tarafından2020 3.6 K
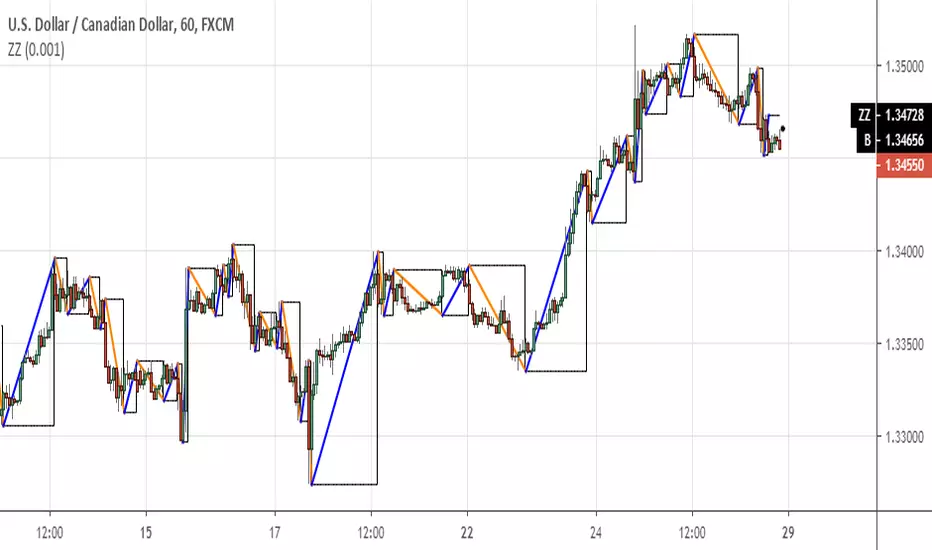
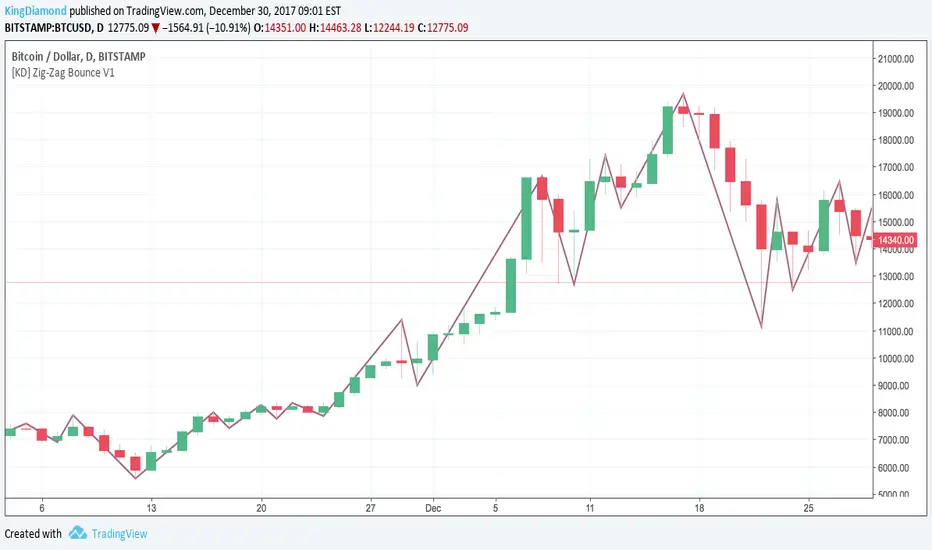
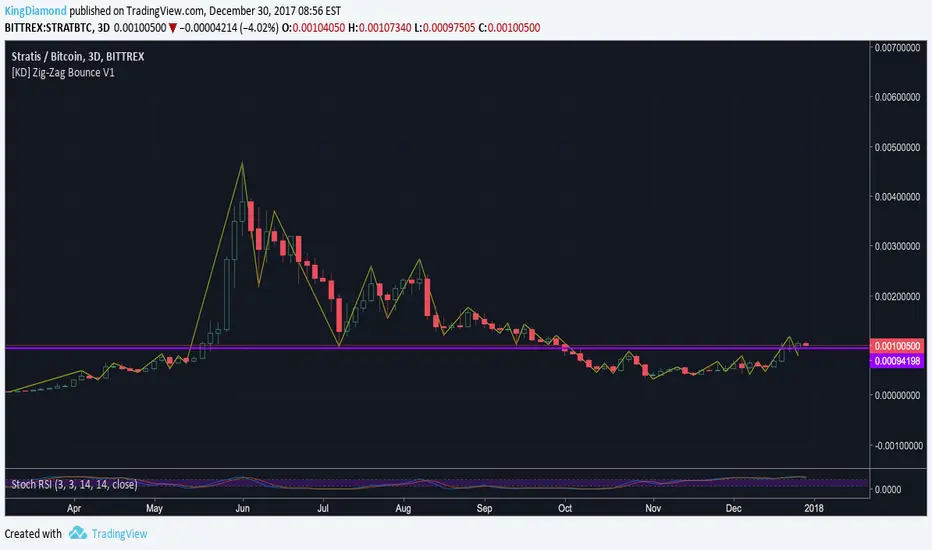
[KD] Zig-Zag Bounce V1Cut through chart noise with Zig-Zag Bounce! Every time the trend bounces, we show you the highs and lows giving you an incredibly clear overview. Makes it much easier to spot where your Elliott Waves should fit :)Pine Script® göstergesiKingDiamond tarafından22486
[KD] Zig-Zag Bounce V1Cut through chart noise with Zig-Zag Bounce! Every time the trend bounces, we show you the highs and lows giving you an incredibly clear overview. Makes it much easier to spot where your Elliott Waves should fit :)Pine Script® göstergesiKingDiamond tarafından22232
Smart Fibonacci with ZigZagSmart Fibonacci with ZigZagPine Script® göstergesiDiZer tarafındanGüncellendi 3939 6.7 K
Fractal Composite Ribbon V2.1Added alerts when L1 fast or L2 med-fast pop out of grey hysteresis state into red or green. These new alerts do not require being in shaded overbought/oversold zones so they're better for catching continuation moves. Thanks to fbatistat for the suggestion. Also exposed the "Cross Hysteresis" parameter for the width of ambiguous grey "slack" before lead lines push into red or green.Pine Script® göstergesipythagoras tarafından55375
Fractal Composites Ribbon (V2)Compresses 8 fractal oscillator timescales into a ribbon of up to 5 composite lines. This is a smoother version of the original Fractal Composite with alerts on reversals in the overbought/oversold zones. Fractal Composites normalize and 'cartoonize' the price chart to fit and bounce between statistically-defined overbought and oversold zones. Each lines resembles the shape of the price wave on a different time/size scale, with some distortion as the size of price movement fluctuates. Conceptually, reaching the overbought/oversold zone corresponds to price reaching a ribbon of Bollinger bands, though our 'band statistics' are much smoother and more mathematically sophisticated than standard Bollinger. Because markets have similar fractal behavior across all timescales, this indicator applies to any timescale, from 1 minute to 1 hour or 1 day. You shouldn't really need to futz with the numerical parameters -- the most important choice is your chart timescale for how fast you want to trade. A faster timescale will show you more dotted reversals in the overbought/oversold zones to trade. The 'Show...' checkboxes let you choose how many composite lines, lag lines, and crosses to see. Information overload? Or a reminder that any single indicator embeds many assumptions about time and price scale in its signal...Pine Script® göstergesipythagoras tarafından1010359