Economic Profit (Fixed & Labeled) — Rated + PeersFRAC (Fundamental-Rated-Asset-Calculate)
FRAC is a fundamentals-driven tool designed to measure whether a company is creating or destroying shareholder value. Unlike surface ratios, FRAC uses Economic Profit (ROIC – WACC) as its engine, showing whether a business truly outperforms its cost of capital.
🔹 What FRAC Does
Calculates ROIC (Return on Invested Capital) vs. WACC (Weighted Average Cost of Capital).
Shows whether a company is creating or destroying shareholder value.
Uses tiered color coding for clarity:
🔵 Superior (Aqua Blue) → Top tier; best of the best.
🟣 Elite (Purple) → Strong value creation.
🟢 Positive (Green) → Solid, creating shareholder value.
🟡 Marginal (Yellow) → Barely covering cost of capital.
🔴 Negative (Red) → Value destruction.
🔹 Composite Ranking System (1–4)
FRAC also assigns each company a Composite Rank so you can compare multiple names side by side. The rank works like this:
Rank 1 → Superior (🔵 Aqua Blue)
Best possible rating; wide gap between ROIC and WACC.
Rank 2 → Elite (🟣 Purple)
Strongly positive; above-average capital efficiency.
Rank 3 → Positive (🟢 Green)
Creating value but only moderately; not a top compounder.
Rank 4 → Marginal/Negative (🟡/🔴)
Weak or destructive; either barely covering WACC or losing money on capital.
✅ How to Use the Ranks
When comparing a set of peers (e.g., NVDA, AMD, INTC):
FRAC will display each company’s color rating + composite rank (1–4).
You can instantly see who is strongest vs. weakest in the group.
Best decisions = overweight Rank 1 & 2 companies, avoid Rank 4 names.
🔹 Key Inputs Explained
Risk-Free Asset → Typically the 10-Year US Treasury yield (US10Y).
Corporate Tax Rate → Effective tax rate for the company’s country (e.g., USCTR).
Expected Market Return → Historical average ~8–10%, adjustable.
Beta Lookback Period → Controls how far back Beta is calculated (longer = more stable, shorter = more reactive).
👉 These must be set correctly for FRAC to calculate WACC accurately.
🔹 Example Comparison
NVDA: ROIC 25% – WACC 7% = +18% → 🔵 Superior → Rank 1
AMD: ROIC 17% – WACC 8% = +9% → 🟣 Elite → Rank 2
INTC: ROIC 11% – WACC 9% = +2% → 🟢 Positive → Rank 3
FSLY: ROIC 5% – WACC 10% = –5% → 🔴 Negative → Rank 4
🔹 Why It Matters
Buffett said: “The best businesses are those that can consistently generate returns on capital above their cost of capital.”
FRAC turns that into a visual + numeric rating system (1–4), making comparisons across peers simple and actionable.
🔹 Credit
FRAC was created by Hunter Hammond (Elite x FineFir), inspired by corporate finance models of Economic Profit and Economic Value Added (EVA).
⚠️ Disclaimer: FRAC is a research framework, not financial advice. Always pair with full due diligence.
WACC

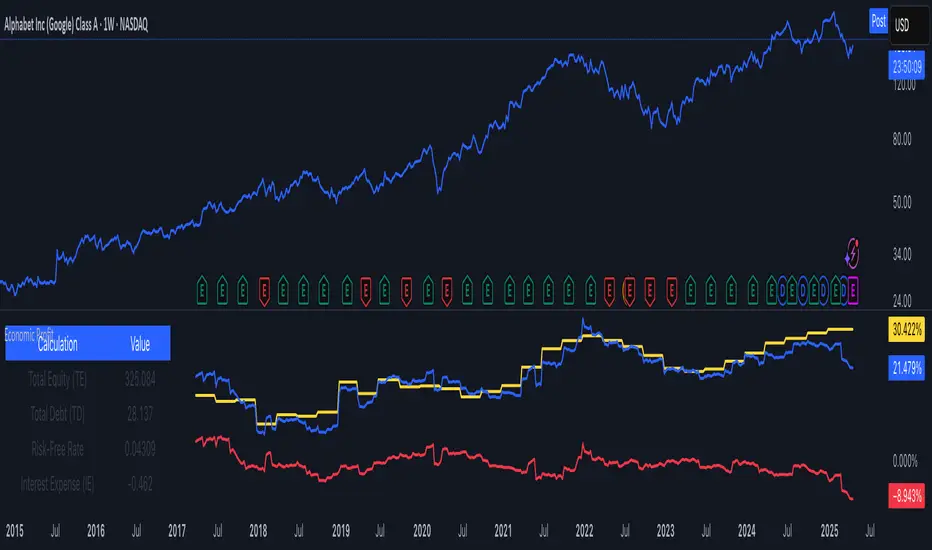
Economic Profit (YavuzAkbay)The Economic Profit Indicator is a Pine Script™ tool for assessing a company’s economic profit based on key financial metrics like Return on Invested Capital (ROIC) and Weighted Average Cost of Capital (WACC). This indicator is designed to give traders a more accurate understanding of risk-adjusted returns.
Features
Customizable inputs for Risk-Free Rate and Corporate Tax Rate assets for people who are trading in other countries.
Calculates Economic Profit based on ROIC and WACC, with values shown as both plots and in an on-screen table.
Provides detailed breakdowns of all key calculations, enabling deeper insights into financial performance.
How to Use
Open the stock to be analyzed. In the settings, enter the risk-free asset (usually a 10-year bond) of the country where the company to be analyzed is located. Then enter the corporate tax of the country (USCTR for the USA, DECTR for Germany). Then enter the average return of the index the stock is in. I prefer 10% (0.10) for the SP500, different rates can be entered for different indices. Finally, the beta of the stock is entered. In future versions I will automatically pull beta and index returns, but in order to publish the indicator a bit earlier, I have left it entirely up to the investor.
How to Interpret
We see 3 pieces of data on the indicator. The dark blue one is ROIC, the dark orange one is WACC and the light blue line represents the difference between WACC and ROIC.
In a scenario where both ROIC and WACC are negative, if ROIC is lower than WACC, the share is at a complete economic loss.
In a scenario where both ROIC and WACC are negative, if ROIC has started to rise above WACC and is moving towards positive, the share is still in an economic loss but tending towards profit.
A scenario where ROIC is positive and WACC is negative is the most natural scenario for a company. In this scenario, we know that the company is doing well by a gradually increasing ROIC and a stable WACC.
In addition, if the ROIC and WACC difference line goes above 0, the company is now economically in net profit. This is the best scenario for a company.
My own investment strategy as a developer of the code is to look for the moment when ROIC is greater than WACC when ROIC and WACC are negative. At that point the stock is the best time to invest.
Trading is risky, and most traders lose money. The indicators Yavuz Akbay offers are for informational and educational purposes only. All content should be considered hypothetical, selected after the facts to demonstrate my product, and not constructed as financial advice. Decisions to buy, sell, hold, or trade in securities, commodities, and other investments involve risk and are best made based on the advice of qualified financial professionals. Past performance does not guarantee future results.
This indicator is experimental and will always remain experimental. The indicator will be updated by Yavuz Akbay according to market conditions.