Casa_VolumeProfileSessionLibrary "Casa_VolumeProfileSession"
Analyzes price and volume during regular trading hours to provide a session volume profile,
including Point of Control (POC), Value Area High (VAH), and Value Area Low (VAL).
Calculates and displays these levels historically and for the developing session.
Offers customizable visualization options for the Value Area, POC, histogram, and labels.
Uses lower timeframe data for increased accuracy and supports futures sessions.
The number of rows used for the volume profile can be fixed or dynamically calculated based on the session's price range and the instrument's minimum tick increment, providing optimal resolution.
calculateEffectiveRows(configuredRows, dayHigh, dayLow)
Determines the optimal number of rows for the volume profile, either using the configured value or calculating dynamically based on price range and tick size
Parameters:
configuredRows (int) : User-specified number of rows (0 means auto-calculate)
dayHigh (float) : Highest price of the session
dayLow (float) : Lowest price of the session
Returns: The number of rows to use for the volume profile
debug(vp, position)
Helper function to write some information about the supplied SVP object to the screen in a table.
Parameters:
vp (Object) : The SVP object to debug
position (string) : The position.* to place the table. Defaults to position.bottom_center
getLowerTimeframe()
Depending on the timeframe of the chart, determines a lower timeframe to grab volume data from for the analysis
Returns: The timeframe string to fetch volume for
get(volumeProfile, lowerTimeframeHigh, lowerTimeframeLow, lowerTimeframeVolume, lowerTimeframeTime, lowerTimeframeSessionIsMarket)
Populated the provided SessionVolumeProfile object with vp data on the session.
Parameters:
volumeProfile (Object) : The SessionVolumeProfile object to populate
lowerTimeframeHigh (array) : The lower timeframe high values
lowerTimeframeLow (array) : The lower timeframe low values
lowerTimeframeVolume (array) : The lower timeframe volume values
lowerTimeframeTime (array) : The lower timeframe time values
lowerTimeframeSessionIsMarket (array) : The lower timeframe session.ismarket values (that are futures-friendly)
drawPriorValueAreas(todaySessionVolumeProfile, extendYesterdayOverToday, showLabels, labelSize, pocColor, pocStyle, pocWidth, vahlColor, vahlStyle, vahlWidth, vaColor)
Given a SessionVolumeProfile Object, will render the historical value areas for that object.
Parameters:
todaySessionVolumeProfile (Object) : The SessionVolumeProfile Object to draw
extendYesterdayOverToday (bool) : Defaults to true
showLabels (bool) : Defaults to true
labelSize (string) : Defaults to size.small
pocColor (color) : Defaults to #e500a4
pocStyle (string) : Defaults to line.style_solid
pocWidth (int) : Defaults to 1
vahlColor (color) : The color of the value area high/low lines. Defaults to #1592e6
vahlStyle (string) : The style of the value area high/low lines. Defaults to line.style_solid
vahlWidth (int) : The width of the value area high/low lines. Defaults to 1
vaColor (color) : The color of the value area background. Defaults to #00bbf911)
drawHistogram(volumeProfile, bgColor, showVolumeOnHistogram)
Given a SessionVolumeProfile object, will render the histogram for that object.
Parameters:
volumeProfile (Object) : The SessionVolumeProfile object to draw
bgColor (color) : The baseline color to use for the histogram. Defaults to #00bbf9
showVolumeOnHistogram (bool) : Show the volume amount on the histogram bars. Defaults to false.
Object
Object Contains all settings and calculated values for a Volume Profile Session analysis
Fields:
numberOfRows (series int) : Number of price levels to divide the range into. If set to 0, auto-calculates based on price range and tick size
valueAreaCoverage (series int) : Percentage of total volume to include in the Value Area (default 70%)
trackDevelopingVa (series bool) : Whether to calculate and display the Value Area as it develops during the session
valueAreaHigh (series float) : Upper boundary of the Value Area - price level containing specified % of volume
pointOfControl (series float) : Price level with the highest volume concentration
valueAreaLow (series float) : Lower boundary of the Value Area
startTime (series int) : Session start time in Unix timestamp format
endTime (series int) : Session end time in Unix timestamp format
dayHigh (series float) : Highest price of the session
dayLow (series float) : Lowest price of the session
step (series float) : Size of each price row (calculated as price range divided by number of rows)
pointOfControlLevel (series int) : Index of the row containing the Point of Control
valueAreaHighLevel (series int) : Index of the row containing the Value Area High
valueAreaLowLevel (series int) : Index of the row containing the Value Area Low
lastTime (series int) : Tracks the most recent timestamp processed
volumeRows (map) : Stores volume data for each price level row (key=row number, value=volume)
ltfSessionHighs (array) : Stores high prices from lower timeframe data
ltfSessionLows (array) : Stores low prices from lower timeframe data
ltfSessionVols (array) : Stores volume data from lower timeframe data
Volumeprofileanalysis

VolumeProfileLibrary "VolumeProfile"
Analyzes volume and price and calculates a volume profile, in particular the Point Of Control and Value Area values.
new(rowSizeInTicks, valueAreaCoverage, startTime)
Constructor method that creates a new Volume Profile
Parameters:
rowSizeInTicks (float) : Internal row size (aka resolution) of the volume profile. Useful for most futures contracts would be '1 / syminfo.mintick'. Default '4'.
valueAreaCoverage (int) : Percentage of total volume that is considered the Value Area. Default '70'
startTime (int) : Start time (unix timestamp in milliseconds) of the Volume Profile. Default 'time'.
Returns: VolumeProfile object
method calculatePOC(vp)
Calculates current Point Of Control of the VP
Namespace types: VolumeProfile
Parameters:
vp (VolumeProfile)
Returns: void
method calculateVA(vp)
Calculates current Value Area High and Low of the VP
Namespace types: VolumeProfile
Parameters:
vp (VolumeProfile)
Returns: void
method update(vp, h, l, v, t)
Processes new chart data and sorts volume into rows. Then calls calculatePOC() and calculateVA() to update the VP. Parameters are usually the output of request.security_lower_tf.
Namespace types: VolumeProfile
Parameters:
vp (VolumeProfile)
h (array) : Array of highs
l (array) : Array of lows
v (array) : Array of volumes
t (array) : Array of candle times
Returns: void
method setSessionHigh(vp, h)
Sets the high of the session the VP is tracking
Namespace types: VolumeProfile
Parameters:
vp (VolumeProfile)
h (float)
Returns: void
method setSessionLow(vp, l)
Sets the low of the session the VP is tracking
Namespace types: VolumeProfile
Parameters:
vp (VolumeProfile)
l (float)
Returns: void
method getPOC(vp)
Gets the current Point Of Control
Namespace types: VolumeProfile
Parameters:
vp (VolumeProfile)
Returns: Point Of Control (float)
method getVAH(vp)
Gets the current Value Area High
Namespace types: VolumeProfile
Parameters:
vp (VolumeProfile)
Returns: Value Area High (float)
method getVAL(vp)
Gets the current Value Area Low
Namespace types: VolumeProfile
Parameters:
vp (VolumeProfile)
Returns: Value Area Low (float)
VolumeProfile
Fields:
rowSizeInTicks (series float)
valueAreaCoverage (series int)
startTime (series int)
valueAreaHigh (series float)
pointOfControl (series float)
valueAreaLow (series float)
sessionHigh (series float)
sessionLow (series float)
volumeByRow (map)
totalVolume (series float)
pocRow (series float)
pocVol (series float)

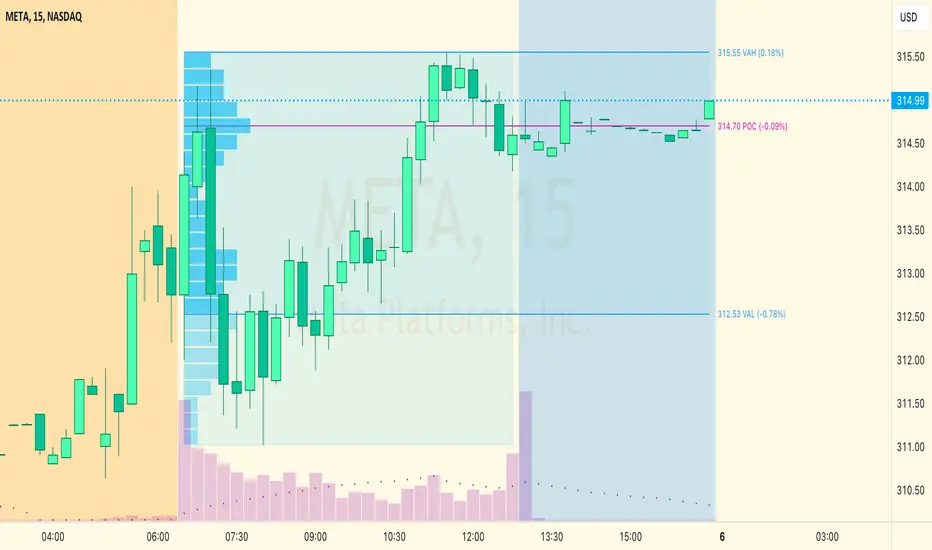
SessionVolumeProfileLibrary "SessionVolumeProfile"
Analyzes price & volume during regular trading hours to provide a session volume profile analysis. The primary goal of this library is to provide the developer with three values: the value area high, low and the point of control. The library also provides methods for rendering the value areas and histograms. To learn more about this library and how you can use it, click on the website link in my profile where you will find a blog post with detailed information.
debug(vp, position)
Helper function to write some information about the supplied SVP object to the screen in a table.
Parameters:
vp (Object) : The SVP object to debug
position (string) : The position.* to place the table. Defaults to position.bottom_center
getLowerTimeframe()
Depending on the timeframe of the chart, determines a lower timeframe to grab volume data from for the analysis
Returns: The timeframe string to fetch volume for
get(volumeProfile, lowerTimeframeHigh, lowerTimeframeLow, lowerTimeframeVolume)
Populated the provided SessionVolumeProfile object with vp data on the session.
Parameters:
volumeProfile (Object) : The SessionVolumeProfile object to populate
lowerTimeframeHigh (float ) : The lower timeframe high values
lowerTimeframeLow (float ) : The lower timeframe low values
lowerTimeframeVolume (float ) : The lower timeframe volume values
drawPriorValueAreas(todaySessionVolumeProfile, extendYesterdayOverToday, showLabels, labelSize, pocColor, pocStyle, pocWidth, vahlColor, vahlStyle, vahlWidth, vaColor)
Given a SessionVolumeProfile Object, will render the historical value areas for that object.
Parameters:
todaySessionVolumeProfile (Object) : The SessionVolumeProfile Object to draw
extendYesterdayOverToday (bool) : Defaults to true
showLabels (bool) : Defaults to true
labelSize (string) : Defaults to size.small
pocColor (color) : Defaults to #e500a4
pocStyle (string) : Defaults to line.style_solid
pocWidth (int) : Defaults to 1
vahlColor (color) : The color of the value area high/low lines. Defaults to #1592e6
vahlStyle (string) : The style of the value area high/low lines. Defaults to line.style_solid
vahlWidth (int) : The width of the value area high/low lines. Defaults to 1
vaColor (color) : The color of the value area background. Defaults to #00bbf911)
drawHistogram(volumeProfile, bgColor, showVolumeOnHistogram)
Given a SessionVolumeProfile object, will render the histogram for that object.
Parameters:
volumeProfile (Object) : The SessionVolumeProfile object to draw
bgColor (color) : The baseline color to use for the histogram. Defaults to #00bbf9
showVolumeOnHistogram (bool) : Show the volume amount on the histogram bars. Defaults to false.
Object
Fields:
numberOfRows (series__integer)
valueAreaCoverage (series__integer)
trackDevelopingVa (series__bool)
valueAreaHigh (series__float)
pointOfControl (series__float)
valueAreaLow (series__float)
startTime (series__integer)
endTime (series__integer)
dayHigh (series__float)
dayLow (series__float)
step (series__float)
pointOfControlLevel (series__integer)
valueAreaHighLevel (series__integer)
valueAreaLowLevel (series__integer)
volumeRows (array__float)
priceLevelRows (array__float)
ltfSessionHighs (array__float)
ltfSessionLows (array__float)
ltfSessionVols (array__float)
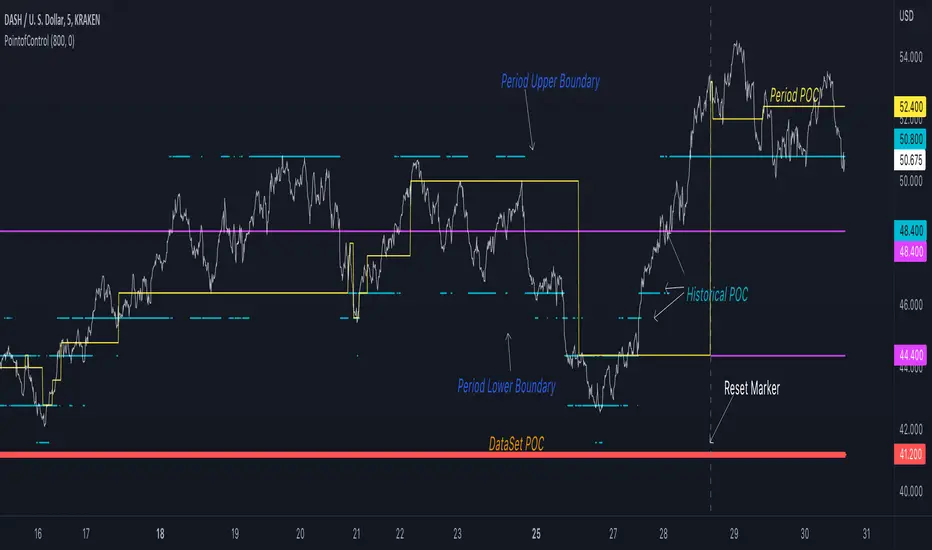
PointofControlLibrary "PointofControl"
POC_f()
The genesis of this project was to create a POC library that would be available to deliver volume profile information via pine to other scripts of indicators and strategies.
This is the indicator version of the library function.
A few things that would be unique with the built in
- it allows you to choose the kind of reset of the period, day/week or bars. This is simple enough to expand to other conditions
- it resets on bar count starting from the beginning of the data set (bar index =0) vs bars back from the end of the data set
- A 'period' in this context is the time between resets - the start of the POC until it resets (for example at the beginning of a new day or week)
- it will calculate an increment level rather than the user specifying ticks or price brackets
- it does not allow for setting the # of rows and then calculating the implied price levels
- When a period is complete it is often useful to look back at the POCs of historical periods, or extend them forward.
- This script will find the historical POCs around the current price and display them rather than extend all the historical POC lines to the right
- This script also looks across all the period POCs and identifies the master POC or what I call the Grand POC, and also the next 3 runner up POCs
There is a matching indicator to this library