Volume HeatMap Divergence [BigBeluga]🔵 OVERVIEW
The Volume HeatMap Divergence is a smart volume visualization tool that overlays normalized volume data directly on the chart. Using a color heatmap from aqua to red, it transforms raw volume into an intuitive scale — highlighting areas of weak to intense market participation. Additionally, it detects volume-based divergences from price to signal potential reversals or exhaustion zones. Combined with clear visual labeling, this tool empowers traders with actionable volume insights.
🔵 CONCEPTS
Normalized Volume Heatmap : Volume is normalized to a 0–100% scale and visually represented as candles below the chart.
float vol = volume / ta.percentile_nearest_rank(volume, 1000, 100) * 100
Bar Coloring : Price candles are dynamically colored based on volume intensity.
Volume Divergence Logic :
Bullish Divergence : Price forms a lower low, but volume forms a higher low.
Bearish Divergence : Price forms a higher high, but volume forms a lower high.
Dynamic Detection Range : Customizable range ensures divergence signals are meaningful and not random.
Volume Labels : Additional info on divergence bars shows both the actual volume and its normalized % score.
🔵 FEATURES
Volume Heatmap Plot : Normalized volume values colored using a smooth gradient from aqua (low) to red (high).
Price Bar Coloring : Candlesticks on the main chart adopt the same heatmap color based on volume.
Divergence Detection :
Bullish divergence with label and low marker
Bearish divergence with label and high marker
Dual Divergence Labels :
On the volume plot : Direction (Bull/Bear), raw volume, and normalized %
On the price chart : Shape labels showing "Bull" or "Bear" at local highs/lows
Custom Inputs :
Divergence range (min & max), pivot detection distance (left/right)
Toggle to show/hide divergence labels, volume, and % text
Clear Bull/Bear Coloring : Fully customizable label and line colors for both bullish and bearish signals.
🔵 HOW TO USE
Use the indicator as an overlay to monitor real-time volume strength using the heatmap color.
Watch for divergence markers:
Bullish divergence: Candle shows higher volume while price makes a new low
Bearish divergence: Candle shows lower volume while price makes a new high
Use the volume info labels to verify the context of divergence:
Actual volume at divergence candle
Normalized % of that volume compared to past 1000 bars
Adjust pivot sensitivity using "Pivot Left" and "Pivot Right" to tune signal frequency and lag with a right pivot length.
Use divergence zones as early warnings for potential reversals or trend shifts.
Disable or customize labels in settings depending on your charting preferences.
🔵 CONCLUSION
Volume HeatMap Divergence merges heatmap-style volume visualization with intelligent divergence detection — giving traders a clean yet powerful edge. By revealing hidden disconnections between price and participation, it helps users spot exhaustion moves or hidden accumulation zones before the market reacts. Whether you’re a scalper, swing trader, or intraday strategist, this tool offers real-time clarity on who’s in control behind the candles.
Volumedivergence

Ectopic Bar by Moti RakamEctopic Bar is an indicator that highlights a pin-bar candle that has divergence in it's shape and volume delta. To find volume delta, code of standard Up/Down volume indicator has been used.
PIN BAR : pin bar are marked by using Close Range option parameter. Default value is set to 0.35 which implies any candle that closes in the 35% of its high/low will be considered a pin bar (of course the code also ensures that rest of the bar body is only a wick).
HOW IT WORKS:
Up/Down volume variables "Up Volume" and "Down Volume" are checked against the shape of the pin bar to find an ectopic situation. For example, if a bullish pin bar candle (a bullish hammer) has more sell volume than buy volume, that's an ectopic situation. The bullish hammer shows a buying push from the bottom of the wick, instead the up/down volume indicator shows there were more sell orders than buy orders. Hence the ectopic situation. Similarly, an inverted hammer (a bearish hammer) in general should have more sell volume, but instead if it has more buying volume, the indicator highlights it as an ectopic bar.
Ectopic Bars are painted in yellow colour.

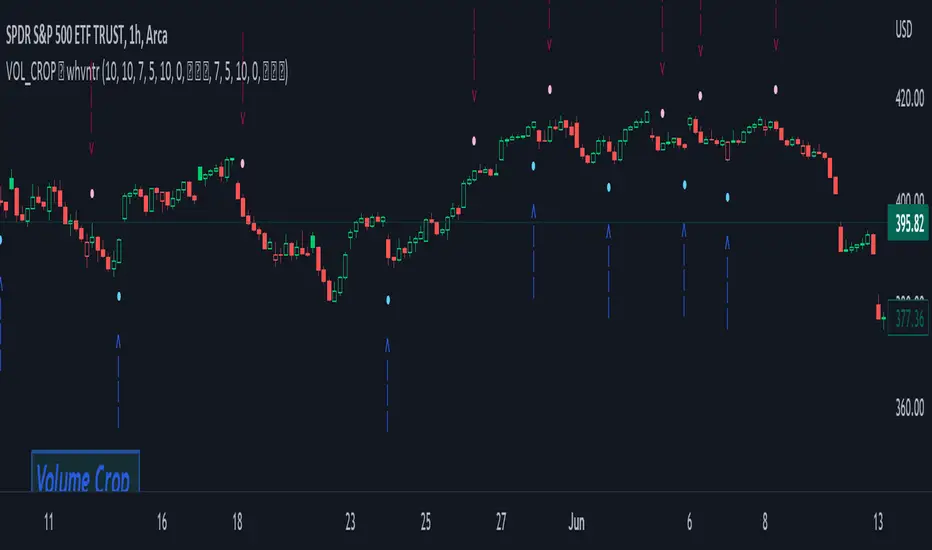
Volume Cross ━ (For Volume Crop) [whvntr]This fulfills a request from user: iTibu to make an oscillator to go along with one of my indicators named: " Volume Crop ━ Hidden Volume Divergence ". It essentially does the same thing, without the Midline Tool , so you can better understand where the crosses are happening. Again, the hidden MACD Divergence circles formula originated from TheLark. I converted these values to volume instead of price.
Disclaimer: using this indicator, or any indicator anywhere, involves risk when trading and isn't a guarantee of 100% accurate results.

Volume Crop ━ Hidden Volume Divergence [whvntr] Volume Divergence
• Formula originated from: "Hidden Price Divergence" (circles) by TheLark. I did two things to harness its
effectiveness:
• Firstly, I developed a unique way to filter out the divergence signals that were appearing on both sides of the
midline. This filter will be known as the "Midline Tool" . It filters out a lot of the false signals commonly
associated with oscillators.
• Then, I modified the default format from Price to Volume.
• The midline formula "Midline Tool" was developed by me . It adjusts in the thousands since it's volume.
Let me know in the comments if you would rater have a smaller step value than 10,000. How does it work?
Crossover then Crossunder, the arrows only appear during the first sign of hidden volume divergence once
crossing the midline. Normally, these signs appear on both side of the midline both bearish and bullish no
matter if it's on an oversold or overbought side of the spectrum... Also, let
me know in the comments if you would like for me to release an oscillator version of this
indicator for co-witnessing.
Features:
• Volume divergence
• Midline Tool©
• Disclaimer: This indicator does not constitute investment advice. Trade at your own risk with the investments
you can afford to lose because all financial investments have risks and this is not a
guarantee that the volume divergence will be 100% all the time.
OBV with Volume/Momentum DivergenceCredits go to vyperphi696 and LazyBear for the original OBV with Divergence script.
This indicator has the new option to check for momentum divergence, which I have done by adding RSI and MACD data.
Hence the indicator allows combined testing of volume and momentum divergence. This feature aims to improve trend reversal detection by reducing false positives.
In summary, 3 divergence categories are shown by default as lines:
Volume + RSI + MACD (dark green/red)
Volume + RSI / Volume + MACD (light green/red)
Volume (gray)
Line colors can be adjusted via plot settings. Therefore it is also possible to distinguish Volume + RSI and Volume + MACD divergence if necessary.
Lastly, I edited the indicator scaling mechanism when changing from one timeframe to another; the transitions are smoother now. This only applies when auto-scaling is off.
