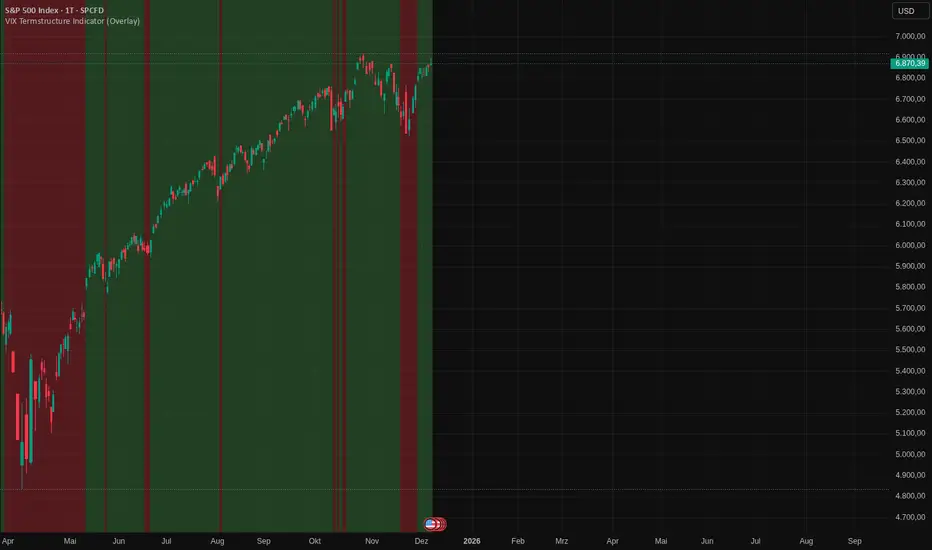
VIX Termstructure Indicator (Overlay)This indicator visualizes the VIX futures term structure directly on your chart background and highlights three key volatility regimes using color coding. It helps identify when the volatility curve is in normal contango, inverted (backwardation), or undergoing a curve flip between the front-month VIX futures.
What the indicator does
The script pulls and compares:
VIX spot index: VIX
Front-month VIX futures: VX1!
Second-month VIX futures: VX2!
All data is requested on the daily timeframe and used to classify the current volatility environment. The indicator then colors the background of your chart according to the detected VIX term structure:
Green background – Contango:
VIX spot is below the front-month futures (VIX < VX1!).
This is typically associated with more “normal” market conditions and lower perceived short-term stress.
Red background – Inverted curve (Backwardation):
VIX spot is above the front-month futures (VIX > VX1!).
This often signals elevated fear, stress, or risk-off conditions in the market.
Yellow background – Curve flip between VX1! and VX2!:
The front-month futures are trading above the second-month futures (VX1! > VX2!).
This can indicate a transition phase in the volatility term structure and may precede or accompany shifts in market sentiment.
How it works
The script fetches the daily close values of VIX, VX1!, and VX2!. It checks whether the front-month futures are above the second-month futures to detect a curve flip. It compares VIX with VX1! to determine if the curve is contango or inverted. Based on these conditions, the chart background is colored with a semi-transparent overlay:
Red has priority when VIX is above VX1! (inverted curve).
If not inverted, yellow is shown when a curve flip VX1! > VX2! is detected.
Otherwise, the background is green (normal contango).
Use cases
This overlay is designed as a context tool for indices, ETFs, Options, or individual stocks that are sensitive to volatility and risk sentiment. Typical applications include:
Identifying periods of heightened risk (red / inverted curve) to adjust position sizing or risk exposure.
Confirming risk-on environments (green / contango) where volatility is more contained.
Monitoring yellow curve-flip phases as potential early warnings of changing volatility regimes.
The indicator does not generate buy/sell signals on its own, but it can be a valuable regime filter or confirmation layer alongside other technical tools.
Notes
This is an overlay indicator: it colors the background of your active chart.
All VIX-related data is evaluated on the daily timeframe, regardless of the chart timeframe.
Make sure that the symbols VIX, VX1!, and VX2! are available on your broker/data feed in TradingView.
Vixfutures
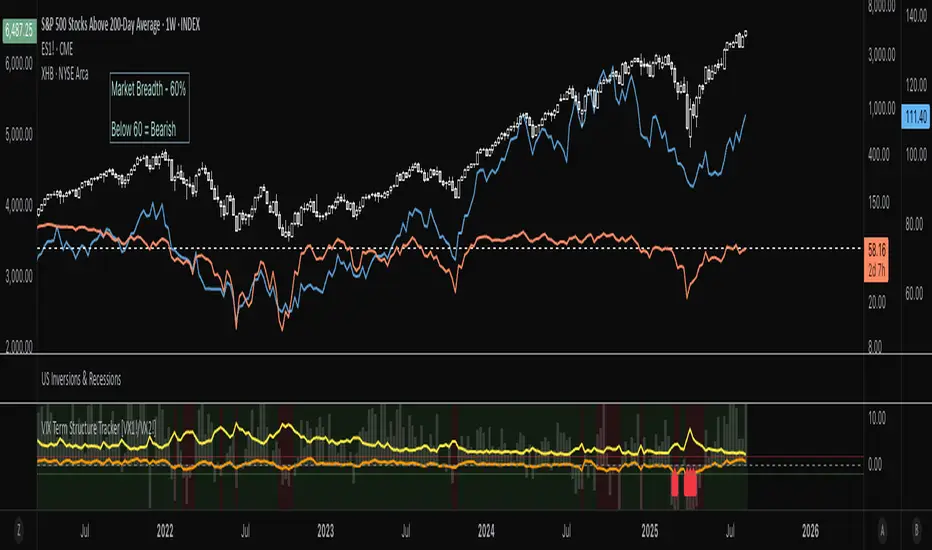
VIX Term Structure Tracker [VX1!/VX2!]1. Data Preparation
The script starts by fetching four key data series on a daily ("D") timeframe:
VIX (CBOE:VIX): The spot VIX index, a real-time measure of market expectations of future volatility.
VX1! (CBOE:VX1!): The price of the front-month (nearest to expiration) VIX futures contract.
VX2! (CBOE:VX2!): The price of the next-month VIX futures contract.
SPX (SP:SPX): The S&P 500 Index, which serves as a benchmark for the overall market.
2. Term Structure and Market Psychology
The core of the indicator lies in analyzing the relationship between the futures prices.
term_slope = vx2 - vx1: This calculates the difference between the next-month and front-month VIX futures prices.
Contango: If vx2 > vx1, the slope is positive, and the market is in contango. This is the "normal" state, where traders expect volatility to be lower in the future. The script colors this background a light green.
Backwardation: If vx2 < vx1, the slope is negative, and the market is in backwardation. This is a rare state indicating elevated fear. It means traders are willing to pay a premium for short-term protection against volatility, implying that an increase in fear is imminent. The script colors this background a light red.
3. Roll Yield Calculation
roll_yield = ((vx1 - vix) / days_to_expiry) * 100: This calculates the estimated return (or loss) from rolling a futures position from the spot VIX to the front-month future. This is a key metric for understanding the cost of holding VIX futures. A negative roll yield means it is expensive to hold a long VIX position.
4. Equilibrium and Z-Score
This section of the code provides a statistical measure to determine how extreme the current term structure is compared to its historical average.
avg_slope = ta.sma(term_slope, 252): This calculates the one-year simple moving average of the term structure slope.
z_score: This is the most powerful part of the indicator. It measures how many standard deviations the current term_slope is from its one-year average.
A Z-score of +2 or higher indicates the market is in an extreme state of contango (complacency), where volatility is abnormally low.
A Z-score of -2 or lower indicates an extreme state of backwardation (fear), where there's an abnormal surge in short-term volatility expectations.
5. Visualizations & Signals
The script presents a comprehensive view of these metrics on the chart.
plot(term_slope): Shows a blue line representing the VIX term structure slope.
bgcolor(...): Visually highlights periods of contango (light green) and backwardation (light red).
plot(roll_yield): Displays a column chart showing the roll yield, indicating the cost or benefit of holding VIX futures.
plot(z_score): Shows an orange line representing the Z-score, with horizontal lines at +2 and -2 to highlight extreme conditions.
plotshape(...): These are your trading signals. A red arrow pointing up (shape.labelup) appears at the bottom of the chart when the Z-score drops below -2 (extreme backwardation), and a green arrow pointing down (shape.labeldown) appears at the top when the Z-score goes above +2 (extreme contango).
6. Interpretation and Trading Signals
The script provides a clear framework for interpreting market sentiment:
Extreme Backwardation Signal (Red Arrow Up): When the Z-score falls to -2 or below, it signals a period of extreme market fear. This is often an excellent contrarian signal for buying the VIX (or related products) and/or for caution in long equity positions.
Extreme Contango Signal (Green Arrow Down): When the Z-score rises to +2 or above, it signals a period of extreme market complacency. This can be a contrarian signal for selling the VIX (or related products) and/or for potential short-term weakness in the S&P 500.
The VIX/SPX Risk Ratio also provides a good visual of volatility relative to the S&P 500, with an increasing ratio signaling a rising risk environment.
Ultimately, this indicator provides a powerful way to visualize the VIX futures term structure and use statistical analysis (Z-score) to find high-probability signals of extreme market sentiment.
Options Volatility Strategy Analyzer [TradeDots]The Options Volatility Strategy Analyzer is a specialized tool designed to help traders assess market conditions through a detailed examination of historical volatility, market benchmarks, and percentile-based thresholds. By integrating multiple volatility metrics (including VIX and VIX9D) with color-coded regime detection, the script provides users with clear, actionable insights for selecting appropriate options strategies.
📝 HOW IT WORKS
1. Historical Volatility & Percentile Calculations
Annualized Historical Volatility (HV): The script automatically computes the asset’s historical volatility using log returns over a user-defined period. It then annualizes these values based on the chart’s timeframe, helping you understand the asset’s typical volatility profile.
Dynamic Percentile Ranks: To gauge where the current volatility level stands relative to past behavior, historical volatility values are compared against short, medium, and long lookback periods. Tracking these percentile ranks allows you to quickly see if volatility is high or low compared to historical norms.
2. Multi-Market Benchmark Comparison
VIX and VIX9D Integration: The script tracks market volatility through the VIX and VIX9D indices, comparing them to the asset’s historical volatility. This reveals whether the asset’s volatility is outpacing, lagging, or remaining in sync with broader market volatility conditions.
Market Context Analysis: A built-in term-structure check can detect market stress or relative calm by measuring how VIX compares to shorter-dated volatility (VIX9D). This helps you decide if the present environment is risk-prone or relatively stable.
3. Volatility Regime Detection
Color-Coded Background: The analyzer assigns a volatility regime (e.g., “High Asset Vol,” “Low Asset Vol,” “Outpacing Market,” etc.) based on current historical volatility percentile levels and asset vs. market ratios. A color-coded background highlights the regime, enabling traders to quickly interpret the market’s mood.
Alerts on Regime Changes & Spikes: Automated alerts warn you about any significant expansions or contractions in volatility, allowing you to react swiftly in changing conditions.
4. Strategy Forecast Table
Real-Time Strategy Suggestions: At the close of each bar, an on-chart table generates suggested options strategies (e.g., selling premium in high volatility or buying premium in low volatility). These suggestions provide a quick summary of potential tactics suited to the current regime.
Contextual Market Data: The table also displays key statistics, such as VIX levels, asset historical volatility percentile, or ratio comparisons, helping you confirm whether volatility conditions warrant more conservative or more aggressive strategies.
🛠️ HOW TO USE
1. Select Your Timeframe: The script supports multiple timeframes. For short-term trading, intraday charts often reveal faster shifts in volatility. For swing or position trading, daily or weekly charts may be more stable and produce fewer false signals.
2. Check the Volatility Regime: Observe the background color and on-chart labels to identify the current regime (e.g., “HIGH ASSET VOL,” “LOW VOL + LAGGING,” etc.).
3. Review the Forecast Table: The table suggests strategy ideas (e.g., iron condors, long straddles, ratio spreads) depending on whether volatility is elevated, subdued, or spiking. Use these as a starting point for designing trades that match your risk tolerance.
4. Combine with Additional Analysis: For optimal results, confirm signals with your broader trading plan, technical tools (moving averages, price action), and fundamental research. This script is most effective when viewed as one component in a comprehensive decision-making process.
❗️LIMITATIONS
Directional Neutrality: This indicator analyzes volatility environments but does not predict price direction (up/down). Traders must combine with directional analysis for complete strategy selection.
Late or Missed Signals: Since all calculations require a bar to close, sharp intrabar volatility moves may not appear in real-time.
False Positives in Choppy Markets: Rapid changes in percentile ranks or VIX movements can generate conflicting or premature regime shifts.
Data Sensitivity: Accuracy depends on the availability and stability of volatility data. Significant gaps or unusual market conditions may skew results.
Market Correlation Assumptions: The system assumes assets generally correlate with S&P 500 volatility patterns. May be less effective for:
Small-cap stocks with unique volatility drivers
International stocks with different market dynamics
Sector-specific events disconnected from broad market
Cryptocurrency-related assets with independent volatility patterns
RISK DISCLAIMER
Options trading involves substantial risk and is not suitable for all investors. Options strategies can result in significant losses, including the total loss of premium paid. The complexity of options strategies requires thorough understanding of the risks involved.
This indicator provides volatility analysis for educational and informational purposes only and should not be considered as investment advice. Past volatility patterns do not guarantee future performance. Market conditions can change rapidly, and volatility regimes may shift without warning.
No trading system can guarantee profits, and all trading involves the risk of loss. The indicator's regime classifications and strategy suggestions should be used as part of a comprehensive trading plan that includes proper risk management, directional analysis, and consideration of broader market conditions.

VIX Futures Spread StrategyThis script was an exercise in learning Pinescript and exploring the futures curve of the VIX in relation to SPY. Was deleted by TV, trying to republish it now with updated parameters for slippage and commission and a more detailed description.
"VIX Futures Spread Strategy" is a trading strategy that capitalizes on the spread between the 3-month VIX futures (VIX3M) and the spot VIX index. This strategy is based on the idea that the VIX futures spread can serve as a contrarian indicator of market sentiment, with extreme negative spreads potentially signaling oversold conditions and opportunities for long positions.
Ordinarily the VIX curve is in contango as futures contracts are priced at a premium to the current spot price and are used to hedge future uncertainty in the market. When the spot price of VIX spikes the curve can invert and enter backwardation; this strategy detects this condition and uses it as a trigger to open a long position in SPY. The spread going negative tends to correlate with excessive fear and uncertainty in the short term while expecting lower volatility in the long term, in this case 3 months out.
The strategy is designed to enter a long position when the VIX futures spread is negative and to exit the position when the spread rises above 3 -- when the curve is in contango again. The strategy employs a pyramiding approach, allowing up to 10 additional orders to be placed while the entry condition is met, with each order consisting of 10 contracts. This approach aims to maximize potential profits during periods of favorable market conditions.
In this strategy, the VIX futures spread is calculated as the difference between the 3-month VIX futures (VIX3M) and the spot VIX index. The spread is plotted as a histogram on the chart, with the zero line representing no spread, and horizontal lines at 0 and 3 indicating the entry and exit thresholds, respectively.
The strategy's backtesting settings use an initial capital of HKEX:10 ,000, a commission of 0.5% per trade, and a maximum of 10 pyramiding orders, and a slippage of 2 ticks.
Please note that this strategy is intended for educational purposes and should not be considered as financial advice. Before using this strategy in live trading, make sure to thoroughly test and optimize its parameters to suit your risk tolerance and specific trading conditions.

Dealar VIX Implied Range + Retracement LevelsThis Implied range Is derived by the VIX(1 sd annual +/- Implied move.)
This Indicator plots the daily Implied range, A lot of quantitative trading firms/ MM firms hedge their delta & gamma exposure around the Implied range(prop calc). I have added retracement levels as well, so you have more pivot levels.
Enjoy!

VIX Volatility Trend Analysis With Signals - Stocks OnlyVIX VOLATILITY TREND ANALYSIS CLOUD WITH BULLISH & BEARISH SIGNALS - STOCKS ONLY
This indicator is a visual aid that shows you the bullish or bearish trend of VIX market volatility so you can see the VIX trend without switching charts. When volatility goes up, most stocks go down and vice versa. When the cloud turns green, it is a bullish sign. When the cloud turns red, it is a bearish sign.
This indicator is meant for stocks with a lot of price action and volatility, so for best results, use it on charts that move similar to the S&P 500 or other similar charts.
This indicator uses real time data from the stock market overall, so it should only be used on stocks and will only give a few signals during after hours. It does work ok for crypto, but will not give signals when the US stock market is closed.
**HOW TO USE**
When the VIX Volatility Index trend changes direction, it will give a green or red line on the chart depending on which way the VIX is now trending. The cloud will also change color depending on which way the VIX is trending. Use this to determine overall market volatility and place trades in the direction that the indicator is showing. Do not use this by itself as sometimes markets won’t react perfectly to the overall market volatility. It should only be used as a secondary confirmation in your trading/trend analysis.
For more signals with earlier entries, go into settings and reduce the number. 10-100 is best for scalping. For less signals with later entries, change the number to a higher value. Use 100-500 for swing trades. Can go higher for long swing trades. Our favorite settings are 20, 60, 100, 500 and 1000.
***MARKETS***
This indicator should only be used on the US stock markets as signals are given based on the VIX volatility index which measures volatility of the US Stock Markets.
***TIMEFRAMES***
This indicator works on all time frames, but after hours will not change much at all due to the markets being closed.
**INVERSE CHARTS**
If you are using this on an inverse ETF and the signals are showing backwards, please comment with what chart it is and I will configure the indicator to give the correct signals. I have included over 50 inverse ETFs into the code to show the correct signals on inverse charts, but I'm sure there are some that I have missed so feel free to let me know and I will update the script with the requested tickers.
***TIPS***
Try using numerous indicators of ours on your chart so you can instantly see the bullish or bearish trend of multiple indicators in real time without having to analyze the data. Some of our favorites are our Auto Fibonacci, Directional Movement Index, Volume Profile with buy & sell pressure, Auto Support And Resistance, Vix Scalper and Money Flow Index in combination with this Vix Trend Analysis. They all have real time Bullish and Bearish labels as well so you can immediately understand each indicator's trend.

VIX Near-Term Futures CurveThis indicator provides a 3 day smoothed histogram expressing whether the near term VIX futures curve is in a state of contango or backwardation. The solid red/green bars express the spot vs front-month vs next month curve with the value being the cumulative point spread between them. The shaded overlay bars express the spread between the VIX spot index and front-month futures contract only.
This indicator is to be used on a 1 DAY interval or higher.

VIX futures Backwardation/Contango strategyVery basic strategy that goes long on a VIX ETF whenever the futures curve shows signs of backwardation and gets out when it shows signs of contango. Makes no effort whatsoever to avoid getting faked out by monthly futures rollover.
Surprisingly good at not incinerating money while still providing diversification benefits in a long SPY portfolio. Useful for demonstrating the benefits of including VIX futures to hedge an actively managed portfolio.
Can be set to get out if the VIX goes below the lowest value of the last 3 candles, in which case it spends less time in the market but seems to actually make a bit of money over the past decade, though the only intent of this script is to make it not lose money.
