Dynamic Price ChannelsThis indicator plots dynamic price channels based on the security highest close and lowest open.
The default is to display 8 core channels (with the option to plot the sub channel lines, off by default).
It’s simple really—this just divides the price action into equal channels. I’ve found this pattern helpful across all markets.
It’s dynamic because if a new high close or a new low close is created the all channels will adjust.
The key levels are 75% (blue), 50% (aqua), 25% (blue).
In between those key levels is a level separator.
The high close and the low open are both red.
These can all be customized in the settings.
What you’ll typically see at these channel boundaries are price slow downs, reversals, support and resistance.
Turning on sub-channels will provide further channel plots. On these sub-channels you’ll also see the same type of price action activity as mentioned above.
I’ve developed a trading system where this indicator helps identify key pivot areas. Combined with a few other indicators and key EMAs this trade system provides high probability trades around these key channel areas.
Valuechannel

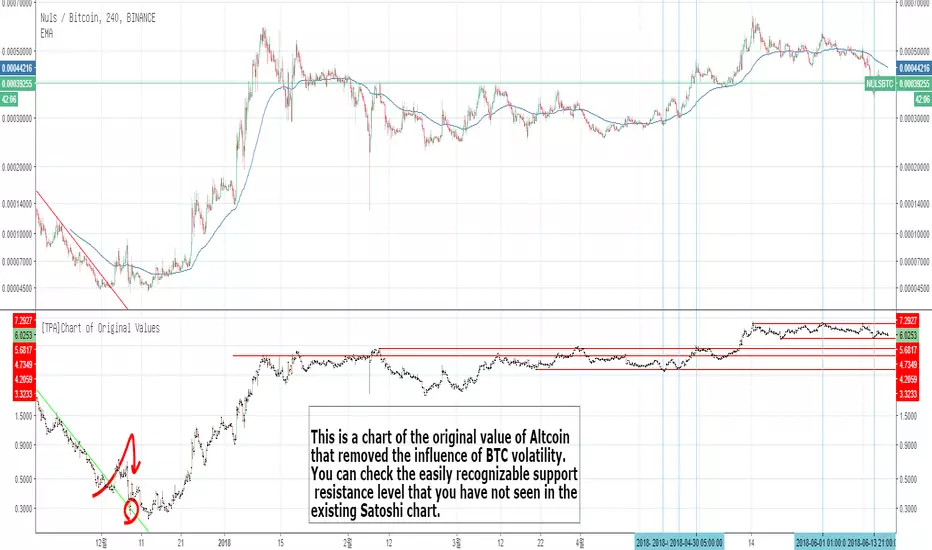
[TPA]Chart of Original Values
This is a chart of the original value of Altcoin that removed the influence of BTC volatility.
You can check the easily recognizable support resistance level that you have not seen in the existing Satoshi chart.
Only for satoshi chart.
//
BTC 변동성의 영향력을 제거한 알트코인의 본래 가치를 구현한 차트입니다.
기존 사토시 차트에서는 보지 못했던 쉽게 알아볼 수 있는 지지 저항 레벨을 체크할수있습니다.
Only for satoshi chart.