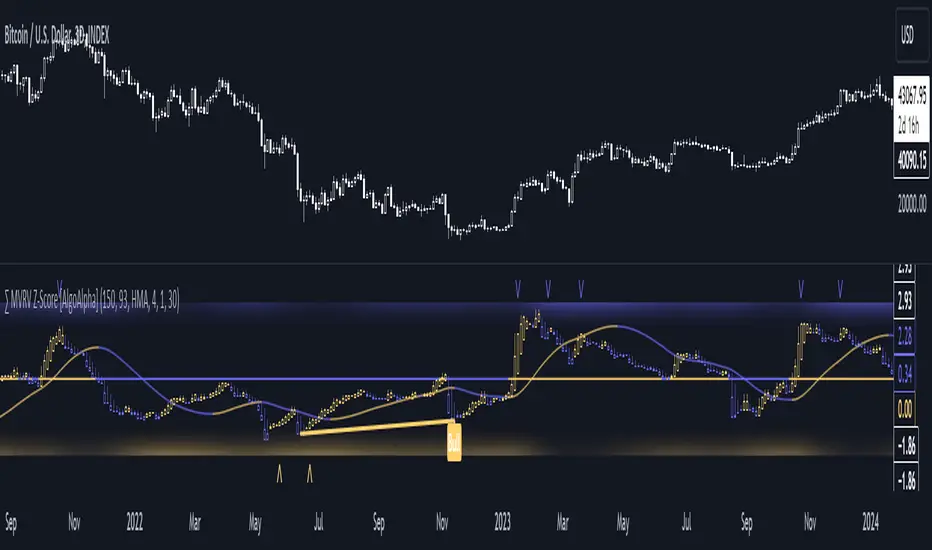
MVRV Z-Score [AlgoAlpha]Introducing the ∑ MVRV Z-Score by AlgoAlpha, a dynamic and sophisticated tool designed for traders seeking to gain an edge in INDEX:BTCUSD analysis. This script employs advanced statistical techniques on Bitcoin On-Chain data to offer a deeper understanding of market conditions, focusing on valuation extremes and momentum trends. Let's explore the features and functionalities that make this tool a valuable addition to your trading arsenal.
Key Features:
🔶 Adjustable Parameters: Customize the Z score lookback length, moving average lookback length, and choose from six moving average types, tailoring the analysis to your trading style.
🔶 Heiken Ashi Compatibility: Incorporate Heiken Ashi plots to visualize market trends, adding a layer of clarity to your technical analysis.
🔶 Divergence Alerts: Detect significant bullish and bearish divergences, allowing for timely identification of potential market reversals.
🔶 Configurable Alerts: Set alerts for overbought, oversold, and divergence conditions, ensuring you never miss an opportunity.
How to Use:
1. ➡️ Parameter Selection: Start by configuring the Z-Score and moving average settings according to your analysis needs. This includes selecting the lookback period and the type of moving average.
2. ➡️ Visualization Options: Choose to enable Heiken Ashi plots for an alternative view of the Z-Score, which can help in identifying trend directions more clearly.
3. ➡️ Monitor for Signals: Keep an eye out for divergence signals and overbought/oversold conditions as potential indicators for entering or exiting trades.
4. ➡️ Alert Setup: Configure alerts based on your selected parameters to receive notifications for important market movements and conditions.
How It Works:
The core of this tool is the Z-Score calculation, which assesses the standard deviation of the current market value from its mean, highlighting overvalued or undervalued market conditions. Here's a brief overview of the script's operational mechanics:
1. 📊 Calculating the Z-Score: The script first calculates the mean over a user-defined lookback period of the MVRV ratio, then it computes the Z-Score to identify deviations from the average.
meanValue = ta.sma(marketValue, zScoreLookback)
zScoreValue = (marketValue - meanValue) / ta.stdev(marketValue, zScoreLookback)
2. 📈 Applying a Moving Average: To smooth the Z-Score data and make trends more discernible, a moving average is applied. Users can choose from several types, such as SMA, EMA, or HMA, based on their preference.
3. 🔄 Heiken Ashi Visualization: For those opting for a more intuitive trend analysis, Heiken Ashi plots can be enabled, transforming the Z-Score data into candlestick charts that simplify trend identification.
4. 🔍 Identifying Divergences: The script is equipped to spot divergences between the market price action and the Z-Score, signaling potential bullish or bearish market reversals.
oscHigherLow = haClose > ta.valuewhen(findPivotLow, haClose , 1) and isInRange(findPivotLow )
priceLowerLow = low < ta.valuewhen(findPivotLow, low , 1)
bullishCondition = enablePlotBullish and priceLowerLow and oscHigherLow and findPivotLow
5. 🚨 Configurable Alerts: Lastly, the script allows for the setting of customizable alerts based on the Z-Score, moving averages, and identified divergences, enabling traders to react promptly to market changes.
The ∑ MVRV Z-Score by AlgoAlpha is an essential tool for traders looking to analyze and interpret market dynamics through a quantitatively rigorous lens. Whether you're focused on identifying market extremes or tracking trend momentum, this script offers the insights needed to support informed trading decisions. 🌟📊💡
Valuation
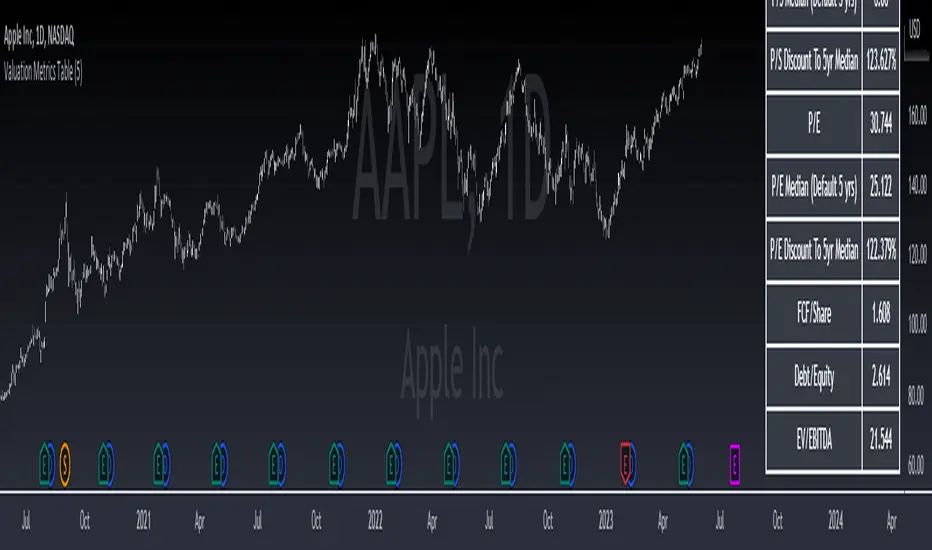
Valuation Metrics Table (P/S, P/E, etc.)This table gives the user a very easy way of seeing many valuation metrics. I also included the 5 year median of the price to sales and price to earnings ratios. Then I calculated the percent difference between the median and the current ratio. This gives a sense of whether or not a stock is over valued or under valued based on historical data. The other ratios are well known and don't require any explanation. You can turn off the ones you don't want in the settings of the indicator. Another thing to mention is that diluted EPS is used in calculations
Rolling Risk-Adjusted Performance RatiosThis simple indicator calculates and provides insights into different performance metrics of an asset - Sharpe, Sortino and Omega Ratios in particular. It allows users to customize the lookback period and select their preferred data source for evaluation of an asset.
Sharpe Ratio:
The Sharpe Ratio measures the risk-adjusted return of an asset by considering both the average return and the volatility or riskiness of the investment. A higher Sharpe Ratio indicates better risk-adjusted performance. It allows investors to compare different assets or portfolios and assess whether the returns adequately compensate for the associated risks. A higher Sharpe Ratio implies that the asset generates more return per unit of risk taken.
Sortino Ratio:
The Sortino Ratio is a variation of the Sharpe Ratio that focuses specifically on the downside risk or volatility of an asset. It takes into account only the negative deviations from the average return (downside deviation). By considering downside risk, the Sortino Ratio provides a more refined measure of risk-adjusted performance, particularly for investors who are more concerned with minimizing losses. A higher Sortino Ratio suggests that the asset has superior risk-adjusted returns when considering downside volatility.
Omega Ratio:
The Omega Ratio measures the probability-weighted ratio of gains to losses beyond a certain threshold or target return. It assesses the skewed nature of an asset's returns by differentiating between positive and negative returns and assigning more weight to extreme gains or losses. The Omega Ratio provides insights into the potential asymmetry of returns, highlighting the potential for significant positive or negative outliers. A higher Omega Ratio indicates a higher probability of achieving large positive returns compared to large negative returns.
Utility:
Performance Evaluation: Provides assessment of an asset's performance, considering both returns and risk factors.
Risk Comparison: Allows for comparing the risk-adjusted returns of different assets or portfolios. Helps identify investments with better risk-reward trade-offs.
Risk Management: Assists in managing risk exposure by evaluating downside risks and volatility.

Index Value RainbowThis indicator is used to estimate Index valuation based on each countries base money supply M0. The chart will compare how the index value will move alongside with base money supply for comparison study. The chart presented here is just a relative comparison with some scaling and shifting so it doesn't refers to any real measurement. However it can be used to track the index whether it's too cheap or too expensive in relative to money supply available in the market.
- The gray line represent the money supply M0
- The rainbow above the gray line represent the multiplication factors from 1x, 2x, ..., 10x
- The rainbow below the gray line represent the division factors from 0.8x, 0.6x, ..., 0.2x
This indicator can only be used with specific indices mentioned below. Currently can be used to estimate the value of largest indices by market cap:
- US Index - based on Fed Balance Sheet (SPX, NDX, DJI, RUI, RUT, RUA, ES1!, NQ1!, YM1!, RTY1!)
- EU Index - based on M1 Money Supply (N100, EU500)
- JP Index - based on M0 Money Supply (NI225, NKY)
- CN Index - based on M0 Money Supply (000001, 399001)
- HK Index - based on M0 Money Supply (HSI)
- SG Index - based on M0 Money Supply (STI)
- CA Index - based on M0 Money Supply (TSX)
- AU Index - based on M0 Money Supply (ASX200, AUS200)
- ID Index - based on M0 Money Supply (COMPOSITE)
Check other script to value stock and index:
- Stock Value Rainbow: script to value stock based on book value, earning, dividend and cash flow
- Index Value Rainbow: script to value index based on fed balance sheet and base money supply
- Gold Value Rainbow: script to value gold based on global money supply
- Stock Value US: script to check US stock value
- Stock Value EU: script to check EU stock value
- Stock Value JP: script to check JP stock value
- Stock Value CN: script to check CN stock value

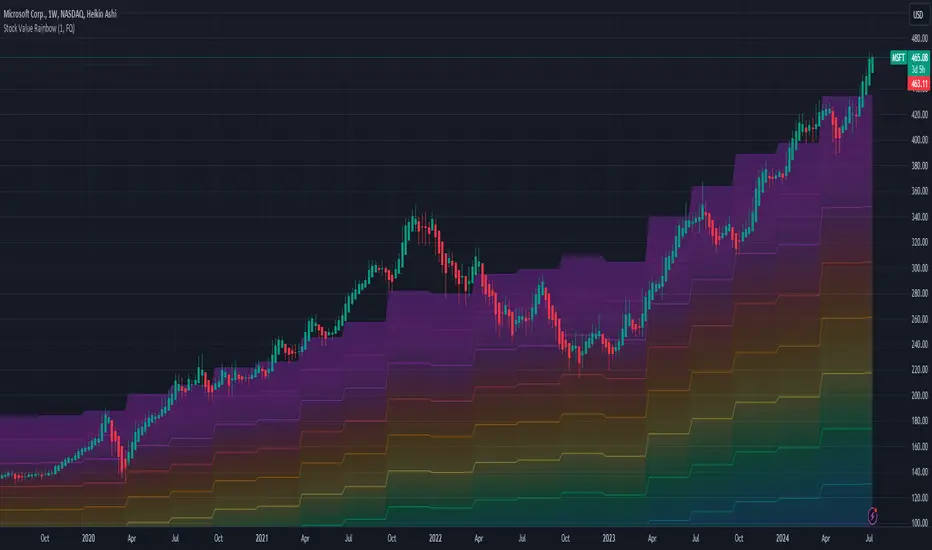
Valuation RainbowValuation Rainbow
© danny_peanuts
Stock value based on Book Value, Earnings, Dividends and Money Multiplier
SV = (BVPS + EPS + DPS) * MM
BVPS = Book Value Per Share
EPS = Earnings Per Share
DPS = Dividends Per Share
MM = Money Multiplier - Integer Number from 1,2,3, ... ,7
There are multiple ways of valuing the stock. Book value is traditionally used as the basic valuation since it's calculate the total asset value minus the liabilities of any company. There are valuation based on multiplication of book value, there are valuation based on multiplication of earnings, and valuation based on multiplication of dividends. Here I'm proposing valuation based on all of these combined. So this indicator is measuring stock value based on multiplication of book value plus earning plus dividend per share. Since the money supply could have an multiplication effect so does the stock value could have a multiplication effect. Also notes that some blue chips stock tends to value higher than startup stock due to money is not equally distributed. So for simplicity I will use simple integer number to represent this multiplication effect as rainbow color plots, thus it can be applied to any stock at any given countries. The higher the stock price on valuation bands the most expensive it is and the lower the price on valuation bands the cheaper it is.
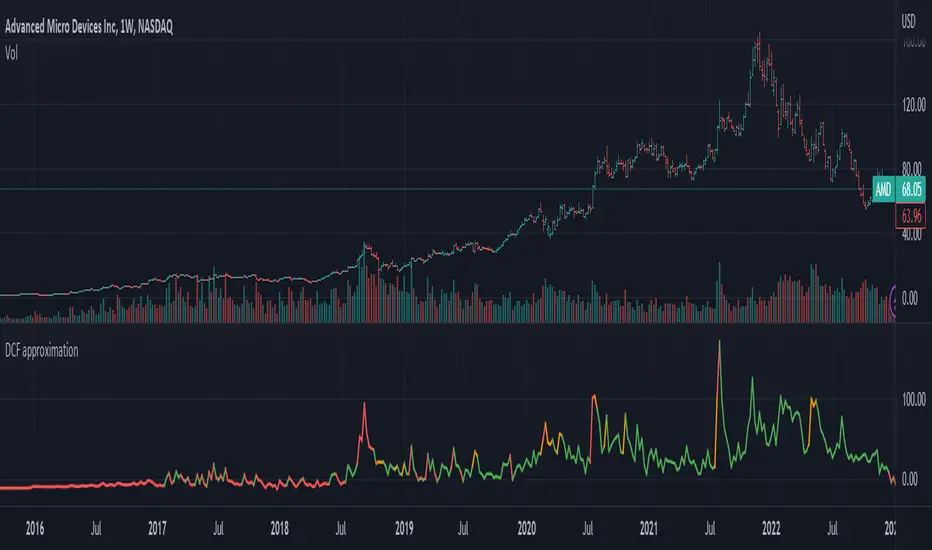
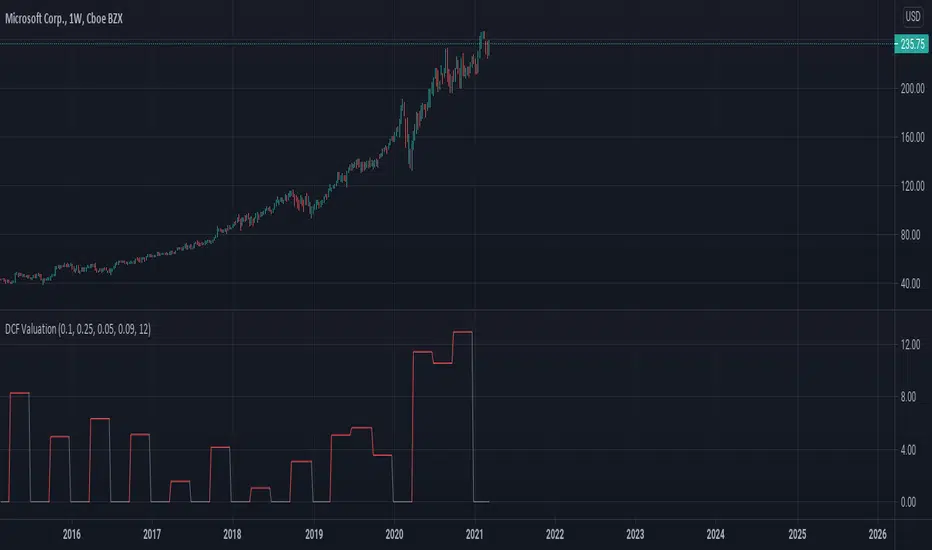
DCF ApproximationThe indicator for calculating and visualizing the Discounted Cash Flow (DCF) for a selected stock.
It uses the Weighted Average Cost of Capital (WACC) with a margin of safety and the Free Cash Flow (FCF) calculation for cash flow analysis. The DCF is calculated by summing the discounted annual FCFs over a 10-year period.
The chart color depends on the value of the current price percentage - it turns red when the market price is over valuation, yellow around a fair value, and green for the price under valuation.
This is an early version of the indicator, so I would appreciate your suggestions for improving the code and formulas.
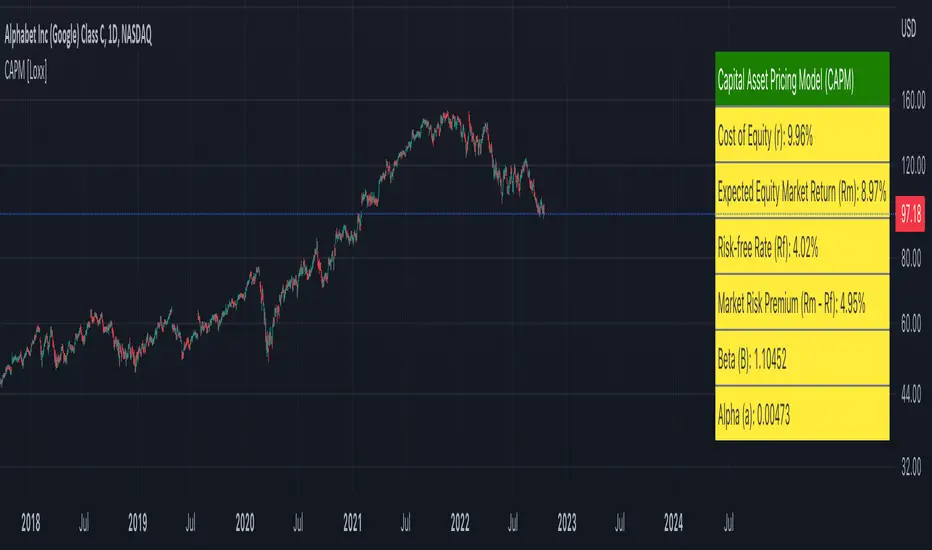
Capital Asset Pricing Model (CAPM) [Loxx]Capital Asset Pricing Model (CAPM) demonstrates how to calculate the Cost of Equity for an underlying asset using Pine Script. This script will only work on the monthly timeframe. While you can change the default inputs, you should study what CAPM is and how this works before doing so. This indicator pulls various types of data from SPY from various timeframes to calculate risk-free rates, market premiums, and log returns. Alpha and Beta are computed using the regression between underlying asset and SPY. This indicator only calculates on the most recent data. If you wish to change this, you'll have to save the script and make adjustments. A few examples where CAPM is used:
Used as the mu factor Geometric Brownian Motion models for options pricing and forecasting price ranges and decay
Calculating the Weighted Average Cost of Capital
Asset pricing
Efficient frontier
Risk and diversification
Security market line
Discounted Cashflow Analysis
Investment bankers use CAPM to value deals
Account firms use CAPM to verify asset prices and assumptions
Real estate firms use variations of CAPM to value properties
... and more
Details of the calculations used here
Rm is calculated using yearly simple returns data from SPY, typically this is just hard coded as 10%.
Rf is pulled from US 10 year bond yields
Beta and Alpha are pulled form monthly returns data of the asset and SPY
In the past, typically this data is purchased from investments banks whose research arms produce values for beta, alpha, risk free rate, and risk premiums. In 2022 ,you can find free estimates for each parameter but these values might not reflect the most current data or research.
History
The CAPM was introduced by Jack Treynor (1961, 1962), William F. Sharpe (1964), John Lintner (1965) and Jan Mossin (1966) independently, building on the earlier work of Harry Markowitz on diversification and modern portfolio theory. Sharpe, Markowitz and Merton Miller jointly received the 1990 Nobel Memorial Prize in Economics for this contribution to the field of financial economics. Fischer Black (1972) developed another version of CAPM, called Black CAPM or zero-beta CAPM, that does not assume the existence of a riskless asset. This version was more robust against empirical testing and was influential in the widespread adoption of the CAPM.
Usage
The CAPM is used to calculate the amount of return that investors need to realize to compensate for a particular level of risk. It subtracts the risk-free rate from the expected rate and weighs it with a factor – beta – to get the risk premium. It then adds the risk premium to the risk-free rate of return to get the rate of return an investor expects as compensation for the risk. The CAPM formula is expressed as follows:
r = Rf + beta (Rm – Rf) + Alpha
Therefore,
Alpha = R – Rf – beta (Rm-Rf)
Where:
R represents the portfolio return
Rf represents the risk-free rate of return
Beta represents the systematic risk of a portfolio
Rm represents the market return, per a benchmark
For example, assuming that the actual return of the fund is 30, the risk-free rate is 8%, beta is 1.1, and the benchmark index return is 20%, alpha is calculated as:
Alpha = (0.30-0.08) – 1.1 (0.20-0.08) = 0.088 or 8.8%
The result shows that the investment in this example outperformed the benchmark index by 8.8%.
The alpha of a portfolio is the excess return it produces compared to a benchmark index. Investors in mutual funds or ETFs often look for a fund with a high alpha in hopes of getting a superior return on investment (ROI).
The alpha ratio is often used along with the beta coefficient, which is a measure of the volatility of an investment. The two ratios are both used in the Capital Assets Pricing Model (CAPM) to analyze a portfolio of investments and assess its theoretical performance.
To see CAPM in action in terms of calculate WACC, see here for an example: finbox.com
Further reading
en.wikipedia.org
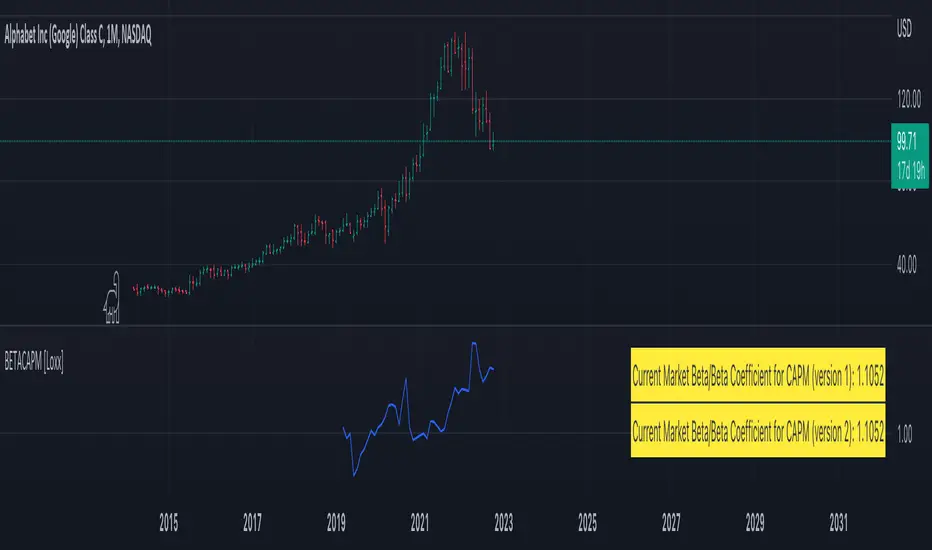
Market Beta/Beta Coefficient for CAPM [Loxx]Market Beta/Beta Coefficient for CAPM is not so much an indicator as it is a value to be used in future indicators to forecast stock prices using the Capital Asset Pricing Model, CAPM. CAPM is used by the likes of value investors such as Warren Buffet and valuation/accounting/investment banking firms. More specifically, CAPM is typically used in Discounted Cashflow Analysis to value revenue generating assets.
What is Beta?
In finance, the beta (β or market beta or beta coefficient) is a measure of how an individual asset moves (on average) when the overall stock market increases or decreases. Thus, beta is a useful measure of the contribution of an individual asset to the risk of the market portfolio when it is added in small quantity. Thus, beta is referred to as an asset's non-diversifiable risk, its systematic risk, market risk, or hedge ratio. Beta is not a measure of idiosyncratic risk.
By definition, the value-weighted average of all market-betas of all investable assets with respect to the value-weighted market index is 1. If an asset has a beta above (below) 1, it indicates that its return moves more (less) than 1-to-1 with the return of the market-portfolio, on average. In practice, few stocks have negative betas (tending to go up when the market goes down). Most stocks have betas between 0 and 3.
How to calculate Beta
To calculate beta you typically choose 5 years of monthly data; typically SPY is used here
Calculate log returns of both the asset for which you are calculating Beta and the benchmark market data
Calculation the covariance between the asset and benchmark
Calculate the variance of the benchmark returns
Divide the covariance by the variance
Read more here:
en.wikipedia.org(finance)
en.wikipedia.org
einvestingforbeginners.com
Financial MetricsGives a sneak peak into some of the important financial ratios described below:
1. P/E : price to earnings ratio (Green when P/E<15)
2. PEG: Price to earnings growth ratio (Green when PEG<1)
3. P/S: Price to sales ratio (Green when P/S<2)
4. EV/FCF: Enterprise Value to Free Cashflow ratio
5. OPM: Operating Profit Margin % (Green when OPM>15%)
6. D/E: Debt to equity ratio (Green when D/E<1)
7. ROE: Return on equity % (Green when ROE>15%)
8. Div_Yield: Dividend yield
Disclaimer: All the limits defined are based on the widely accepted general values, but are subjective to particular sector or group of stocks. For example IT stocks command higher valuation than cyclical stocks like metal. So Compare with other stocks of the same sector to reach any conclusion.

Benjamin Graham Net-Net AnalyserA simple indicator that displayers as a table, telling you whether or not the stock you have selected has a current price that is less than 67% of the company's net current asset value per share (NCAVPS) at its last reporting period (FQ, FY, TTM).
Benjamin Graham uses this 67% rule to decide whether or not a stock is significantly undervalued, and studies have shown that investing in companies whose share prices are less than 67% of their NCAVPS can be highly profitable, and will beat markets in the long run.
Feel free to use as you please or repurpose the code for your own projects.

EsIstTurnt's Relative Value Comparison Multi SymbolCompare the relative valuation of up to 8 tickers. By taking a shorter term moving average and dividing by a longer term moving average(optionally with an offset) we get a value that is either above or below 1. Easy to tell what is undervalued and overvalued with this setup. Useful for comparing different asset classes or sector specific securities looking for outperformers/underperformers. Overvalued and Undervalued levels marked by Red and Green background. Recommended in conjunction with other indicators of your choosing for confirmation of trend changes but this is good for getting a broader view of the market you're interested in. Multiple timeframes, sources available however you should tinker with it to find what gives you the best view for your preferred timeframe.

OGT Intrinsic Value IndicatorOGT Intrinsic Value Indicator
This indicator will show you visually the intrinsic value of a stock. Intrinsic value aims to measure of what an asset is worth. There are a number of intrinsic valuation models where this TradingView indicator uses an earnings valuation model.
There are 4 inputs to the model:
1) EPS trailing 12 months (ttm) - the first step is to know what the current EPS is for a stock. The indicator calculates this for you
2) Annual EPS Growth Next 5 Years - You need to input what you think the annual growth rate is going to be for the stock. You can use you annual estimates which you can obtain by searching "stock name - eps growth forecast"
3) Earnings Multiple (PE Ratio) - The next step is to input the earnings multiple in year 5. You can get this from analyst estimates or looking at the average PE ratio of the asset over the past 3 / 5 / 10 years.
4) Desired Rate Of Return - The last input is your rate of return. I personally use 12.5% as you can invest in an S&P ETF and get 8-10% return. So I prefer a higher rate of return for the risk I am taking.
You will need to input your low, medium and high assumptions so you can see the different price ranges.

Valuation TableHey folks, I hope you are all doing well!
This is an indicator that you can use to help you to evaluate companies. There are a few things I added to the valuation table that I personally use and I will explain what they are.
I added Joel Greenblatt's ROC% because it takes Earnings before Interest and Taxes to reflect more closely what the company earns from its operations, while including the cost of depreciation/amortization of assets. A high double digit figure often means that the company has a defensible edge versus its competitors (e.g. a strong brand or a unique product). It's good for relative valuation (comparing two companies in the same industry).
I also added Donald Yacktman's forward rate of return. Yacktman defines forward rate of return as the normalized free cash flow yield plus real growth plus inflation . Unlike the Earnings Yield %, the Forward Rate of Return uses the normalized Free Cash Flow of the past seven years, and considers growth. The forward rate of return can be thought of as the return that investors buying the stock today can expect from it in the future. Yacktman’s Forward Rate of Return may or may not be a useful metric. However, it does present new ways to see and think about stocks we may want to buy.
I added a box called "real price" and that is from Peter Lynch's book, "One Up on Wall Street," where he talked about how the real price of the stock is really the current price - Net Cash Per Share.
I would also personally pair this script with TradingView's built in financial indicators that shows the revenue growth, net income, etc.
Note: the script only works on the weekly timeframe and it will take some time to load because it has a lot of data.

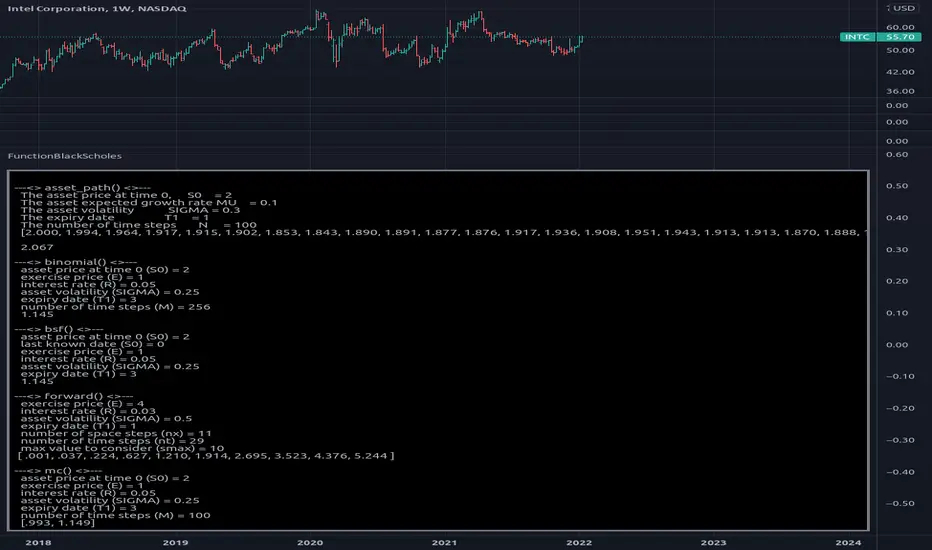
FunctionBlackScholesLibrary "FunctionBlackScholes"
Some methods for the Black Scholes Options Model, which demonstrates several approaches to the valuation of a European call.
// reference:
// people.math.sc.edu
// people.math.sc.edu
asset_path(s0, mu, sigma, t1, n) Simulates the behavior of an asset price over time.
Parameters:
s0 : float, asset price at time 0.
mu : float, growth rate.
sigma : float, volatility.
t1 : float, time to expiry date.
n : int, time steps to expiry date.
Returns: option values at each equal timed step (0 -> t1)
binomial(s0, e, r, sigma, t1, m) Uses the binomial method for a European call.
Parameters:
s0 : float, asset price at time 0.
e : float, exercise price.
r : float, interest rate.
sigma : float, volatility.
t1 : float, time to expiry date.
m : int, time steps to expiry date.
Returns: option value at time 0.
bsf(s0, t0, e, r, sigma, t1) Evaluates the Black-Scholes formula for a European call.
Parameters:
s0 : float, asset price at time 0.
t0 : float, time at which the price is known.
e : float, exercise price.
r : float, interest rate.
sigma : float, volatility.
t1 : float, time to expiry date.
Returns: option value at time 0.
forward(e, r, sigma, t1, nx, nt, smax) Forward difference method to value a European call option.
Parameters:
e : float, exercise price.
r : float, interest rate.
sigma : float, volatility.
t1 : float, time to expiry date.
nx : int, number of space steps in interval (0, L).
nt : int, number of time steps.
smax : float, maximum value of S to consider.
Returns: option values for the european call, float array of size ((nx-1) * (nt+1)).
mc(s0, e, r, sigma, t1, m) Uses Monte Carlo valuation on a European call.
Parameters:
s0 : float, asset price at time 0.
e : float, exercise price.
r : float, interest rate.
sigma : float, volatility.
t1 : float, time to expiry date.
m : int, time steps to expiry date.
Returns: confidence interval for the estimated range of valuation.
ROE ValuationAn indicator that can be used to study ROE Valuation for stocks.
Red color means the market price is higher than the valuation whereas green color means the market price is below the valuation and it might be a good opportunity for value traders. Gray color indicates non-applicable results, when valuation is below zero for example.

PE ValuationAn indicator that can be used to study PE Valuation for stocks.
When the reported EPS for a company is non-positive the line turns gray. Red color means the market price is higher than the valuation whereas green color means the market price is below the valuation and it might be a good opportunity for value traders.

DCF ValuationAn indicator that can be used to study Discounted Cash Flow Valuation for stocks.
When the reported Free Cash Flow for a company is non-positive the line turns gray. Red color means the market price is higher than the valuation whereas green color means the market price is below the valuation and it might be a good opportunity for value traders.
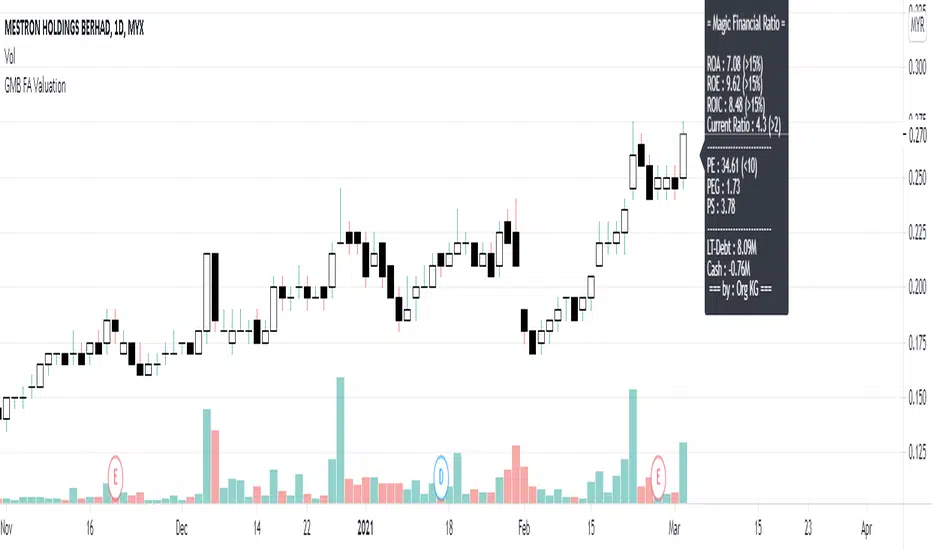
FA Valuation DashboardSimple Financial Ratio for investor.
User can insert CAGR value for PEG ratio.
UCSgears_Transaction Valuation IndexHere is the Version 2 of the TVI indicator posted earlier.
This is inspired from the Value Charts Indicator.
Version 1

UCSgears_Transaction Valuation IndexThis is an indicator, That works great in a wip-saw market range. Would not use this to trade in a breakout.
I am calling it the "Transaction Value Index (UCS_TVI)", The reason is because, it measure where the price currently from the mean trade value.
The cross represents the highest trade value on that day, circle represents the lowest trade value.
In other words, Top and bottom of the candle wicks, in relation to the mean trade value (MTV).
Watchout for Further Updates on Optimizing this indicator.
DO NOT CONFUSE IT WITH FUNDAMENTAL VALUATION, THIS IS PURELY TECHNICAL VALUATION TECHNIQUE
As Usual, Good Luck
List of All my Indicators - www.tradingview.com
