StO Price Action - Level ReactionShort-Summary
- Multi-timeframe reaction indicator for M5, M15, M30, H1, H4
- Monitors price interaction with higher timeframe levels (Daily, Weekly, H4)
- Detects whether price touches or breaks choosen levels
- Fully configurable colors, visibility and alerts per timeframe and level type
Full Description
Overview
- Tracks market reaction on significant levels across multiple timeframes
- Designed to identify intraday reactions to higher timeframe structure
- Supports both bullish and bearish reactions, with separate visual cues
- Alerts can be enabled to notify traders of touches or breaks
Core Logic
- Choice between detecting a touch or a break of the level
- Configurable reference level: Open, High or Low
- Lookback period can be set to target specific levels from previous candles
Timeframe Reactions
- Supported intraday reaction timeframes: M5, M15, M30, H1, H4, Daily, Weekly
- Each reaction type can be individually toggled for display
- Bullish and bearish reactions have separate color settings
- Alerts configurable per timeframe and reaction type
Alerting
- Alerts can be triggered for touches or breaks
- Supports separate alerts for each timeframe and each direction (bull/bear)
- Useful for real-time monitoring of key level interactions
Notes
- Intended as a market reaction tool not a standalone entry signal
- Helps traders confirm if price respects or violates higher timeframe levels
Validation

ICT Anchored Market Structures with Validation [LuxAlgo]The ICT Anchored Market Structures with Validation indicator is an advanced iteration of the original Pure-Price-Action-Structures tool, designed for price action traders.
It systematically tracks and validates key price action structures, distinguishing between true structural shifts/breaks and short-term sweeps to enhance trend and reversal analysis. The indicator automatically highlights structural points, confirms breakouts, identifies sweeps, and provides clear visual cues for short-term, intermediate-term, and long-term market structures.
A distinctive feature of this indicator is its exclusive reliance on price patterns. It does not depend on any user-defined input, ensuring that its analysis remains robust, objective, and uninfluenced by user bias, making it an effective tool for understanding market dynamics.
🔶 USAGE
Market structure is a cornerstone of price action analysis. This script automatically detects real-time market structures across short-term, intermediate-term, and long-term levels, simplifying trend analysis for traders. It assists in identifying both trend reversals and continuations with greater clarity.
Market structure shifts and breaks help traders identify changes in trend direction. A shift signals a potential reversal, often occurring when a swing high or low is breached, suggesting a transition in trend. A break, on the other hand, confirms the continuation of an established trend, reinforcing the current direction. Recognizing these shifts and breaks allows traders to anticipate price movement with greater accuracy.
It’s important to note that while a CHoCH may signal a potential trend reversal and a BoS suggests a continuation of the prevailing trend, neither guarantees a complete reversal or continuation. In some cases, CHoCH and BoS levels may act as liquidity zones or areas of consolidation rather than indicating a clear shift or continuation in market direction. The indicator’s validation component helps confirm whether the detected CHoCH and BoS are true breakouts or merely liquidity sweeps.
🔶 DETAILS
🔹 Market Structures
Market structures are derived from price action analysis, focusing on identifying key levels and patterns in the market. Swing point detection, a fundamental concept in ICT trading methodologies and teachings, plays a central role in this approach.
Swing points are automatically identified based exclusively on market movements, without requiring any user-defined input.
🔹 Utilizing Swing Points
Swing points are not identified in real-time as they form. Short-term swing points may appear with a delay of up to one bar, while the identification of intermediate and long-term swing points is entirely dependent on subsequent market movements. Importantly, this detection process is not influenced by any user-defined input, relying solely on pure price action. As a result, swing points are generally not intended for real-time trading scenarios.
Instead, traders often analyze historical swing points to understand market trends and identify potential entry and exit opportunities. By examining swing highs and lows, traders can:
Recognize Trends: Swing highs and lows provide insight into trend direction. Higher swing highs and higher swing lows signify an uptrend, while lower swing highs and lower swing lows indicate a downtrend.
Identify Support and Resistance Levels: Swing highs often act as resistance levels, referred to as Buyside Liquidity Levels in ICT terminology, while swing lows function as support levels, also known as Sellside Liquidity Levels. Traders can leverage these levels to plan their trade entries and exits.
Spot Reversal Patterns: Swing points can form key reversal patterns, such as double tops or bottoms, head and shoulders, and triangles. Recognizing these patterns can indicate potential trend reversals, enabling traders to adjust their strategies effectively.
Set Stop Loss and Take Profit Levels: In ICT teachings, swing levels represent price points with expected clusters of buy or sell orders. Traders can target these liquidity levels/pools for position accumulation or distribution, using swing points to define stop loss and take profit levels in their trades.
Overall, swing points provide valuable information about market dynamics and can assist traders in making more informed trading decisions.
🔹 Logic of Validation
The validation process in this script determines whether a detected market structure shift or break represents a confirmed breakout or a sweep.
The breakout is confirmed when the close price is significantly outside the deviation range of the last detected structural price. This deviation range is defined by the 17-period Average True Range (ATR), which creates a buffer around the detected market structure shift or break.
A sweep occurs when the price breaches the structural level within the deviation range but does not confirm a breakout. In this case, the label is updated to 'SWEEP.'
A visual box is created to represent the price range where the breakout or sweep occurs. If the validation process continues, the box is updated. This box visually highlights the price range involved in a sweep, helping traders identify liquidity events on the chart.
🔶 SETTINGS
The settings for Short-Term, Intermediate-Term, and Long-Term Structures are organized into groups, allowing users to customize swing points, market structures, and visual styles for each.
🔹 Structures
Swings and Size: Enables or disables the display of swing highs and lows, assigns icons to represent the structures, and adjusts the size of the icons.
Market Structures: Toggles the visibility of market structure lines.
Market Structure Validation: Enable or disable validation to distinguish true breakouts from liquidity sweeps.
Market Structure Labels: Displays or hides labels indicating the type of market structure.
Line Style and Width: Allows customization of the style and width of the lines representing market structures.
Swing and Line Colors: Provides options to adjust the colors of swing icons, market structure lines, and labels for better visualization.
🔶 RELATED SCRIPTS
Pure-Price-Action-Structures.
Market-Structures-(Intrabar).

Machine Learning Cross-Validation Split & Batch HighlighterThis indicator is designed for traders and analysts who employ Machine Learning (ML) techniques for cross-validation in financial markets.
The script visually segments a selected range of historical price data into splits and batches, helping in the assessment of model performance over different market conditions.
User
Theory
In ML, cross-validation is a technique to assess the generalizability of a model, typically by partitioning the data into a set of "folds" or "splits." Each split acts as a validation set, while the others form the training set. This script takes a unique approach by considering the sequential nature of financial time series data, where random shuffling of data (as in traditional cross-validation) can disrupt the temporal order, leading to misleading results.
Chronological Integrity of Splits
Even if the order of the splits is shuffled for cross-validation purposes, the data within each split remains in its original chronological sequence. This feature is crucial for time series analysis, as it respects the inherent order-dependency of financial markets. Thus, each split can be considered a microcosm of market behavior, maintaining the integrity of trends, cycles, and patterns that could be disrupted by random sampling.
The script allows users to define the number of splits and the size of each batch within a split. By doing so, it maintains the chronological sequence of the data, ensuring that the validation set is representative of a future time period that the model would predict.
www.tradingview.com
Parameters
Number of Splits: Defines how many segments the selected data range will be divided into. Each split serves as a standalone testing ground for the ML model. (Up to 24)
Batch Size: Determines the number of bars (candles) in each batch within a split. Smaller batches can help pinpoint overfitting at a finer granularity.
Start Index: The bar index from where the historical data range begins. It sets the starting point for data analysis.
End Index: The bar index where the historical data range ends. It marks the cutoff for data to be included in the model assessment.
Usage
To use this script effectively:
1 - Input the Start Index and End Index to define the historical data range you wish to analyze.
2 - Adjust the Number of Splits to create multiple validation sets for cross-validation.
3 - Set the Batch Size to control the granularity of each validation set within the splits.
4 - The script will highlight the background of each batch within the splits using alternating shades, allowing for a clear visual distinction of the data segmentation.
By maintaining the temporal sequence and allowing for adjustable granularity, the "ML Split and Batch Highlighter" aids in creating a robust validation framework for time series forecasting models in finance.

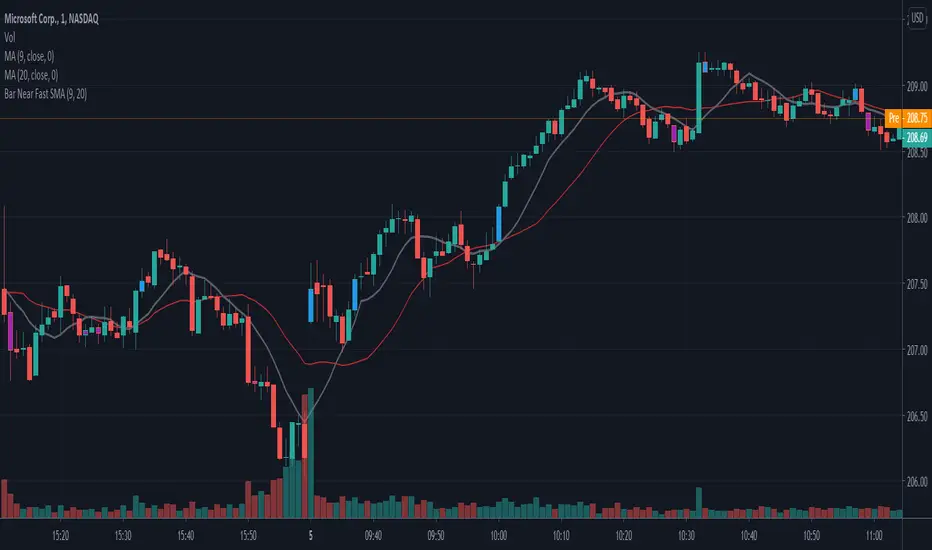
Bar Near Fast SMAPaints bars based on whether they are above or below the Fast SMA. You can optionally show/hide bars that are below the slow SMA.
This is supposed to be used as confirmation and validation of an idea.