Volume Profile Skew [BackQuant]Volume Profile Skew
Overview
Volume Profile Skew is a market-structure indicator that answers a specific question most volume profiles do not:
“Is volume concentrating toward lower prices (accumulation) or higher prices (distribution) inside the current profile range?”
A standard volume profile shows where volume traded, but it does not quantify the shape of that distribution in a single number. This script builds a volume profile over a rolling lookback window, extracts the key profile levels (POC, VAH, VAL, and a volume-weighted mean), then computes the skewness of the volume distribution across price bins. That skewness becomes an oscillator, smoothed into a regime signal and paired with visual profile plotting, key level lines, and historical POC tracking.
This gives you two layers at once:
A full profile and its important levels (where volume is).
A skew metric (how volume is leaning within that range).
What this indicator is based on
The foundation comes from classical “volume at price” concepts used in Market Profile and Volume Profile analysis:
POC (Point of Control): the price level with the highest traded volume.
Value Area (VAH/VAL): the zone containing the bulk of activity, commonly 70% of total volume.
Volume-weighted mean (VWMP in this script): the average price weighted by volume, a “center of mass” for traded activity.
Where this indicator extends the idea is by treating the volume profile as a statistical distribution across price. Once you treat “volume by price bin” as a probability distribution (weights sum to 1), you can compute distribution moments:
Mean: where the mass is centered.
Standard deviation: how spread-out it is.
Skewness: whether the distribution has a heavier tail toward higher or lower prices.
This is not a gimmick. Skewness is a standard statistic in probability theory. Here it is applied to “volume concentration across price”, not to returns.
Core concept: what “skew” means in a volume profile
Imagine a profile range from Low to High, split into bins. Each bin has some volume. You can get these shapes:
Balanced profile: volume is fairly symmetric around the mean, skew near 0.
Bottom-heavy profile: more volume at lower prices, with a tail toward higher prices, skew tends to be positive.
Top-heavy profile: more volume at higher prices, with a tail toward lower prices, skew tends to be negative.
In this script:
Positive skew is labeled as ACCUMULATION.
Negative skew is labeled as DISTRIBUTION.
Near-zero skew is NEUTRAL.
Important: accumulation here does not mean “buying will immediately pump price.” It means the profile shape suggests more participation at lower prices inside the current lookback range. Distribution means participation is heavier at higher prices.
How the volume profile is built
1) Define the analysis window
The profile is computed on a rolling window:
Lookback Period: number of bars included (capped by available history).
Profile Resolution (bins): number of price bins used to discretize the high-low range.
The script finds the highest high and lowest low in the lookback window to define the price range:
rangeHigh = highest high in window
rangeLow = lowest low in window
binSize = (rangeHigh - rangeLow) / bins
2) Create bin midpoints
Each bin gets a midpoint “price” used for calculations:
price = rangeLow + binSize * (b + 0.5)
These midpoints are what the mean, variance, and skewness are computed on.
3) Distribute each candle’s volume into bins
This is a key implementation detail. Real volume profiles require tick-level data, but Pine does not provide that. So the script approximates volume-at-price using candle ranges:
For each bar in the lookback:
Determine which bins its low-to-high range touches.
Split that candle’s total volume evenly across the touched bins.
So if a candle spans 6 bins, each bin gets volume/6 from that bar. This is a practical, consistent approximation for “where trading could have occurred” inside the bar.
This approach has tradeoffs:
It does not know where within the candle the volume truly traded.
It assumes uniform distribution across the candle range.
It becomes more meaningful with larger samples (bigger lookback) and/or higher timeframes.
But it is still useful because the purpose here is the shape of the distribution across the whole window, not exact microstructure.
Key profile levels: POC, VAH, VAL, VWMP
POC (Point of Control)
POC is found by scanning bins and selecting the bin with maximum volume. The script stores:
pocIndex: which bin has max volume
poc price: midpoint price of that bin
Value Area (VAH/VAL) using 70% volume
The script builds the value area around the POC outward until it captures 70% of total volume:
Start with the POC bin.
Expand one bin at a time to the side with more volume.
Stop when accumulated volume >= 70% of total profile volume.
Then:
VAL = rangeLow + binSize * lowerIdx
VAH = rangeLow + binSize * (upperIdx + 1)
This produces a classic “where most business happened” zone.
VWMP (Volume-Weighted Mean Price)
This is essentially the center of mass of the profile:
VWMP = sum(price * volume ) / totalVolume
It is similar in spirit to VWAP, but it is computed over the profile bins, not from bar-by-bar typical price.
Skewness calculation: turning the profile into an oscillator
This is the main feature.
1) Treat volumes as weights
For each bin:
weight = volume / totalVolume
Now weights sum to 1.
2) Compute weighted mean
Mean price:
mean = sum(weight * price )
3) Compute weighted variance and std deviation
Variance:
variance = sum(weight * (price - mean)^2)
stdDev = sqrt(variance)
4) Compute weighted third central moment
Third moment:
m3 = sum(weight * (price - mean)^3)
5) Standardize to skewness
Skewness:
rawSkew = m3 / (stdDev^3)
This standardization matters. Without it, the value would explode or shrink based on profile scale. Standardized skewness is dimensionless and comparable.
Smoothing and regime rules
Raw skewness can be jumpy because:
profile bins change as rangeHigh/rangeLow shift,
one high-volume candle can reshape the distribution,
volume regimes change quickly in crypto.
So the indicator applies EMA smoothing:
smoothedSkew = EMA(rawSkew, smooth)
Then it classifies regime using fixed thresholds:
Bullish (ACCUMULATION): smoothedSkew > +0.25
Bearish (DISTRIBUTION): smoothedSkew < -0.25
Neutral: between those values
Signals are generated on threshold cross events:
Bull signal when smoothedSkew crosses above +0.25
Bear signal when smoothedSkew crosses below -0.25
This makes the skew act like a regime oscillator rather than a constantly flipping color.
Volume Profile plotting modes
The script draws the profile on the last bar, using boxes for each bin, anchored to the right with a configurable offset. The width of each profile bar is normalized by max bin volume:
volRatio = binVol / maxVol
barWidth = volRatio * width
Three style modes exist:
1) Gradient
Uses a “jet-like” gradient based on volRatio (blue → red). Higher-volume bins stand out naturally. Transparency increases as volume decreases, so low-volume bins fade.
2) Solid
Uses the current regime color (bull/bear/neutral) for all bins, with transparency. This makes the profile read as “structure + regime.”
3) Skew Highlight
Highlights bins that match the skew bias:
If skew bullish, emphasize lower portion of profile.
If skew bearish, emphasize higher portion of profile.
Else, keep most bins neutral.
This is a visual “where the skew is coming from” mode.
Historical POC tracking and Naked POCs
This script also treats POCs as meaningful levels over time, similar to how traders track old VA levels.
What is a “naked POC”?
A “naked POC” is a previously formed POC that has not been revisited (retested) by price since it was recorded. Many traders watch these as potential reaction zones because they represent prior “maximum traded interest” that the market has not re-engaged with.
How this script records POCs
It stores a new historical POC when:
At least updatebars have passed since the last stored POC, and
The POC has changed by at least pochangethres (%) from the last stored value.
New stored POCs are flagged as naked by default.
How naked becomes tested
On each update, the script checks whether price has entered a small zone around a naked POC:
zoneSize = POC * 0.002 (about 0.2%)
If bar range overlaps that zone, mark it as tested (not naked).
Display controls:
Highlight Naked POCs: draws and labels untested POCs.
Show Tested POCs: optionally draw tested ones in a muted color.
To avoid clutter, the script limits stored POCs to the most recent 20 and avoids drawing ones too close to the current POC.
On-chart key levels and what they mean
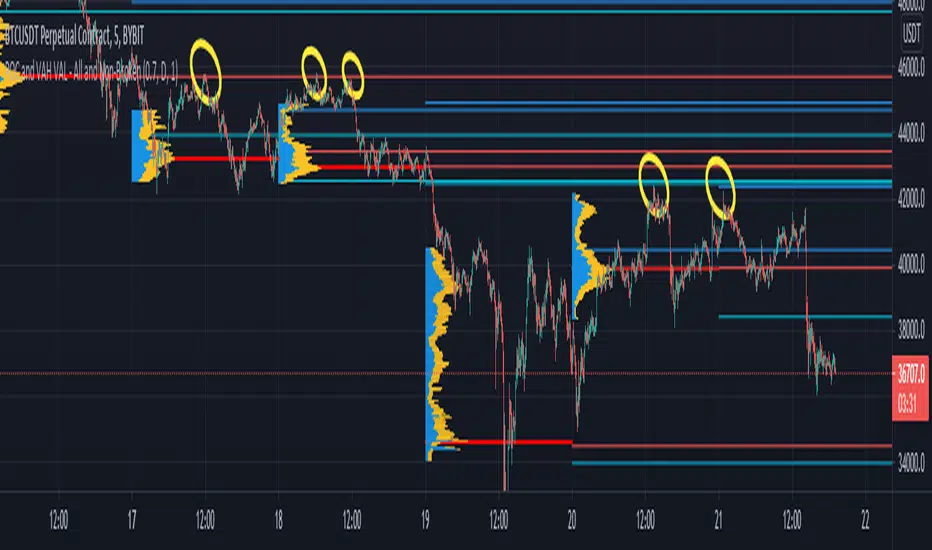
When enabled, the script draws the current lookback profile levels on the price chart:
POC (solid): the “most traded” price.
VAH/VAL (dashed): boundaries of the 70% value area.
VWMP (dotted): volume-weighted mean of the profile distribution.
Interpretation framework (practical, not mystical):
POC often behaves like a magnet in balanced conditions.
VAH/VAL define the “accepted” area, breaks can signal auction continuation.
VWMP is a fair-value reference, useful as a mean anchor when skew is neutralizing.
Oscillator panel and histogram
The skew oscillator is plotted in a separate pane:
Line: smoothedSkew, colored by regime.
Histogram: smoothedSkew as bars, colored by sign.
Fill: subtle shading above/below 0 to reinforce bias.
This makes it easy to read:
Direction of bias (positive vs negative).
Strength (distance from 0 and from thresholds).
Transitions (crosses of ±0.25).
Info table: what it summarizes
On the last bar, a table prints key diagnostics:
Current skew value (smoothed).
Regime label (ACCUMULATION / DISTRIBUTION / NEUTRAL).
Current POC, VAH, VAL, VWMP.
Count of naked POCs still active.
A simple “volume location” hint (lower/higher/balanced).
This is designed for quick scanning without reading the entire profile.
Alerts
The indicator includes alerts for:
Skew regime shifts (cross above +0.25, cross below -0.25).
Price crossing above/below current POC.
Approaching a naked POC (within 1% of any active naked POC).
The “approaching naked POC” alert is useful as a heads-up that price is entering a historically important volume magnet/reaction zone.
How to use it properly
1) Regime filter
Use skew regime to decide what type of trades you should prioritize:
ACCUMULATION (positive skew): market activity is heavier at lower prices, pullbacks into value or below VWMP often matter more.
DISTRIBUTION (negative skew): activity is heavier at higher prices, rallies into value or above VWMP often matter more.
NEUTRAL: mean-reversion and POC magnet behavior tends to dominate.
This is not “buy when green.” It is context for what the auction is doing.
2) Level-based execution
Combine skew with VA/POC levels:
In neutral regimes, expect rotations around POC and inside VA.
In strong skew regimes, watch for acceptance away from POC and reactions at VA edges.
3) Naked POCs as targets and reaction zones
Naked POCs can act like unfinished business. Common workflows:
As targets in rotations.
As areas to reduce risk when price is approaching.
As “if it breaks cleanly, trend continuation” markers when price returns with force.
Parameter tuning guidance
Lookback
Controls how “local” the profile is.
Shorter: reacts faster, more sensitive to recent moves.
Longer: more stable, better for swing context.
Bins
Controls resolution of the profile.
Higher bins: more detail, more computation, more sensitive profile shape.
Lower bins: smoother, less detail, more stable skew.
Smoothing
Controls how noisy the skew oscillator is.
Higher smoothing: fewer regime flips, slower response.
Lower smoothing: more responsive, more false transitions.
POC tracking settings
Update interval and threshold decide how many historical POCs you store and how different they must be. If you set them too loose, you will spam levels. If too strict, you will miss meaningful shifts.
Limitations and what not to assume
This indicator uses candle-range volume distribution because Pine cannot see tick-level volume-at-price. That means:
The profile is an approximation of where volume could have traded, not exact tape data.
Skew is best treated as a structural bias, not a precise signal generator.
Extreme single-bar events can distort the distribution briefly, smoothing helps but cannot remove reality.
Summary
Volume Profile Skew takes standard volume profile structure (POC, Value Area, volume-weighted mean) and adds a statistically grounded measure of profile shape using skewness. The result is a regime oscillator that quantifies whether volume concentration is leaning toward lower prices (accumulation) or higher prices (distribution), while also plotting the full profile, key levels, and historical naked POCs for actionable context.
Pine Script® göstergesi