INTELLECT_city - US Presidential Elections Dates (USA)(EN)
It is interesting to compare Halvings Cycles and Presidential elections.
This indicator shows all presidential elections in the USA from the period 2008, and future ones to the date 2044. The indicator will automatically show all future dates of presidential elections.
--
To apply it to your chart it is very easy:
Select:
1) Exchange: BITSTAMP
2) Pair BTC \ USD (Without "T" at the end)
3) Timeframe 1 day
4) In the Browser, switch the chart to Logarithmic (on the right bottom, click the "L" button)
or on mobile, switch to "Logarithmic" we look on the chart: "Gear" - and switch to "Logarithmic"
------------------
(RU)
Интересно сопоставить Циклы Halvings и Президентские выборы.
Данный индикатор показывает все президентские выборы в США с периода 2008 года, и будущие к дате 2044 года. Индикатор будет автоматически показывать все будущие даты .
--
Что бы применить у себя на графике это очень легко:
Выберите:
1) Биржа: BITSTAMP
2) Пара BTC \ USD (Без "T" в конце)
3) Timeframe 1 дневной
4) В Браузере переключить график на Логарифмический (с право внизу кнопка "Л")
или на мобильно переключить на "Логарифмический" ищем на графике: "Шестеренку" — и переключаем на "Логарифмический"
-------------------
(DE)
Es ist interessant, die Halbierungszyklen und die Präsidentschaftswahlen zu vergleichen.
Dieser Indikator zeigt alle US-Präsidentschaftswahlen seit 2008 und zukünftige bis zum Datum 2044. Der Indikator zeigt automatisch alle zukünftigen Präsidentschaftswahltermine an.
--
Es ist sehr einfach, dies auf Ihr Diagramm anzuwenden:
Wählen:
1) Austausch: BITSTAMP
2) Paar BTC \ USD (Ohne das „T“ am Ende)
3) Zeitrahmen 1 Tag
4) Schalten Sie im Browser das Diagramm auf Logarithmisch um (die Schaltfläche „L“ unten rechts).
oder auf dem Mobilgerät auf „Logarithmisch“ umschalten, in der Grafik nach „Getriebe“ suchen – und auf „Logarithmisch“ umschalten
USA

US Presidential Elections (Names & Dates)US Presidential Elections (Names & Dates)
Description :
This indicator marks key dates in US presidential history, highlighting both election days and inauguration dates. It's designed to provide historical context to your charts, allowing you to see how major political events align with market movements.
Key Features:
• Displays US presidential elections from 1936 to 2052
• Shows inauguration dates for each president
• Customizable colors and styles for both election and inauguration markers
• Toggle visibility of election and inauguration labels separately
• Adapts to different timeframes (daily, weekly, monthly)
• Includes president names for historical context
The indicator uses yellow labels for election days and blue labels for inauguration dates. Election labels show the year and "Election", while inauguration labels display the name of the incoming president.
Customization options include:
• Colors for election and inauguration labels and text
• Line widths for both types of events
• Label placement styles
This tool is perfect for traders and analysts who want to correlate political events with market trends over long periods. It provides a unique perspective on how presidential cycles might influence financial markets.
Note: Future elections (2024 onwards) are marked with a placeholder (✅) as the presidents are not yet known.
Use this indicator to:
• Identify potential market patterns around election cycles
• Analyze historical market reactions to specific presidencies
• Add political context to your long-term chart analysis
Enhance your chart analysis with this comprehensive view of US presidential history!

US Recession IndicatorThe US Recession Indicator is designed to identify recessions as they happen, using two reputable indicators that have accurately foreseen all past recessions since 1969. Unlike the National Bureau of Economic Research (NBER) which determines recession dates after the fact, this indicator seeks to spot recessions in real-time. When both of these distinct metrics meet certain criteria, the chart's background becomes shaded, signifying a strong likelihood that the economy is in a recession. Furthermore, a built-in alert system keeps users updated without constant monitoring.
The first metric is the Smoothed Recession Probabilities developed by Marcelle Chauvet. It is based on a dynamic-factor markov-switching model that assesses four monthly coincident variables: non-farm payroll employment, the index of industrial production, real personal income excluding transfer payments and real manufacturing and trade sales. It offers a mathematical analysis of how recessions deviate from expansions. In essence, this index mirrors the probability of the prevailing true economic situation being a recession, grounded on the current GDP data.
The second metric is the Sahm Rule Recession Indicator developed by Claudia Sahm. It operates on the principle that changes in the unemployment rate can be used to identify the onset of a recession. According to this rule, if the three-month moving average of the unemployment rate rises by 0.5 percentage points or more above its lowest point from the preceding year, it flags a potential recession.
For this combined indicator, the thresholds are intentionally set lower than when each metric is used individually. Both metrics must simultaneously suggest a potential recession in order to send a signal. This stems from the realisation that neither metric is infallible and has, on occasion, sent false signals in the past. By requiring both to align, the likelihood of a false positive is reduced. However, it's crucial to understand that past performance does not guarantee future results, leaving the door open for potential false alerts which may not be confirmed by the NBER.

Interest Rates | USA / EU / UKThis script shows the Interest Rates of the USA, EU and UK.
USA = Red
EU = Blue
UK = White

AltSessionHello World
It’s no secret that trading sessions play a massive role in market movement and liquidity. We can clearly see in the image about how important identifying international trading hours are for a trader.
The Asian session starts around 1am GMT and often has a bearish bias through this session lasting for a few hours, after which Frankfurt and London traders start to come online and can often reverse the Asian sentiment.
The London session is the best session to trade traditionally starting around 7am GMT before the American traders come online and reverse market once again.
We have designed this indicator to help identify different trading hours easily with a background shade on the chart and also high/lows of the training session, as these levels can often be revisited.
We hope you find this indicator useful and please feel free to drop a comment if you have any updates you wish to be made or any future indicator script ideas, thank you.

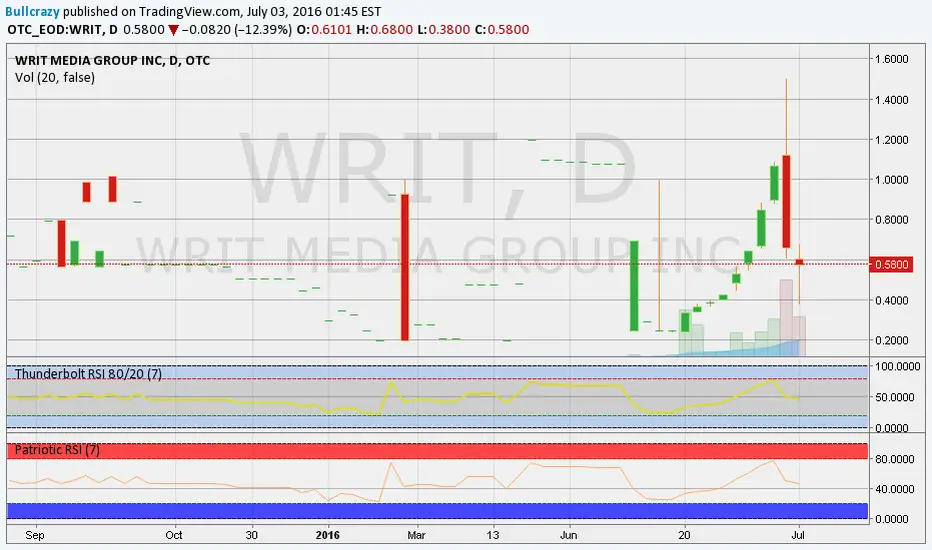
DIX Short Sale VolumeThis indicator combines all the short sale volumes from NASDAQ, NYSE and BATS exchanges and calculates Short Vol % to Total Volume across these 3 exchanges. Use it on Daily Timeframe as shown in the above chart.
For more information on Short Sale Volumes refer to www.finra.org
Usage
When short sale volume data is rising rapidly, it indicates bullishness in the underlying as market makers do not have the shares to sell which results in short sale
When a stock gets dumped by institutions, short sale %age is normally very low and trend is downwards

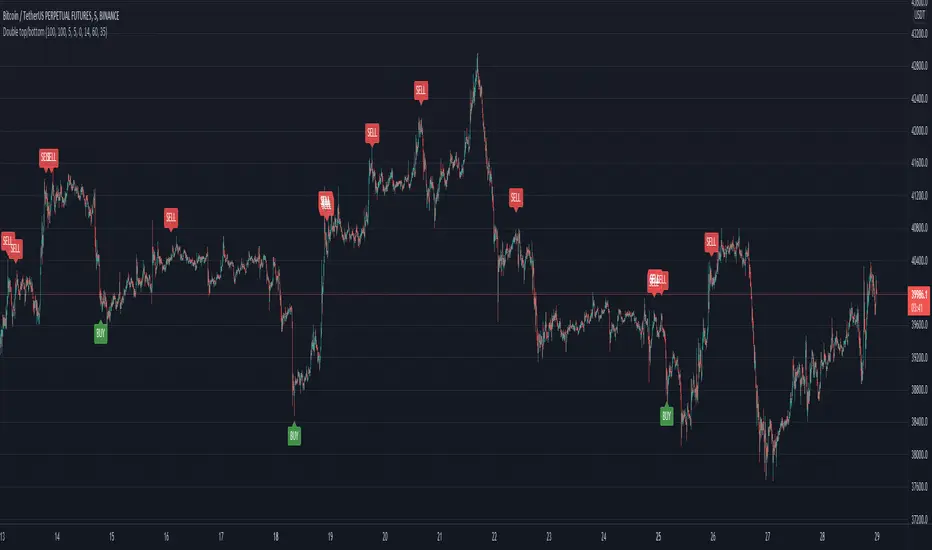
Double top/bottomHello!
This alerts is based on the double bottom pattern - for entering a long position / double top-short
A double bottom pattern is formed when two price bottoms are relatively at the same level and the top acts as resistance. This pattern appears at the end of a downtrend and signals a reversal.
A double top is a bearish reversal pattern that signals the end of an uptrend. It is formed by two price highs forming at the same level and a notch line that acts as local support.
As history and practice show, the double bottom pattern works better. Moreover, in a bull market.
// LOGIC ENTRY:
Period for short and long positions-to search for double bottom as well as double top . the more, the less false.
Change liong and short-channel width for pattern search separately for long and short.
General shift-the overall width of the channel, which changes equally at once for long and short
By default, quiet settings for 1 hour
You can choose the settings you like.
//FILTER SETTING
-RSI
If the checkbox is checked, the filter will be enabled.
The higher the upper bound, the less frequent short entries.
The lower the indicators of the lower border, the less frequent entries to the long
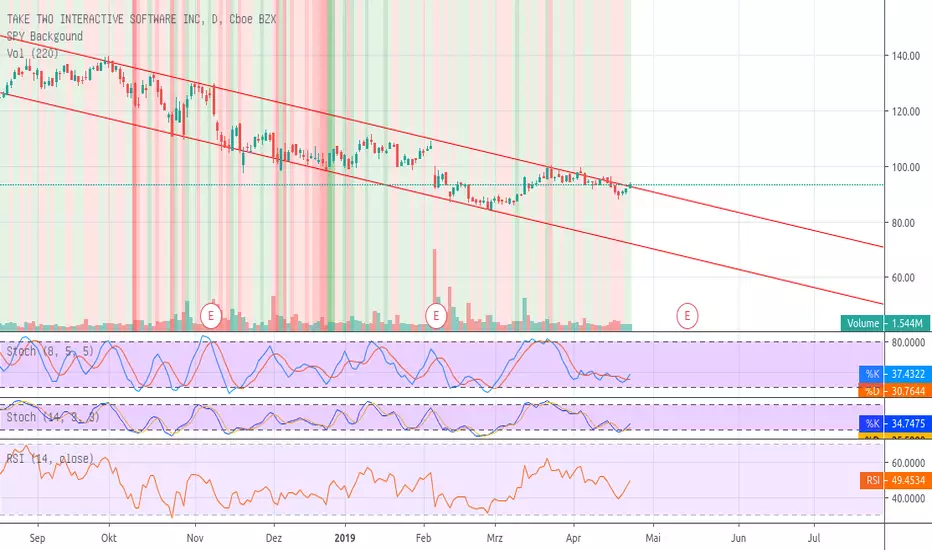
Divergence of Stocks Above MA50 v.s. US-Stock MarketEnglish:
This indicator has been developed as an early warning tool to estimate the probability of correction in the US stock market. It works best in the daily chart.
Function:
1.) "Index-line"
The underlying stock index is converted to a scale between 0% and 100% based on its 52-week highs and lows. Where 100% is closing price at 52-week high and 0% is closing price at 52-week low.
2nd) "Stocks Above MA50".
For each major stock index, there is an index that determines the percentage of stocks above its 50 moving average. For example, for the S&P 500, this is the S5FI.
3) "Divergence
In an efficient market, both lines (index and number of stocks above the 50 MA) would run more or less in sync. A new high in the index would also mean a new high in the stocks trading above the 50 moving average. Often, however, a correction in the index is announced when the number of stocks trading above their 50 MA do not make a new, or even a lower, high while the underlying index marks a new high. The divergence signal measures this divergence of the indices. The higher the bar, the more pronounced the divergence.
How to read the indicator?
If a divergence occurs, then the stops should be tightened. As with any indicator, false signals can occur because a divergence does not automatically lead to a correction. The higher the divergence is indicated, the higher the probability. The strength of a correction cannot be predicted with the indicator.
For which symbols does the indicator work?
The indicator works exclusively for the following symbols:
S&P500: SPX, SPY, ES1!, US500 Index above MA50: S5FI
Russel2000: IWM, US2000, RTY1!, RUT, IWO Index above MA50: R2FI
NASDAQ100: NDX, NAS100, NQ1!, US100, QQQ Index above MA50: NDFI
NASDAQ: IXIC, ONEQ, QCN1!, NDAQ Index above MA50: NCFI
NYSE: XAX, NYA Index above MA50: MMFI
DowJones100: DJX, DJI, DIA, MYM1!, YM1! Index above MA50: DIFI
DowJonesComp: DOW, IYY Index above MA50: DCFI
Deutsch:
Dieser Indikator ist als Frühwarninstrument zur Einschätzung der Korrekturwahrscheinlichkeit im US-Aktienmarkt entwickelt worden. Er funktioniert am besten im Tages-Chart.
Funktion:
1.) „Index-line“
Der zugrunde liegende Aktienindex wird bezogen auf seine 52Wochen Hochs und Tiefs in eine Skala zwischen 0% und 100% umgerechnet. Dabei sind 100% Schlusskurs auf 52-Wochen Hoch und 0% Schlusskurs auf 52-Wochen Tief.
2.) „Stocks Above MA50“
Zu jedem Hauptaktienindex gibt es einen Index, der den Prozentwert der Aktien über Ihrem 50 gleitenden Durchschnitt ermittelt. Beim S&P 500 ist das z.B. der S5FI.
3.) „Divergence“
In einem effizienten Markt würden beide Linien (Index und Anzahl Aktien über dem 50 MA) mehr oder weniger synchron laufen. Ein neues Hoch im Index würde auch ein neues Hoch bei den Aktien, die über dem 50 gleitenden Durchschnitt notieren, bedeuten. Oft jedoch kündigt sich eine Korrektur im Index an, wenn die Anzahl der Aktien, die über ihrem 50 MA notieren kein neues, oder sogar ein niedrigeres Hoch machen, während der zu Grunde liegende Index ein neues Hoch markiert. Das Divergenz-Signal misst diese auseinanderlaufen der Indices. Je höher der Balken, umso stärker ist die Divergenz ausgeprägt.
Wie ist der Indikator zu lesen?
Wenn eine Divergenz auftritt, dann sollten die Stopps enger herangezogen werden. Es kann wie bei jedem Indikator zu Fehlsignalen kommen, da eine Divergenz nicht automatisch zu einer Korrektur führen muss. Die Wahrscheinlichkeit ist um so höher, je höher die Divergenz angezeigt wird. Die Stärke einer Korrektur kann mit dem Indikator nicht prognostiziert werden.
Für welche Symbole funktioniert der Indikator?
Der Indikator funktioniert ausschließlich für folgende Symbole:
S&P500: SPX, SPY, ES1!, US500 Index über MA50: S5FI
Russel2000: IWM, US2000, RTY1!, RUT, IWO Index über MA50: R2FI
NASDAQ100: NDX, NAS100, NQ1!, US100, QQQ Index über MA50: NDFI
NASDAQ: IXIC, ONEQ, QCN1!, NDAQ Index über MA50: NCFI
NYSE: XAX, NYA Index über MA50: MMFI
DowJones100: DJX, DJI, DIA, MYM1!, YM1! Index über MA50: DIFI
DowJonesComp: DOW, IYY Index über MA50: DCFI

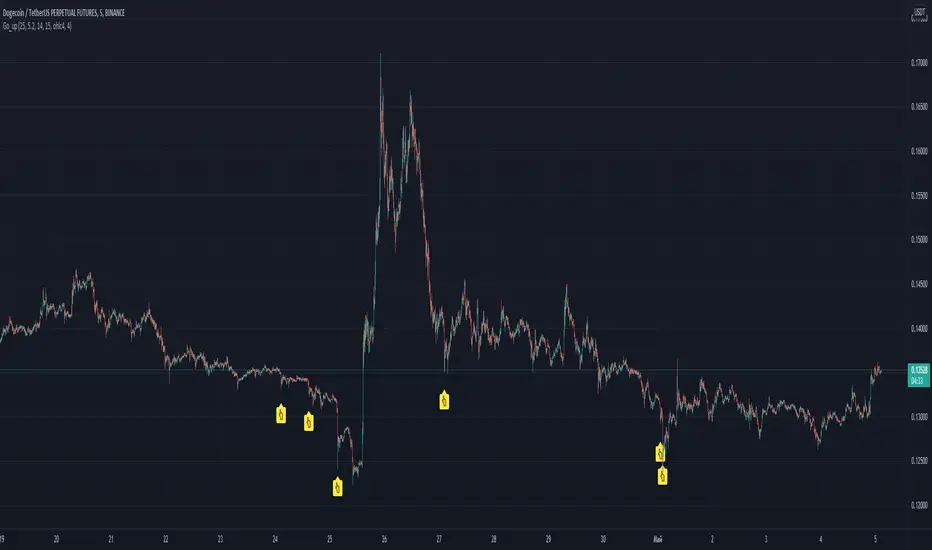
Go_up Hello. Our task is to find the local minimum. The trade is entered on the basis of RSI and SMA according to a specific formula, which is embedded in the code. When the RSI crosses the SMA upside down, a long position is entered. You can change the length of the RSI. The longer the length, the less frequent, but more accurate the entrance, and vice versa. You can use a different time frame. The default RSI length is 25 and the time frame is 15 minutes. Use hooks for auto trading, there is an alert. I recommend using a larger number of altcoins and with the default settings or TF 5 minutes. If you want to "scalp", then use the length 15-21 and take profit 0.5-2 percent. See the history of signals and you can make the optimal strategy for yourself. Due to the strong volatility, these settings are optimal. I use position averaging over history, additional purchase occurs no more than three times, before going into a plus. Entering a trade in notifications "once per bar". To exit, you can use scripts from other authors, for example, pivot / resistance points. No repainting. If anyone has any questions, write, I will answer in detail. good luck trading, dear friends!
TeoTrading 17-C.1 - 107. USA Algorithmic Trading Long SignalsThis indicator mark patterns that were successful in the past, based on Algorithmic Trading and backtesting.
This Script is for Private Use.
It was designed for Long Signals.
Was developed and tested with Nasdaq technology stocks and Argentinian ADRs.
Includes Real Time Stastistics.
No purchase recommendations are given. The user must do their own analysis to decide whether to buy.
"A" signal is to make the Analysis. Here the user will see a Yellow Candle.
"V" signal is to Sell. Here the user will see:
- A Green Candle: Sell with Gain using a fixed Stop Gain.
- A Blue Candle: Sell with Gain using a dynamic (variable) Stop Gain.
- A Fuchsia Candle: Sell with lost.
The Orange Candle indicates that a trade is open.
Includes Alerts.

USA VWAPFuture traders commonly watch both the globex VWAP (all time) and the US session VWAP (9:30am to 4:00pm). Trading view's built-in VWAP indicator plots the globex VWAP. The USA VWAP indicator overlays the US session VWAP (using hlc3) onto any futures asset. It works for stocks too, but it would be the exact same thing as using the builtin VWAP indicator.

USA SessionThe USA session (9:30am to 4:00pm) is the most volatile session during market hours. Because of this, previous day OHLC values during that time frame are important to stock traders. For future traders, these and the overnight high/low are important. This indicator overlays the open, previous day open, previous day close, previous day high and previous day low (of the USA session) onto most stock chart. And for most future charts, this indicator will also plot the overnight high and low.
How to use
Currently, this indicator is only intended to work on stock and future assets. I'm not sure what will happen when used with other assets, but that's not my problem. This will also only work on a 5 minute chart, but I am working to have it function with all intraday time frames. When viewing stocks, you have to turn off the Extended Hours view in chart settings, else the calculated values will be garbage.
Assuming your chart meets those 3 constraints, this indicator should work automatically, all values are displayed by default. It may take a while to process when you first add this indicator. If you are only viewing stocks, you may want to disable the overnight levels as they will always be n/a. When viewing stocks, levels are not drawn on the last bar for the US session (3:55pm) to avoid ugly connecting lines between sessions. If you want those lines to connect, it can be enables in the indicator settings.
If levels are not flat across the whole session or you are still experiencing difficulties/inconsistencies please review the known issues below.
Knows issues
This indicator breaks when the asset is missing data. If a bar is missing, this indicator will break and move to a different level that is no longer valid. You can tell a bar is missing because the time will jump, for example, from 2:15 to 2:25 instead of 2:20. Unfortunately, I think this is an issue with the data feed and I have no way of correcting this. From the test I have done with the data feed I have, this has not been a big problem with more popular assets, but results will vary. A more professional data feed may be required for consistent and proper results.
During my tests, I found that my future assets are always missing data from 3:10pm to 3:25pm. It was so consistent, I put code in to correct it. However, I'm not sure if other people will experience this same issue, or if the issue varies. Because of this, I there is a 'Fix missing data bug' input in the indicator settings that is enabled by default. If you are missing data from 3:10pm to 3:25pm on your futures chart (like myself) make sure this stays on. If you have data during this time, you need to turn that setting off.
This indicator only works when the USA session opens/closes at its regular time. Days that do no follow this rule may produce garbage levels. Don't worry, they will work fine the next day!

SPY BackgroundColors background green if AMEX:SPY 1 day performance is positive
Colors background red if AMEX:SPY 1 day performance is negative

SPY BackgroundColors background green if AMEX:SPY 1 day performance is positive
Colors background red if AMEX:SPY 1 day performance is negative