Innocent Heikin Ashi Ethereum StrategyHello there, im back!
If you are familiar with my previous scripts, this one will seem like the future's nostalgia!
Functionality:
As you can see, all candles are randomly colored. This has no deeper meaning, it should remind you to switch to Heikin Ashi. The Strategy works on standard candle stick charts, but should be used with Heikin Ashi to see the actual results. (Regular OHLC calculations are included.)
Same as in my previous scripts we import our PVSRA Data from @TradersReality open source Indicator.
With this data and the help of moving averages, we have got an edge in the market.
Signal Logic:
When a "violently green" candle appears (high buy volume + tick speed) above the 50 EMA indicates a change in trend and sudden higher prices. Depending on OHLC of the candle itself and volume, Take Profit and Stop Loss is calculated. (The price margin is the only adjustable setting). Additionally, to make this script as simple and easily useable as possible, all other adjustable variables have been already set to the best suitable value and the chart was kept plain, except for the actual entries and exits.
Basic Settings and Adjustables:
Main Input 1: TP and SL combined price range. (Double, Triple R:R equally.)
Trade Inputs: All standard trade size and contract settings for testing available.
Special Settings:
Checkbox 1: Calculate Signal in Heikin Ashi chart, including regular candle OHLC („Open, High, Low, Close“)
Checkbox 2/3: Calculate by order fill or every tick.
Checkbox 4: Possible to fill orders on bar close.
Timeframe and practical usage:
Made for the 5 Minute to 1 hour timeframe.
Literally ONLY works on Ethereum and more or less on Bitcoin.
EVERY other asset has absolute 0% profitability.
Have fun and share with your friends!
Thanks for using!
Example Chart:
Unique

FunctionPatternFrequencyLibrary "FunctionPatternFrequency"
Counts the word or integer number pattern frequency on a array.
reference:
rosettacode.org
count(pattern)
counts the number a pattern is repeated.
Parameters:
pattern : : array : array with patterns to be counted.
Returns:
array : list of unique patterns.
array : list of counters per pattern.
usage:
count(array.from('a','b','c','a','b','a'))
count(pattern)
counts the number a pattern is repeated.
Parameters:
pattern : : array : array with patterns to be counted.
Returns:
array : list of unique patterns.
array : list of counters per pattern.
usage:
count(array.from(1,2,3,1,2,1))

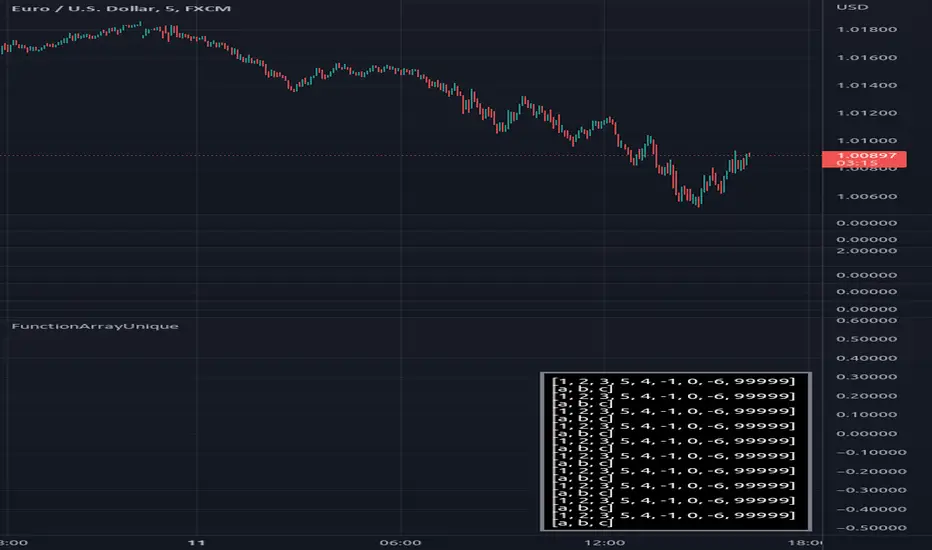
FunctionArrayUniqueLibrary "FunctionArrayUnique"
Method for retrieving the unique elements in a array.
for example would retrieve a array with ,
the elements retrieved will be sorted by its first seen index in
parent array.
note: float values have no precision option.
unique(source)
method for retrieving the unique elements in a array.
Parameters:
source : array source array to extract elements.
Returns: array unique elements in the source array.
unique(source)
method for retrieving the unique elements in a array.
Parameters:
source : array source array to extract elements.
Returns: array unique elements in the source array.
unique(source)
method for retrieving the unique elements in a array.
Parameters:
source : array source array to extract elements.
Returns: array unique elements in the source array.