P/B Ratio (Per Share) vs Median + Bollinger Band- 📝 This indicator highlights potential buying opportunities by analyzing the Price-to-Book (P/B) ratio in relation to Bollinger Bands and its historical median.
- 🎯 The goal is to provide a visually intuitive signal for value-oriented entries, especially when valuation compression aligns with historical context.
- 💡 Vertical green shading is applied when the P/B ratio drops below the lower Bollinger Band, which is calculated directly from the P/B ratio itself — not price. This condition often signals the ticker may be oversold.
- 🟢 Lighter green appears when the ratio is below the lower band but above the median, suggesting a possible shorter-term entry with slightly more risk.
- 🟢 Darker green appears when the ratio is both below the lower band and below the median, pointing to a potentially stronger, longer-term value entry.
- ⚠️ This logic was tested using 1 and 2-day time frames. It may not be as helpful in longer time frames, as the financial data TradingView pulls in begins in Q4 2017.
- ⚠️ Note: This script relies on financial data availability through TradingView. It may not function properly with certain tickers — especially ETFs, IPOs, or thinly tracked assets — where P/S ratio data is missing or incomplete.
- ⚠️ This indicator will not guarantee successful results. Use in conjunction with other indicators and do your due diligence.
- 🤖 This script was iteratively refined with the help of AI to ensure clean logic, minimalist design, and actionable signal clarity.
- 📢 Idea is based on the script "Historical PE ratio vs median" by haribotagada
- 💬 Questions, feedback, or suggestions? Drop a comment — I’d love to hear how you’re using it or what you'd like to see changed.
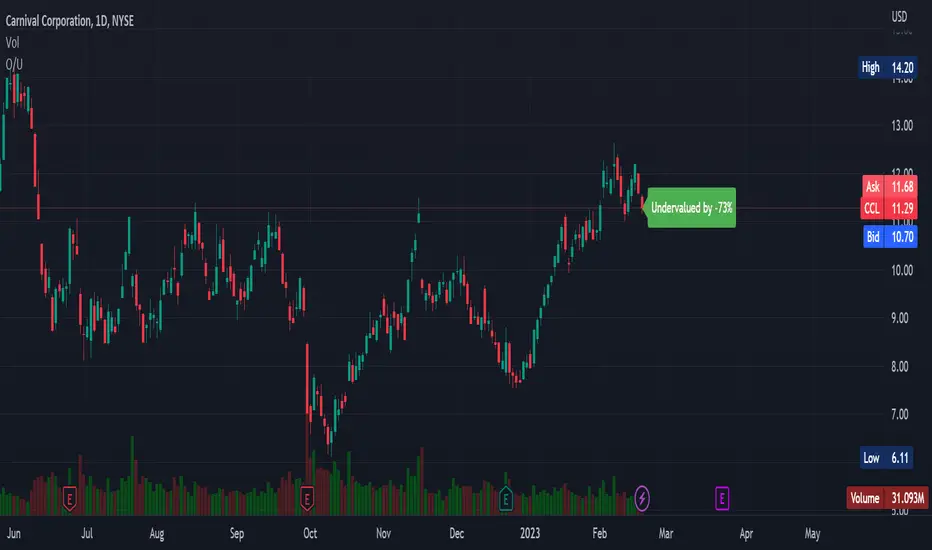
Undervalued

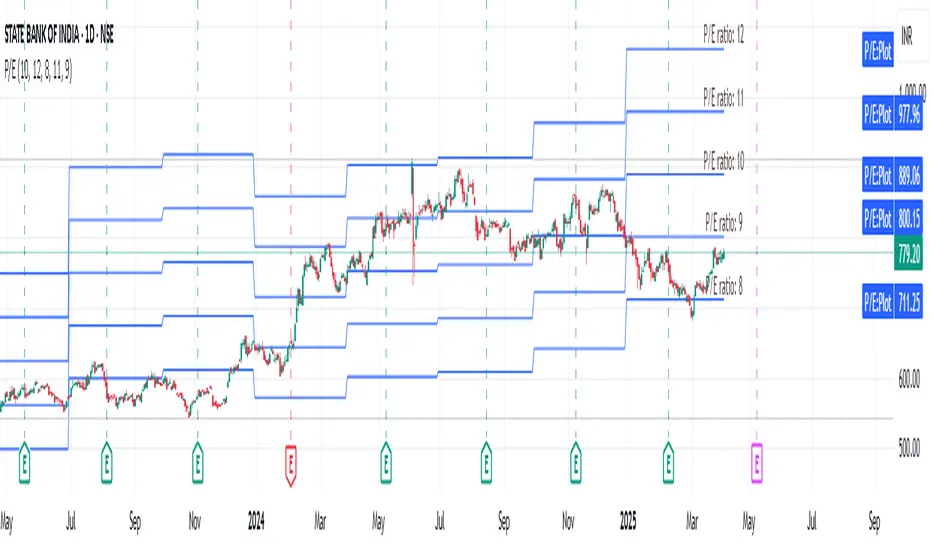
EPS GridIntroduction:
This simple indicator offers insights into the relationship between stock prices and earnings, aiding in the assessment of valuation dynamics during different periods.
Understanding Price-to-Earnings (P/E) Ratio:
The commonly used Price to Earnings (P/E) ratio, calculated as Current Price divided by Earnings Per Share (EPS) over the trailing 12 months (TTM), serves as a fundamental metric. Here, we use this formula to estimate a stock's price. For instance, multiplying EPS by 10 provides an approximation of the stock price with a P/E ratio of 10.
The Grid Concept:
Utilizing this principle, a visual grid is constructed to illustrate how stock prices correlate with earnings. This grid facilitates the identification of both potential bargains and overvalued stocks.
How to Utilize:
This indicator is pre-configured with earnings multiples of 10, 15, 20, and 25. Simply add it to your chart and observe whether earnings demonstrate consistent growth. If prices lag behind earnings, a potential catch-up phase may ensue in the future.
Happy Investing!
Embark on your investment journey armed with this indicator, and may it guide you towards informed decisions and successful ventures.
Overvalued/Undervalued OverlayThis indicator will tell you whether the security you are looking at is overvalued or undervalued using a company's total assets and their market cap. In theory, a company's total assets is everything that they own, which then should technically be how much the company is worth. Therefore, if the company's market cap is higher than their total assets, the indicator will read "Overvalued by X%". However, if the company's market cap is lower than their total assets, the indicator will read "Undervalued by X%". If you have any questions, feel free to let me know. Keep in mind that this indicator should be only used for long-term investing.
Benjamin Graham Net-Net AnalyserA simple indicator that displayers as a table, telling you whether or not the stock you have selected has a current price that is less than 67% of the company's net current asset value per share (NCAVPS) at its last reporting period (FQ, FY, TTM).
Benjamin Graham uses this 67% rule to decide whether or not a stock is significantly undervalued, and studies have shown that investing in companies whose share prices are less than 67% of their NCAVPS can be highly profitable, and will beat markets in the long run.
Feel free to use as you please or repurpose the code for your own projects.
