Divergence Strategy [Trendoscope®]🎲 Overview
The Divergence Strategy is a sophisticated TradingView strategy that enhances the Divergence Screener by adding automated trade signal generation, risk management, and trade visualization. It leverages the screener’s robust divergence detection to identify bullish, bearish, regular, and hidden divergences, then executes trades with precise entry, stop-loss, and take-profit levels. Designed for traders seeking automated trading solutions, this strategy offers customizable trade parameters and visual feedback to optimize performance across various markets and timeframes.
For core divergence detection features, including oscillator options, trend detection methods, zigzag pivot analysis, and visualization, refer to the Divergence Screener documentation. This description focuses on the strategy-specific enhancements for automated trading and risk management.
🎲 Strategy Features
🎯Automated Trade Signal Generation
Trade Direction Control : Restrict trades to long-only or short-only to align with market bias or strategy goals, preventing conflicting orders.
Divergence Type Selection : Choose to trade regular divergences (bullish/bearish), hidden divergences, or both, targeting reversals or trend continuations.
Entry Type Options :
Cautious : Enters conservatively at pivot points and exits quickly to minimize risk exposure.
Confident : Enters aggressively at the latest price and holds longer to capture larger moves.
Mixed : Combines conservative entries with delayed exits for a balanced approach.
Market vs. Stop Orders: Opt for market orders for instant execution or stop orders for precise price entry.
🎯 Enhanced Risk Management
Risk/Reward Ratio : Define a risk-reward ratio (default: 2.0) to set profit targets relative to stop-loss levels, ensuring consistent trade sizing.
Bracket Orders : Trades include entry, stop-loss, and take-profit levels calculated from divergence pivot points, tailored to the entry type and risk-reward settings.
Stop-Loss Placement : Stops are strategically set (e.g., at recent pivot or last price point) based on entry type, balancing risk and trade validity.
Order Cancellation : Optionally cancel pending orders when a divergence is broken (e.g., price moves past the pivot in the wrong direction), reducing invalid trades. This feature is toggleable for flexibility.
🎯 Trade Visualization
Target and Stop Boxes : Displays take-profit (lime) and stop-loss (orange) levels as boxes on the price chart, extending 10 bars forward for clear visibility.
Dynamic Trade Updates : Trade visualizations are added, updated, or removed as trades are executed, canceled, or invalidated, ensuring accurate feedback.
Overlay Integration : Trade levels overlay the price chart, complementing the screener’s oscillator-based divergence lines and labels.
🎯 Strategy Default Configuration
Capital and Sizing : Set initial capital (default: $1,000,000) and position size (default: 20% of equity) for realistic backtesting.
Pyramiding : Allows up to 4 concurrent trades, enabling multiple divergence-based entries in trending markets.
Commission and Margin : Accounts for commission (default: 0.01%) and margin (100% for long/short) to reflect trading costs.
Performance Optimization : Processes up to 5,000 bars dynamically, balancing historical analysis and real-time execution.
🎲 Inputs and Configuration
🎯Trade Settings
Direction : Select Long or Short (default: Long).
Divergence : Trade Regular, Hidden, or Both divergence types (default: Both).
Entry/Exit Type : Choose Cautious, Confident, or Mixed (default: Cautious).
Risk/Reward : Set the risk-reward ratio for profit targets (default: 2.0).
Use Market Order : Enable market orders for immediate entry (default: false, uses limit orders).
Cancel On Break : Cancel pending orders when divergence is broken (default: true).
🎯Inherited Settings
The strategy inherits all inputs from the Divergence Screener, including:
Oscillator Settings : Oscillator type (e.g., RSI, CCI), length, and external oscillator option.
Trend Settings : Trend detection method (Zigzag, MA Difference, External), MA type, and length.
Zigzag Settings : Zigzag length (fixed repaint = true).
🎲 Entry/Exit Types for Divergence Scenarios
The Divergence Strategy offers three Entry/Exit Type options—Cautious, Confident, and Mixed—which determine how trades are entered and exited based on divergence pivot points. This section explains how these settings apply to different divergence scenarios, with placeholders for screenshots to illustrate each case.
The divergence pattern forms after 3 pivots. The stop and entry levels are formed on one of these levels based on Entry/Exit types.
🎯Bullish Divergence (Reversal)
A bullish divergence occurs when price forms a lower low, but the oscillator forms a higher low, signaling a potential upward reversal.
💎 Cautious:
Entry : At the pivot high point for a conservative entry.
Exit : Stop-loss at the last pivot point (previous low that is higher than the current pivot low); take-profit at risk-reward ratio. Canceled if price breaks below the pivot (if Cancel On Break is enabled).
Behavior : Enters after confirmation and exits quickly to limit downside risk.
💎Confident:
Entry : At the last pivot low, (previous low which is higher than the current pivot low) for an aggressive entry.
Exit : Stop-loss at recent pivot low, which is the lowest point; take-profit at risk-reward ratio. Canceled if price breaks below the pivot. (lazy exit)
Behavior : Enters early to capture trend continuation, holding longer for gains.
💎Mixed:
Entry : At the pivot high point (conservative).
Exit : Stop-loss at the recent pivot point that has resulted in lower low (lazy exit). Canceled if price breaks below the pivot.
Behavior : Balances entry caution with extended holding for trend continuation.
🎯Bearish Divergence (Reversal)
A bearish divergence occurs when price forms a higher high, but the oscillator forms a lower high, indicating a potential downward reversal.
💎Cautious:
Entry : At the pivot low point (lower high) for a conservative short entry.
Exit : Stop-loss at the previous pivot high point (previous high); take-profit at risk-reward ratio. Canceled if price breaks above the pivot (if Cancel On Break is enabled).
Behavior : Enters conservatively and exits quickly to minimize risk.
💎Confident:
Entry : At the last price point (previous high) for an aggressive short entry.
Exit : Stop-loss at the pivot point; take-profit at risk-reward ratio. Canceled if price breaks above the pivot.
Behavior : Enters early to maximize trend continuation, holding longer.
💎Mixed:
Entry : At the previous piot high point (conservative).
Exit : Stop-loss at the last price point (delayed exit). Canceled if price breaks above the pivot.
Behavior : Combines conservative entry with extended holding for downtrend gains.
🎯Bullish Hidden Divergence (Continuation)
A bullish hidden divergence occurs when price forms a higher low, but the oscillator forms a lower low, suggesting uptrend continuation. In case of Hidden bullish divergence, b]Entry is always on the previous pivot high (unless it is a market order)
💎Cautious:
Exit : Stop-loss at the recent pivot low point (higher than previous pivot low); take-profit at risk-reward ratio. Canceled if price breaks below the pivot (if Cancel On Break is enabled).
Behavior : Enters after confirmation and exits quickly to limit downside risk.
💎Confident:
Exit : Stop-loss at previous pivot low, which is the lowest point; take-profit at risk-reward ratio. Canceled if price breaks below the pivot. (lazy exit)
Behavior : Enters early to capture trend continuation, holding longer for gains.
🎯Bearish Hidden Divergence (Continuation)
A bearish hidden divergence occurs when price forms a lower high, but the oscillator forms a higher high, suggesting downtrend continuation. In case of Hidden Bearish divergence, b]Entry is always on the previous pivot low (unless it is a market order)
💎Cautious:
Exit : Stop-loss at the latest pivot high point (which is a lower high); take-profit at risk-reward ratio. Canceled if price breaks above the pivot (if Cancel On Break is enabled).
Behavior : Enters conservatively and exits quickly to minimize risk.
💎Confident/Mixed:
Exit : Stop-loss at the previous pivot high point; take-profit at risk-reward ratio. Canceled if price breaks above the pivot.
Behavior : Uses the late exit point to hold longer.
🎲 Usage Instructions
🎯Add to Chart:
Add the Divergence Strategy to your TradingView chart.
The oscillator and divergence signals appear in a separate pane, with trade levels (target/stop boxes) overlaid on the price chart.
🎯Configure Settings:
Adjust trade settings (direction, divergence type, entry type, risk-reward, market orders, cancel on break).
Modify inherited Divergence Screener settings (oscillator, trend method, zigzag length) as needed.
Enable/disable alerts for divergence notifications.
🎯Interpret Signals:
Long Trades: Triggered on bullish or bullish hidden divergences (if allowed), shown with green/lime lines and labels.
Short Trades: Triggered on bearish or bearish hidden divergences (if allowed), shown with red/orange lines and labels.
Monitor lime (target) and orange (stop) boxes for trade levels.
Review strategy performance metrics (e.g., profit/loss, win rate) in the strategy tester.
🎯Backtest and Optimize:
Use TradingView’s strategy tester to evaluate performance on historical data.
Fine-tune risk-reward, entry type, position sizing, and cancellation settings to suit your market and timeframe.
For questions, suggestions, or support, contact Trendoscope via TradingView or official support channels. Stay tuned for updates and enhancements to the Divergence Strategy!
Trendoscope

Divergence Screener [Trendoscope®]🎲Overview
The Divergence Screener is a powerful TradingView indicator designed to detect and visualize bullish and bearish divergences, including hidden divergences, between price action and a user-selected oscillator. Built with flexibility in mind, it allows traders to customize the oscillator type, trend detection method, and other parameters to suit various trading strategies. The indicator is non-overlay, displaying divergence signals directly on the oscillator plot, with visual cues such as lines and labels on the chart for easy identification.
This indicator is ideal for traders seeking to identify potential reversal or continuation signals based on price-oscillator divergences. It supports multiple oscillators, trend detection methods, and alert configurations, making it versatile for different markets and timeframes.
🎲Features
🎯Customizable Oscillator Selection
Built-in Oscillators : Choose from a variety of oscillators including RSI, CCI, CMO, COG, MFI, ROC, Stochastic, and WPR.
External Oscillator Support : Users can input an external oscillator source, allowing integration with custom or third-party indicators.
Configurable Length : Adjust the oscillator’s period (e.g., 14 for RSI) to fine-tune sensitivity.
🎯Divergence Detection
The screener identifies four types of divergences:
Bullish Divergence : Price forms a lower low, but the oscillator forms a higher low, signaling potential upward reversal.
Bearish Divergence : Price forms a higher high, but the oscillator forms a lower high, indicating potential downward reversal.
Bullish Hidden Divergence : Price forms a higher low, but the oscillator forms a lower low, suggesting trend continuation in an uptrend.
Bearish Hidden Divergence : Price forms a lower high, but the oscillator forms a higher high, suggesting trend continuation in a downtrend.
🎯Flexible Trend Detection
The indicator offers three methods to determine the trend context for divergence detection:
Zigzag : Uses zigzag pivots to identify trends based on higher highs (HH), higher lows (HL), lower highs (LH), and lower lows (LL).
MA Difference : Calculates the trend based on the difference in a moving average (e.g., SMA, EMA) between divergence pivots.
External Trend Signal : Allows users to input an external trend signal (positive for uptrend, negative for downtrend) for custom trend analysis.
🎯Zigzag-Based Pivot Analysis
Customizable Zigzag Length : Adjust the zigzag length (default: 13) to control the sensitivity of pivot detection.
Repaint Option : Choose whether divergence lines repaint based on the latest data or wait for confirmed pivots, balancing responsiveness and reliability.
🎯Visual and Alert Features
Divergence Visualization : Divergence lines are drawn between price pivots and oscillator pivots, color-coded for easy identification:
Bullish Divergence : Green
Bearish Divergence : Red
Bullish Hidden Divergence : Lime
Bearish Hidden Divergence : Orange
Labels and Tooltips : Labels (e.g., “D” for divergence, “H” for hidden) appear on price and oscillator pivots, with tooltips providing detailed information such as price/oscillator values, ratios, and pivot directions.
Alerts : Configurable alerts for each divergence type (bullish, bearish, bullish hidden, bearish hidden) trigger on bar close, ensuring timely notifications.
🎲 How It Works
🎯Oscillator Calculation
The indicator calculates the selected oscillator (or uses an external source) and plots it on the chart.
Oscillator values are stored in a map for reference during divergence calculations.
🎯Pivot Detection
A zigzag algorithm identifies pivots in the oscillator data, with configurable length and repainting options.
Price and oscillator pivots are compared to detect divergences based on their direction and ratio.
🎯Divergence Identification
The indicator compares price and oscillator pivot directions (HH, HL, LH, LL) to identify divergences.
Trend context is determined using the selected method (Zigzag, MA Difference, or External).
Divergences are classified as bullish, bearish, bullish hidden, or bearish hidden based on price-oscillator relationships and trend direction.
🎯Visualization and Alerts
Valid divergences are drawn as lines connecting price and oscillator pivots, with corresponding labels.
Alerts are triggered for allowed divergence types, providing detailed information via tooltips.
🎯Validation
Divergence lines are validated to ensure no intermediate bars violate the divergence condition, enhancing signal reliability.
🎲 Usage Instructions as Indicator
🎯Add to Chart:
Add the “Divergence Screener ” to your TradingView chart.
The indicator appears in a separate pane below the price chart, plotting the oscillator and divergence signals.
🎯Configure Settings:
Adjust the oscillator type and length to match your trading style.
Select a trend detection method and configure related parameters (e.g., MA type/length or external signal).
Set the zigzag length and repainting preference.
Enable/disable alerts for specific divergence types.
I🎯nterpret Signals:
Bullish Divergence (Green) : Look for potential buy opportunities in a downtrend.
Bearish Divergence (Red) : Consider sell opportunities in an uptrend.
Bullish Hidden Divergence (Lime) : Confirm continuation in an uptrend.
Bearish Hidden Divergence (Orange): Confirm continuation in a downtrend.
Use tooltips on labels to review detailed pivot and divergence information.
🎯Set Alerts:
Create alerts for each divergence type to receive notifications via TradingView’s alert system.
Alerts include detailed text with price, oscillator, and divergence information.
🎲 Example Scenarios as Indicator
🎯 With External Oscillator (Use MACD Histogram as Oscillator)
In order to use MACD as an oscillator for divergence signal instead of the built in options, follow these steps.
Load MACD Indicator from Indicator library
From Indicator settings of Divergence Screener, set Use External Oscillator and select MACD Histograme from the dropdown
You can now see that the oscillator pane shows the data of selected MACD histogram and divergence signals are generated based on the external MACD histogram data.
🎯 With External Trend Signal (Supertrend Ladder ATR)
Now let's demonstrate how to use external direction signals using Supertrend Ladder ATR indicator. Please note that in order to use the indicator as trend source, the indicator should return positive integer for uptrend and negative integer for downtrend. Steps are as follows:
Load the desired trend indicator. In this example, we are using Supertrend Ladder ATR
From the settings of Divergence Screener, select "External" as Trend Detection Method
Select the trend detection plot Direction from the dropdown. You can now see that the divergence signals will rely on the new trend settings rather than the built in options.
🎲 Using the Script with Pine Screener
The primary purpose of the Divergence Screener is to enable traders to scan multiple instruments (e.g., stocks, ETFs, forex pairs) for divergence signals using TradingView’s Pine Screener, facilitating efficient comparison and identification of trading opportunities.
To use the Divergence Screener as a screener, follow these steps:
Add to Favorites : Add the Divergence Screener to your TradingView favorites to make it available in the Pine Screener.
Create a Watchlist : Build a watchlist containing the instruments (e.g., stocks, ETFs, or forex pairs) you want to scan for divergences.
Access Pine Screener : Navigate to the Pine Screener via TradingView’s main menu: Products -> Screeners -> Pine, or directly visit tradingview.com/pine-screener/.
Select Watchlist : Choose the watchlist you created from the Watchlist dropdown in the Pine Screener interface.
Choose Indicator : Select Divergence Screener from the Choose Indicator dropdown.
Configure Settings : Set the desired timeframe (e.g., 1 hour, 1 day) and adjust indicator settings such as oscillator type, zigzag length, or trend detection method as needed.
Select Filter Criteria : Select the condition on which the watchlist items needs to be filtered. Filtering can only be done on the plots defined in the script.
Run Scan : Press the Scan button to display divergence signals across the selected instruments. The screener will show which instruments exhibit bullish, bearish, bullish hidden, or bearish hidden divergences based on the configured settings.
🎲 Limitations and Possible Future Enhancements
Limitations are
Custom input for oscillator and trend detection cannot be used in pine screener.
Pine screener has max 500 bars available.
Repaint option is by default enabled. When in repaint mode expect the early signal but the signals are prone to repaint.
Possible future enhancements
Add more built-in options for oscillators and trend detection methods so that dependency on external indicators is limited
Multi level zigzag support

SIP Evaluator and Screener [Trendoscope®]The SIP Evaluator and Screener is a Pine Script indicator designed for TradingView to calculate and visualize Systematic Investment Plan (SIP) returns across multiple investment instruments. It is tailored for use in TradingView's screener, enabling users to evaluate SIP performance for various assets efficiently.
🎲 How SIP Works
A Systematic Investment Plan (SIP) is an investment strategy where a fixed amount is invested at regular intervals (e.g., monthly or weekly) into a financial instrument, such as stocks, mutual funds, or ETFs. The goal is to build wealth over time by leveraging the power of compounding and mitigating the impact of market volatility through disciplined, consistent investing. Here’s a breakdown of how SIPs function:
Regular Investments : In an SIP, an investor commits to investing a fixed sum at predefined intervals, regardless of market conditions. This consistency helps inculcate a habit of saving and investing.
Cost Averaging : By investing a fixed amount regularly, investors purchase more units when prices are low and fewer units when prices are high. This approach, known as dollar-cost averaging, reduces the average cost per unit over time and mitigates the risk of investing a large amount at a peak price.
Compounding Benefits : Returns generated from the invested amount (e.g., capital gains or dividends) are reinvested, leading to exponential growth over the long term. The longer the investment horizon, the greater the potential for compounding to amplify returns.
Dividend Reinvestment : In some SIPs, dividends received from the underlying asset can be reinvested to purchase additional units, further enhancing returns. Taxes on dividends, if applicable, may reduce the reinvested amount.
Flexibility and Accessibility : SIPs allow investors to start with small amounts, making them accessible to a wide range of individuals. They also offer flexibility in terms of investment frequency and the ability to adjust or pause contributions.
In the context of the SIP Evaluator and Screener , the script simulates an SIP by calculating the number of units purchased with each fixed investment, factoring in commissions, dividends, taxes and the chosen price reference (e.g., open, close, or average prices). It tracks the cumulative investment, equity value, and dividends over time, providing a clear picture of how an SIP would perform for a given instrument. This helps users understand the impact of regular investing and make informed decisions when comparing different assets in TradingView’s screener. It offers insights into key metrics such as total invested amount, dividends received, equity value, and the number of installments, making it a valuable resource for investors and traders interested in understanding long-term investment outcomes.
🎲 Key Features
Customizable Investment Parameters: Users can define the recurring investment amount, price reference (e.g., open, close, HL2, HLC3, OHLC4), and whether fractional quantities are allowed.
Commission Handling: Supports both fixed and percentage-based commission types, adjusting calculations accordingly.
Dividend Reinvestment: Optionally reinvests dividends after a user-specified period, with the ability to apply tax on dividends.
Time-Bound Analysis: Allows users to set a start year for the analysis, enabling historical performance evaluation.
Flexible Dividend Periods: Dividends can be evaluated based on bars, days, weeks, or months.
Visual Outputs: Plots key metrics like total invested amount, dividends, equity value, and remainder, with customizable display options for clarity in the data window and chart.
🎲 Using the script as an indicator on Tradingview Supercharts
In order to use the indicator on charts, do the following.
Load the instrument of your choice - Preferably a stable stocks, ETFs.
Chose monthly timeframe as lower timeframes are insignificant in this type of investment strategy
Load the indicator SIP Evaluator and Screener and set the input parameters as per your preference.
Indicator plots, investment value, dividends and equity on the chart.
🎲 Visualizations
Installments : Displays the number of SIP installments (gray line, visible in the data window).
Invested Amount : Shows the cumulative amount invested, excluding reinvested dividends (blue area plot).
Dividends : Tracks total dividends received (green area plot).
Equity : Represents the current market value of the investment based on the closing price (purple area plot).
Remainder : Indicates any uninvested cash after each installment (gray line, visible in the data window).
🎲 Deep dive into the settings
The SIP Evaluator and Screener offers a range of customizable settings to tailor the Systematic Investment Plan (SIP) simulation to your preferences. Below is an explanation of each setting, its purpose, and how it impacts the analysis:
🎯 Duration
Start Year (Default: 2020) : Specifies the year from which the SIP calculations begin. When Start Year is enabled via the timebound option, the script only considers data from the specified year onward. This is useful for analyzing historical SIP performance over a defined period. If disabled, the script uses all available data.
Timebound (Default: False) : A toggle to enable or disable the Start Year restriction. When set to False, the SIP calculation starts from the earliest available data for the instrument.
🎯 Investment
Recurring Investment (Default: 1000.0) : The fixed amount invested in each SIP installment (e.g., $1000 per period). This represents the regular contribution to the SIP and directly influences the total invested amount and quantity purchased.
Allow Fractional Qty (Default: True) : When enabled, the script allows the purchase of fractional units (e.g., 2.35 shares). If disabled, only whole units are purchased (e.g., 2 shares), with any remaining funds carried forward as Remainder. This setting impacts the precision of investment allocation.
Price Reference (Default: OPEN): Determines the price used for purchasing units in each SIP installment. Options include:
OPEN : Uses the opening price of the bar.
CLOSE : Uses the closing price of the bar.
HL2 : Uses the average of the high and low prices.
HLC3 : Uses the average of the high, low, and close prices.
OHLC4 : Uses the average of the open, high, low, and close prices. This setting affects the cost basis of each purchase and, consequently, the total quantity and equity value.
🎯 Commission
Commission (Default: 3) : The commission charged per SIP installment, expressed as either a fixed amount (e.g., $3) or a percentage (e.g., 3% of the investment). This reduces the amount available for purchasing units.
Commission Type (Default: Fixed) : Specifies how the commission is calculated:
Fixed ($) : A flat fee is deducted per installment (e.g., $3).
Percentage (%) : A percentage of the investment amount is deducted as commission (e.g., 3% of $1000 = $30). This setting affects the net amount invested and the overall cost of the SIP.
🎯 Dividends
Apply Tax On Dividends (Default: False) : When enabled, a tax is applied to dividends before they are reinvested or recorded. The tax rate is set via the Dividend Tax setting.
Dividend Tax (Default: 47) : The percentage of tax deducted from dividends if Apply Tax On Dividends is enabled (e.g., 47% tax reduces a $100 dividend to $53). This reduces the amount available for reinvestment or accumulation.
Reinvest Dividends After (Default: True, 2) : When enabled, dividends received are reinvested to purchase additional units after a specified period (e.g., 2 units of time, defined by Dividends Availability). If disabled, dividends are tracked but not reinvested. Reinvestment increases the total quantity and equity over time.
Dividends Availability (Default: Bars) : Defines the time unit for evaluating when dividends are available for reinvestment. Options include:
Bars : Based on the number of chart bars.
Weeks : Based on weeks.
Months : Based on months (approximated as 30.5 days). This setting determines the timing of dividend reinvestment relative to the Reinvest Dividends After period.
🎯 How Settings Interact
These settings work together to simulate a realistic SIP. For example, a $1000 recurring investment with a 3% commission and fractional quantities enabled will calculate the number of units purchased at the chosen price reference after deducting the commission. If dividends are reinvested after 2 months with a 47% tax, the script fetches dividend data, applies the tax, and adds the net dividend to the investment amount for that period. The Start Year and Timebound settings ensure the analysis aligns with the desired timeframe, while the Dividends Availability setting fine-tunes dividend reinvestment timing.
By adjusting these settings, users can model different SIP scenarios, compare performance across instruments in TradingView’s screener, and gain insights into how commissions, dividends, and price references impact long-term returns.
🎲 Using the script with Pine Screener
The main purpose of developing this script is to use it with Tradingview Pine Screener so that multiple ETFs/Funds can be compared.
In order to use this as a screener, the following things needs to be done.
Add SIP Evaluator and Screener to your favourites (Required for it to be added in pine screener)
Create a watch list containing required instruments to compare
Open pine screener from Tradingview main menu Products -> Screeners -> Pine or simply load the URL - www.tradingview.com
Select the watchlist created from Watchlist dropdown.
Chose the SIP Evaluator and Screener from the "Choose Indicator" dropdown
Set timeframe to 1 month and update settings as required.
Press scan to display collected data on the screener.
🎲 Use Case
This indicator is ideal for educational purposes, allowing users to experiment with SIP strategies across different instruments. It can be applied in TradingView’s screener to compare SIP performance for stocks, ETFs, or other assets, helping users understand how factors like commissions, dividends, and price references impact returns over time.

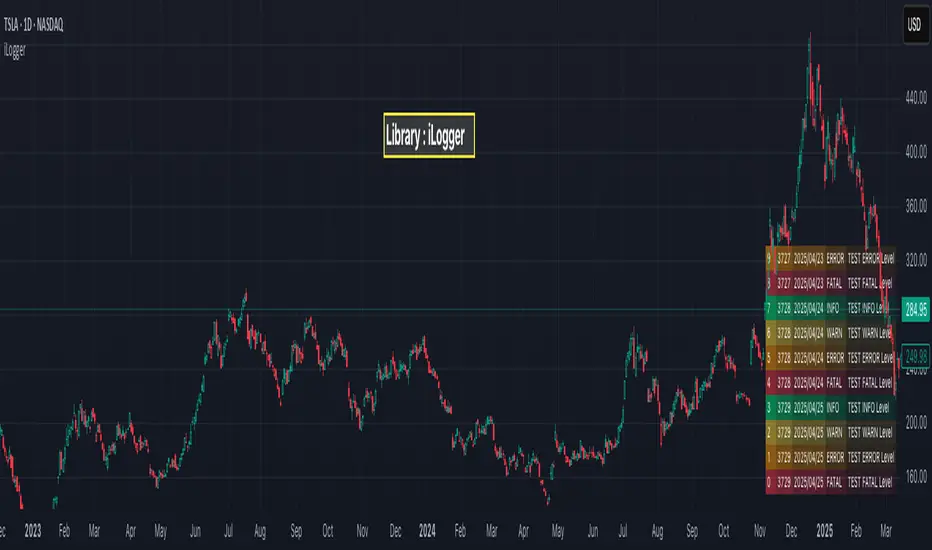
iLoggerLibrary "iLogger"
Logger Library based on types and methods.
method init(this)
init will initialize logger table and log stream array
Namespace types: Logger
Parameters:
this (Logger) : Logger object
Returns: void
method getLogger(level)
Namespace types: series LogLevel
Parameters:
level (series LogLevel)
method setPage(this, pageNumber)
setPage will set current page number of logs to display
Namespace types: Logger
Parameters:
this (Logger) : Logger object
pageNumber (int) : - Page number of logs to display
Returns: void
method nextPage(this)
nextPage will incremement page number to display on screen
Namespace types: Logger
Parameters:
this (Logger) : Logger object
Returns: void
method previousPage(this)
previousPage will decrement page number to display on screen
Namespace types: Logger
Parameters:
this (Logger) : Logger object
Returns: void
method log(this, level, message)
log will record message to be logged and repopulate logs displayed
Namespace types: Logger
Parameters:
this (Logger) : Logger object
level (series LogLevel) : logging level. Can be `TRACE`, `DEBUG`, `INFO`, `WARN`, `ERROR`, `FATAL`, `CRITICAL`. Logs only if log level is higher than Loggers minimul log level set
message (string) : log message to be recorded
Returns: void
method trace(this, message)
trace will record message to be logged with level 'TRACE'
Namespace types: Logger
Parameters:
this (Logger) : Logger object
message (string) : log message to be recorded
Returns: void
method debug(this, message)
debug will record message to be logged with level 'DEBUG'
Namespace types: Logger
Parameters:
this (Logger) : Logger object
message (string) : log message to be recorded
Returns: void
method info(this, message)
info will record message to be logged with level 'INFO'
Namespace types: Logger
Parameters:
this (Logger) : Logger object
message (string) : log message to be recorded
Returns: void
method warn(this, message)
warn will record message to be logged with level 'WARN'
Namespace types: Logger
Parameters:
this (Logger) : Logger object
message (string) : log message to be recorded
Returns: void
method error(this, message)
error will record message to be logged with level 'ERROR'
Namespace types: Logger
Parameters:
this (Logger) : Logger object
message (string) : log message to be recorded
Returns: void
method fatal(this, message)
fatal will record message to be logged with level 'FATAL'
Namespace types: Logger
Parameters:
this (Logger) : Logger object
message (string) : log message to be recorded
Returns: void
Log
Log Object holding log entry
Fields:
level (series LogLevel) : Logging level
message (series string) : Logging message
bartime (series int) : bar time at which log is recorded
bar (series int) : bar index at which log is recorded
Logger
Logger object which can be used for logging purposes
Fields:
position (series string) : position on chart where logs can be shown. Valid values are table position values. Make sure that the script does not have any other table at this position
pageSize (series int) : size of each page of logs which can be shown on UI. Default is 10
maxEntries (series int) : max size logs to be stored
pageNumber (series int) : current page number of logs to display on chart
textSize (series string) : size of text on debug table to be shown. default is size.small. Other options - size.tiny, size.normal, size.large, size.huge, size.auto
textColor (series color) : text color of debug messages. Default is color.white
showOnlyLast (series bool) : If set, shows the logs derived only from last bar. Default is true
minimumLevel (series LogLevel) : Minimum level of logs to be considered for logging.
realTime (series bool) : Print logs based on real time bar. This should be set to true for debugging indicators and false for debugging strategies.
debugTable (series table) : table containing debug messages. It will be set in init method. Hence no need to pass this in constructor
logs (array) : Array of Log containing logging messages. It will be set in init method. Hence no need to pass this in constructor
reversalchartpatternsLibrary "reversalchartpatterns"
User Defined Types and Methods for reversal chart patterns - Double Top, Double Bottom, Triple Top, Triple Bottom, Cup and Handle, Inverted Cup and Handle, Head and Shoulders, Inverse Head and Shoulders
method delete(this)
Deletes the drawing components of ReversalChartPatternDrawing object
Namespace types: ReversalChartPatternDrawing
Parameters:
this (ReversalChartPatternDrawing) : ReversalChartPatternDrawing object
Returns: current ReversalChartPatternDrawing object
method delete(this)
Deletes the drawing components of ReversalChartPattern object. In turn calls the delete of ReversalChartPatternDrawing
Namespace types: ReversalChartPattern
Parameters:
this (ReversalChartPattern) : ReversalChartPattern object
Returns: current ReversalChartPattern object
method lpush(this, obj, limit, deleteOld)
Array push with limited number of items in the array. Old items are deleted when new one comes and exceeds the limit
Namespace types: array
Parameters:
this (array) : array object
obj (ReversalChartPattern) : ReversalChartPattern object which need to be pushed to the array
limit (int) : max items on the array. Default is 10
deleteOld (bool) : If set to true, also deletes the drawing objects. If not, the drawing objects are kept but the pattern object is removed from array. Default is false.
Returns: current ReversalChartPattern object
method draw(this)
Draws the components of ReversalChartPatternDrawing
Namespace types: ReversalChartPatternDrawing
Parameters:
this (ReversalChartPatternDrawing) : ReversalChartPatternDrawing object
Returns: current ReversalChartPatternDrawing object
method draw(this)
Draws the components of ReversalChartPatternDrawing within the ReversalChartPattern object.
Namespace types: ReversalChartPattern
Parameters:
this (ReversalChartPattern) : ReversalChartPattern object
Returns: current ReversalChartPattern object
method scan(zigzag, patterns, errorPercent, shoulderStart, shoulderEnd, allowedPatterns, offset)
Scans zigzag for ReversalChartPattern occurences
Namespace types: zg.Zigzag
Parameters:
zigzag (Zigzag type from Trendoscope/Zigzag/11) : ZigzagTypes.Zigzag object having array of zigzag pivots and other information on each pivots
patterns (array) : Existing patterns array. Used for validating duplicates
errorPercent (float) : Error threshold for considering ratios. Default is 13
shoulderStart (float) : Starting range of shoulder ratio. Used for identifying shoulders, handles and necklines
shoulderEnd (float) : Ending range of shoulder ratio. Used for identifying shoulders, handles and necklines
allowedPatterns (array) : array of int containing allowed pattern types
offset (int) : Offset of zigzag to consider only confirmed pivots
Returns: int pattern type
method createPattern(zigzag, patternType, patternColor, properties, offset)
Create Pattern from ZigzagTypes.Zigzag object
Namespace types: zg.Zigzag
Parameters:
zigzag (Zigzag type from Trendoscope/Zigzag/11) : ZigzagTypes.Zigzag object having array of zigzag pivots and other information on each pivots
patternType (int) : Type of pattern being created. 1 - Double Tap, 2 - Triple Tap, 3 - Cup and Handle, 4 - Head and Shoulders
patternColor (color) : Color in which the patterns are drawn
properties (ReversalChartTradeProperties)
offset (int)
Returns: ReversalChartPattern object created
method getName(this)
get pattern name of ReversalChartPattern object
Namespace types: ReversalChartPattern
Parameters:
this (ReversalChartPattern) : ReversalChartPattern object
Returns: string name of the pattern
method getDescription(this)
get consolidated description of ReversalChartPattern object
Namespace types: ReversalChartPattern
Parameters:
this (ReversalChartPattern) : ReversalChartPattern object
Returns: string consolidated description
method init(this)
initializes the ReversalChartPattern object and creates sub object types
Namespace types: ReversalChartPattern
Parameters:
this (ReversalChartPattern) : ReversalChartPattern object
Returns: ReversalChartPattern current object
ReversalChartPatternDrawing
Type which holds the drawing objects for Reversal Chart Pattern Types
Fields:
patternLines (array type from Trendoscope/Drawing/2) : array of Line objects representing pattern
entry (Line type from Trendoscope/Drawing/2) : Entry price Line
targets (array type from Trendoscope/Drawing/2)
stop (Line type from Trendoscope/Drawing/2) : Stop price Line
patternLabel (Label type from Trendoscope/Drawing/2)
ReversalChartTradeProperties
Trade properties of ReversalChartPattern
Fields:
riskAdjustment (series float) : Risk Adjustment for calculation of stop
useFixedTarget (series bool) : Boolean flag saying use fixed target type wherever possible. If fixed target type is not possible, then risk reward/fib ratios are used for calculation of targets
variableTargetType (series int) : Integer value which defines whether to use fib based targets or risk reward based targets. 1 - Risk Reward, 2 - Fib Ratios
variableTargetRatios (array) : Risk reward or Fib Ratios to be used for calculation of targets when fixed target is not possible or not enabled
entryPivotForWm (series int) : which Pivot should be considered as entry point for WM patterns. 0 refers to the latest breakout pivot where as 5 refers to initial pivot of the pattern
ReversalChartPattern
Reversal Chart Pattern master type which holds the pattern components, drawings and trade details
Fields:
pivots (array type from Trendoscope/Zigzag/11) : Array of Zigzag Pivots forming the pattern
patternType (series int) : Defines the main type of pattern 1 - Double Tap, 1 - Triple Tap, 3 - Cup and Handle, 4 - Head and Shoulders, 5- W/M Patterns, 6 - Full Trend, 7 - Half Trend
patternColor (series color) : Color in which the pattern will be drawn on chart
properties (ReversalChartTradeProperties)
drawing (ReversalChartPatternDrawing) : ReversalChartPatternDrawing object which holds the drawing components
trade (Trade type from Trendoscope/TradeTracker/1) : TradeTracker.Trade object holding trade components

TradeTrackerLibrary "TradeTracker"
Simple Library for tracking trades
method track(this)
tracks trade when called on every bar
Namespace types: Trade
Parameters:
this (Trade) : Trade object
Returns: current Trade object
Trade
Has the constituents to track trades generated by any method.
Fields:
id (series int)
direction (series int) : Trade direction. Positive values for long and negative values for short trades
initialEntry (series float) : Initial entry price. This value will not change even if the entry is changed in the lifecycle of the trade
entry (series float) : Updated entry price. Allows variations to initial calculated entry. Useful in cases of trailing entry.
initialStop (series float) : Initial stop. Similar to initial entry, this is the first calculated stop for the lifecycle of trade.
stop (series float) : Trailing Stop. If there is no trailing, the value will be same as that of initial trade
targets (array) : array of target values.
startBar (series int) : bar index of starting bar. Set by default when object is created. No need to alter this after that.
endBar (series int) : bar index of last bar in trade. Set by tracker on each execution
startTime (series int) : time of the start bar. Set by default when object is created. No need to alter this after that.
endTime (series int) : time of the ending bar. Updated by tracking method.
status (series int) : Integer parameter to track the status of the trade
retest (series bool) : Boolean parameter to notify if there was retest of the entry price
projectiontrackingLibrary "projectiontracking"
Library contains few data structures and methods for tracking harmonic patterns and projections via pinescript.
method erase(this)
erase Harmonic Projection Drawing
Namespace types: HarmonicProjectionDrawing
Parameters:
this (HarmonicProjectionDrawing) : HarmonicProjectionDrawing object
Returns: void
method erase(this)
erase HarmonicProjection
Namespace types: HarmonicProjection
Parameters:
this (HarmonicProjection) : HarmonicProjection object
Returns: void
method draw(this)
draw HarmonicProjection
Namespace types: HarmonicProjection
Parameters:
this (HarmonicProjection) : HarmonicProjection object
Returns: HarmonicProjection object
method getRanges(projectionPrzRanges, dir)
Convert PRZRange to Projection ranges
Namespace types: array
Parameters:
projectionPrzRanges (array type from Trendoscope/HarmonicMapLib/1) : array of PrzRange objects
dir (int) : Projection direction
Returns: array
ProjectionRange
Harmonic Projection Range
Fields:
patterns (array) : array of pattern names
start (series float) : Start Range
end (series float) : End Range
status (series int) : Projection Status
ProjectionProperties
Harmonic Projection Properties
Fields:
fillMajorTriangles (series bool) : Use linefill for major triangles
fillMinorTriangles (series bool) : Use linefill for minor triangles
majorFillTransparency (series int) : transparency of major triangles
minorFillTransparency (series int) : transparency of minor triangles
showXABC (series bool) : Show XABC labels
lblSizePivots (series string) : Pivot labels size
showRatios (series bool) : Show ratio labels
useLogScaleForScan (series bool) : Log scale is used for scanning projections
activateOnB (series bool) : Activate projections on reaching B
activationRatio (series float) : Use activation ratio for activation
confirmationRatio (series float) : Confirmation ratio of projection before removal
HarmonicProjectionDrawing
Harmonic Projection Projection drawing objects
Fields:
xa (series line) : line xa
ab (series line) : line ab
bc (series line) : line bc
xb (series line) : line xb
ac (series line) : line ac
x (series label) : Pivot label x
a (series label) : Pivot label a
b (series label) : Pivot label b
c (series label) : Pivot label c
xabRatio (series label) : Label XAB Ratio
abcRatio (series label) : Label ABC Ratio
HarmonicProjection
Harmonic Projection Projection object
Fields:
patternId (series int) : id of the pattern
dir (series int) : projection direction
x (chart.point) : Pivot X
a (chart.point) : Pivot A
b (chart.point) : Pivot B
c (chart.point) : Pivot C
patternColor (series color) : Color in which pattern is displayed
przRange (PrzRange type from Trendoscope/HarmonicMapLib/1) : PRZ Range
activationPrice (series float) : Projection activation price
reversalPrice (series float) : Projection reversal price
status (series int) : Projection status
properties (ProjectionProperties) : Projection properties
projectionRanges (array) : array of Projection Ranges
initialD (series float) : Initial D pivot
d (chart.point) : Pivot D
drawing (HarmonicProjectionDrawing) : HarmonicProjectionDrawing Object

HarmonicMapLibLibrary "HarmonicMapLib"
Harmonic Pattern Library implementation utilising maps
method tostring(this)
convert Range value to string
Namespace types: Range
Parameters:
this (Range) : Range value
Returns: converted string representation
method tostring(this)
convert array of Range value to string
Namespace types: array
Parameters:
this (array) : array object
Returns: converted string representation
method tostring(this)
convert map of string to Range value to string
Namespace types: map
Parameters:
this (map) : map object
Returns: converted string representation
method tostring(this)
convert RatioMap to string
Namespace types: RatioMap
Parameters:
this (RatioMap) : RatioMap object
Returns: converted string representation
method tostring(this)
convert array of RatioMap to string
Namespace types: array
Parameters:
this (array) : array object
Returns: converted string representation
method tostring(this)
convert map of string to RatioMap to string
Namespace types: map
Parameters:
this (map) : map object
Returns: converted string representation
method tostring(this)
convert map of string to bool to string
Namespace types: map
Parameters:
this (map) : map object
Returns: converted string representation
method tostring(this)
convert PrzRange to string
Namespace types: PrzRange
Parameters:
this (PrzRange) : PrzRange object
Returns: converted string representation
method tostring(this)
convert array of PrzRange to string
Namespace types: array
Parameters:
this (array) : array object
Returns: converted string representation
getHarmonicMap()
Creates the RatioMap for harmonic patterns
Returns: map haronic ratio rules for all patterns
method evaluate(patternsMap, pattern, ratioRange, properties, ratioValue)
evaluates harmonic ratio range
Namespace types: map
Parameters:
patternsMap (map) : parameter containing valid pattern names
pattern (string) : Pattern type to be evaluated
ratioRange (Range) : ratio range to be checked
properties (ScanProperties) : Scan Properties
ratioValue (float)
Returns: void
method evaluate(przRange, pattern, ratioRange, priceRange, properties)
Evaluate PRZ ranges
Namespace types: map
Parameters:
przRange (map)
pattern (string) : Pattern name
ratioRange (Range) : Range of ratio for the pattern
priceRange (Range) : Price range based on ratio
properties (ScanProperties) : ScanProperties object
Returns: void
method scanRatio(currentPatterns, rules, properties, ratioName, ratioValue)
Scan for particular named ratio of harmonic pattern to filter valid patterns
Namespace types: map
Parameters:
currentPatterns (map) : Current valid patterns map
rules (map) : map Harmonic ratio rules
properties (ScanProperties) : ScanProperties object
ratioName (string) : Specific ratio name
ratioValue (float) : ratio value to be checked
Returns: updated currentPatterns object
method scanPatterns(patterns, x, a, b, c, d, properties)
Scan for patterns based on X, A, B, C, D values
Namespace types: map
Parameters:
patterns (map) : List of allowed patterns
x (float) : X coordinate
a (float) : A coordinate
b (float) : B coordinate
c (float) : C coordinate
d (float) : D coordinate
properties (ScanProperties) : ScanProperties object. If na, default values are initialised
Returns: updated valid patterns map
method scanProjections(patterns, x, a, b, c, properties)
Scan for projections based on X, A, B, C values
Namespace types: map
Parameters:
patterns (map) : List of allowed patterns
x (float) : X coordinate
a (float) : A coordinate
b (float) : B coordinate
c (float) : C coordinate
properties (ScanProperties) : ScanProperties object. If na, default values are initialised
Returns: updated valid projections map
method merge(this, other)
merge two ranges into one
Namespace types: Range
Parameters:
this (Range) : first range
other (Range) : second range
Returns: combined range
method union(this, other)
union of two ranges into one
Namespace types: Range
Parameters:
this (Range) : first range
other (Range) : second range
Returns: union range
method overlaps(this, other)
checks if two ranges intersect
Namespace types: Range
Parameters:
this (Range) : first range
other (Range) : second range
Returns: true if intersects, false otherwise
method consolidate(this)
Consolidate ranges into PRZ
Namespace types: map
Parameters:
this (map) : map of Ranges
Returns: consolidated PRZ
method consolidateMany(this)
Consolidate ranges into multiple PRZ ranges
Namespace types: map
Parameters:
this (map) : map of Ranges
Returns: consolidated array of PRZ ranges
method getRange(currentPatterns, x, a, b, c, properties)
Get D range based on X, A, B, C coordinates for the current patterns
Namespace types: map
Parameters:
currentPatterns (map) : List of valid patterns
x (float) : X coordinate
a (float) : A coordinate
b (float) : B coordinate
c (float) : C coordinate
properties (ScanProperties) : ScanProperties object. If na, default values are initialised
Returns: map of D ranges
method getPrzRange(currentPatterns, x, a, b, c, properties)
Get PRZ range based on X, A, B, C coordinates for the current patterns
Namespace types: map
Parameters:
currentPatterns (map) : List of valid patterns
x (float) : X coordinate
a (float) : A coordinate
b (float) : B coordinate
c (float) : C coordinate
properties (ScanProperties) : ScanProperties object. If na, default values are initialised
Returns: PRZRange for the pattern
method getProjectionRanges(currentPatterns, x, a, b, c, properties)
Get projection range based on X, A, B, C coordinates for the current patterns
Namespace types: map
Parameters:
currentPatterns (map) : List of valid patterns
x (float) : X coordinate
a (float) : A coordinate
b (float) : B coordinate
c (float) : C coordinate
properties (ScanProperties) : ScanProperties object. If na, default values are initialised
Returns: array of projection ranges
Range
Collection of range values
Fields:
values (array) : array of float values
RatioMap
ratio map for pattern
Fields:
ratioMap (map) : map of string to Range (array of float)
ScanProperties
Pattern Scanning properties
Fields:
strictMode (series bool) : strict scanning mode will check for overflows
logScale (series bool) : scan ratios in log scale
errorMin (series float) : min error threshold
errorMax (series float)
mintick (series float) : minimum tick value of price
PrzRange
Potential reversal zone range
Fields:
patterns (array) : array of pattern names for the given XABCD combination
prz (Range) : PRZ range
datastructuresLibrary "datastructures"
Collection of complex data structures not generally present as part of pinescript and can be used for collection and transformation of the data
method init(this)
initialise StringSet
Namespace types: StringSet
Parameters:
this (StringSet) : StringSet to be initialised
Returns: current object of StringSet
method add(this, value)
add value to StringSet
Namespace types: StringSet
Parameters:
this (StringSet) : StringSet object
@value the key of stringset to be set
value (string)
Returns: current object of StringSet
method clear(this)
clear StringSet contents
Namespace types: StringSet
Parameters:
this (StringSet) : StringSet object
Returns: current object of StringSet
method remove(this, value)
remove value from StringSet
Namespace types: StringSet
Parameters:
this (StringSet) : StringSet object
@value the key of stringset to be removed
value (string)
Returns: current object of StringSet
method size(this)
get size of the StringSet
Namespace types: StringSet
Parameters:
this (StringSet) : StringSet object
Returns: size of StringSet map
method isEmpty(this)
check if stringset is empty
Namespace types: StringSet
Parameters:
this (StringSet) : StringSet object
Returns: true if empty else returns false
method iterator(this)
get values of the StringSet
Namespace types: StringSet
Parameters:
this (StringSet) : StringSet object
Returns: values of StringSet
method contains(this, value)
check if value is present in StringSet
Namespace types: StringSet
Parameters:
this (StringSet) : StringSet object
value (string)
Returns: true if Value is present. False otherwise
method initialiseCountMap(types, numberOfStates)
Initialise a new map of string to Count
Namespace types: array
Parameters:
types (array) : array of string containing map keys
numberOfStates (int) : number of items to be tracked for each type
Returns: new map() with empty initialisation
method initialiseCountMap(types, numberOfStates)
Initialise a new map of string to Count
Namespace types: map
Parameters:
types (map) : map containing types and configurable boolean flag
numberOfStates (int) : number of items to be tracked for each type
Returns: new map() with empty initialisation
method get(this, key, n)
get count based on primary string key and secondary int key
Namespace types: map
Parameters:
this (map) : map of string to to Count
key (string) : primary key
n (int) : secondary key
Returns: derived count from map of map
method get(this, key, n)
get array of int associated with key and n
Namespace types: map
Parameters:
this (map) : map of string to to MapToInts
key (string) : primary string key
n (int) : secondary int key
Returns: derived array of int for the given key combination
method get(this, key, n)
get array of float associated with key and n
Namespace types: map
Parameters:
this (map) : map of string to to MapToFloats
key (string) : primary string key
n (int) : secondary int key
Returns: derived array of float
method get(this, key)
get values of Ints based on key
Namespace types: map
Parameters:
this (map) : map of string to Ints
key (string) : string key
Returns: values inside Ints object associated in the map
method set(this, key, n, value)
set count for specific primary and secondary key
Namespace types: map
Parameters:
this (map) : map of string to to Count
key (string) : primary string key
n (int) : secondary int key
value (int) : the new count value to be set
Returns: updated value for key and n
method increment(this, key, n)
increment count for specific primary and secondary key
Namespace types: map
Parameters:
this (map) : map of string to to Count
key (string) : primary string key
n (int) : secondary int key
Returns: incremented value
method increment(this, key, n)
intcrement the value of Ints based on key and n (secondary key)
Namespace types: map
Parameters:
this (map) : map of string to Ints
key (string) : string key
n (int) : secondary int key
Returns: incremented nth object of Ints associated with key
method initialiseIntsMap(types, numberOfStates)
Initialise a new map of string to Map to Ints
Namespace types: array
Parameters:
types (array) : array of string containing map keys
numberOfStates (int) : number of items to be tracked for each type
Returns: new map() with empty initialisation
method initialiseIntsMap(types, numberOfStates)
Initialise a new map of string to Map to Ints
Namespace types: map
Parameters:
types (map) : map with boolean flag
numberOfStates (int) : number of items to be tracked for each type
Returns: new map() with empty initialisation
method initialiseFloatsMap(types, numberOfStates)
Initialise a new map of string to Map to Floats
Namespace types: array
Parameters:
types (array) : array of string containing map keys
numberOfStates (int) : number of items to be tracked for each type
Returns: new map() with empty initialisation
method initialiseFloatsMap(types, numberOfStates)
Initialise a new map of string to Map to Floats
Namespace types: map
Parameters:
types (map) : map with boolean flag
numberOfStates (int) : number of items to be tracked for each type
Returns: new map() with empty initialisation
method initialiseMapOfInts(types, numberOfStates)
Initialise map of two dimentional Ints based on types and number of states
Namespace types: array
Parameters:
types (array) : types array for which a new Map to Ints to be created
numberOfStates (int) : number of states for which the Ints needs to be initialised
Returns: new map of string to two dimension array of int (Ints)
method initialiseMapOfInts(types, numberOfStates)
Initialise map of two dimentional Ints based on types and number of states
Namespace types: map
Parameters:
types (map) : types map for which a new Map to Ints to be created along with bool flag
numberOfStates (int) : number of states for which the Ints needs to be initialised
Returns: new map of string to two dimension array of int (Ints)
StringSet
Set implementation using map
Fields:
strSet (map) : map of string to bool
Count
type containing map of int to int
Fields:
count (map) : map of int to int used for counting
Ints
custom type to enable array of array of int
Fields:
values (array) : int array
Floats
custom type to enable array of array of float
Fields:
values (array) : float array
MapToInts
type containing map of int to int array
Fields:
vmap (map) : map of int to Ints used as counting collection
MapToFloats
type containing map of int to float array
Fields:
vmap (map) : map of int to Floats used as floating stat collection

drawingutilsLibrary "drawingutils"
methods used in my scripts for some basic and customized drawings and arrays.
method line(this, p1, p2, lineColor, style, width, xloc, extend)
Draws line and adds to the array
Namespace types: array
Parameters:
this (array) : array to which the created line needs to be added
p1 (chart.point) : point1 of the line
p2 (chart.point) : point2 of the line
lineColor (color) : line color
style (string) : line style
width (int) : line width
xloc (string) : xloc.bar_index or xloc.bar_time
extend (string) : default is extend.none
Returns: line created
method label(this, p, txt, tooltip, xloc, yloc, color, style, textcolor, size, textalign)
Draws label and adds to the array
Namespace types: array
Parameters:
this (array) : array to which the created label needs to be added
p (chart.point) : point at which the label needs to be drawn
txt (string) : label text
tooltip (string) : tooltip text
xloc (string) : xloc value - xloc.bar_index or xloc.bar_time
yloc (string) : y location of the label
color (color) : label color
style (string) : label style
textcolor (color) : label text color
size (string) : Size of the label
textalign (string) : text alignment
Returns: label created
method linefill(this, ln1, ln2, fillColor, transparency)
Draws linefill and adds to array
Namespace types: array
Parameters:
this (array) : array to which the created linefill needs to be added
ln1 (line) : line1 of the fill
ln2 (line) : line2 of the fill
fillColor (color) : fill Color
transparency (int) : fill transparency
Returns: linefill created
draw_labelled_line(target, lblText, linecolor, labelcolor, index, highlight, linesArray, labelsArray, highlightSize, tinySize, yloc, textalign)
Draws labelled line
Parameters:
target (float) : target price
lblText (string) : label text
linecolor (color) : line color
labelcolor (color) : label color
index (int) : index to calculate the distance offset
highlight (bool) : highlight true/false
linesArray (array) : array of lines where the created line is added
labelsArray (array) : array of labels where the created label is added
highlightSize (string) : Size of highlighted text
tinySize (string) : size of non highlighted text
yloc (string) : y location
textalign (string) : text alignment
Returns: void
draw_labelled_box(y1, y2, labelColor, labelText, index, boxArray, labelArray, borderColor, borderStyle, borderWidth, textAlign, highlight, highLightLabel)
Draws custom labelled box
Parameters:
y1 (float) : price 1 of the box
y2 (float) : price 2 of the box
labelColor (color) : label color
labelText (string) : label text
index (int) : index to calculate the offset distance
boxArray (array) : box array to which the box needs to be added
labelArray (array) : label array to which the label needs to be added
borderColor (color) : border color
borderStyle (string) : border style
borderWidth (int) : border width
textAlign (string) : text align of the label
highlight (bool) : highlight label text
highLightLabel (bool) : highlight label size
Returns: void

ootaLibrary "oota"
Collection of all custom and enhanced TA indicators - Object oriented methods implementation
method tr(c, useTrueRange)
returns true range of the candle
Namespace types: Candle
Parameters:
c (Candle) : Candle object containing ohlc data
useTrueRange (bool) : Use true range for atr calculation instead of just high/low difference
method ma(maType, length, source)
returns custom moving averages
Namespace types: simple CustomSeries
Parameters:
maType (simple CustomSeries) : Custom series type
length (simple int) : Moving Average Length
source (float) : Moving Average Source
Returns: moving average for the given type and length
method atr(maType, length, useTrueRange, c)
returns ATR with custom moving average
Namespace types: simple CustomSeries
Parameters:
maType (simple CustomSeries) : Custom series type
length (simple int) : Moving Average Length
useTrueRange (bool) : Use true range for atr calculation instead of just high/low difference
c (Candle) : Candle object containing ohlc
Returns: ATR for the given moving average type and length
method atrpercent(maType, length, useTrueRange, c)
returns ATR as percentage of close price
Namespace types: simple CustomSeries
Parameters:
maType (simple CustomSeries) : Custom series type
length (simple int) : Moving Average Length
useTrueRange (bool) : Use true range for atr calculation instead of just high/low difference
c (Candle) : Candle object containing ohlc
Returns: ATR as percentage of close price for the given moving average type and length
method bb(maType, length, multiplier, sticky, c)
returns Bollinger band for custom moving average
Namespace types: simple CustomSeries
Parameters:
maType (simple CustomSeries) : Custom series type
length (simple int) : Moving Average Length
multiplier (float) : Standard Deviation multiplier
sticky (simple bool) : - sticky boundaries which will only change when value is outside boundary.
c (Candle) : Candle object containing ohlc
Returns: Bollinger band with custom moving average for given source, length and multiplier
method bbw(maType, length, multiplier, sticky, c)
returns Bollinger bandwidth for custom moving average
Namespace types: simple CustomSeries
Parameters:
maType (simple CustomSeries) : Custom series type
length (simple int) : Moving Average Length
multiplier (float) : Standard Deviation multiplier
sticky (simple bool) : sticky boundaries which will only change when value is outside boundary.
c (Candle) : Candle object containing ohlc
Returns: Bollinger Bandwidth for custom moving average for given source, length and multiplier
method bpercentb(maType, length, multiplier, sticky, c)
returns Bollinger Percent B for custom moving average
Namespace types: simple CustomSeries
Parameters:
maType (simple CustomSeries) : Custom series type
length (simple int) : Moving Average Length
multiplier (float) : Standard Deviation multiplier
sticky (simple bool) : - sticky boundaries which will only change when value is outside boundary.
c (Candle) : Candle object containing ohlc
Returns: Bollinger Percent B for custom moving average for given source, length and multiplier
method kc(maType, length, multiplier, useTrueRange, sticky, c)
returns Keltner Channel for custom moving average
Namespace types: simple CustomSeries
Parameters:
maType (simple CustomSeries) : Custom series type
length (simple int) : Moving Average Length
multiplier (float) : Standard Deviation multiplier
useTrueRange (simple bool) : - if set to false, uses high-low.
sticky (simple bool) : - sticky boundaries which will only change when value is outside boundary.
c (Candle) : Candle object containing ohlc
Returns: Keltner Channel for custom moving average for given souce, length and multiplier
method kcw(maType, length, multiplier, useTrueRange, sticky, c)
returns Keltner Channel Width with custom moving average
Namespace types: simple CustomSeries
Parameters:
maType (simple CustomSeries) : Custom series type
length (simple int) : Moving Average Length
multiplier (float) : Standard Deviation multiplier
useTrueRange (simple bool) : - if set to false, uses high-low.
sticky (simple bool) : - sticky boundaries which will only change when value is outside boundary.
c (Candle) : Candle object containing ohlc
Returns: Keltner Channel Width for custom moving average
method kpercentk(maType, length, multiplier, useTrueRange, sticky, c)
returns Keltner Channel Percent K Width with custom moving average
Namespace types: simple CustomSeries
Parameters:
maType (simple CustomSeries) : Custom series type
length (simple int) : Moving Average Length
multiplier (float) : Standard Deviation multiplier
useTrueRange (simple bool) : - if set to false, uses high-low.
sticky (simple bool) : - sticky boundaries which will only change when value is outside boundary.
c (Candle) : Candle object containing ohlc
Returns: Keltner Percent K for given moving average, source, length and multiplier
method dc(c, length, sticky)
returns Custom Donchian Channel
Namespace types: Candle
Parameters:
c (Candle) : Candle object containing ohlc
length (simple int) : - donchian channel length
sticky (simple bool) : - sticky boundaries which will only change when value is outside boundary.
Returns: Donchian channel
method dcw(c, length, sticky)
returns Donchian Channel Width
Namespace types: Candle
Parameters:
c (Candle) : Candle object containing ohlc
length (simple int) : - donchian channel length
sticky (simple bool) : - sticky boundaries which will only change when value is outside boundary.
Returns: Donchian channel width
method dpercentd(c, length, sticky)
returns Donchian Channel Percent of price
Namespace types: Candle
Parameters:
c (Candle) : Candle object containing ohlc
length (simple int) : - donchian channel length
sticky (simple bool) : - sticky boundaries which will only change when value is outside boundary.
Returns: Donchian channel Percent D
method supertrend(maType, length, multiplier, useTrueRange, waitForClose, delayed, c)
supertrend Simple supertrend based on atr but also takes into consideration of custom MA Type, sources
Namespace types: simple CustomSeries
Parameters:
maType (simple CustomSeries) : Custom Series
length (simple int) : ATR Length
multiplier (simple float) : ATR Multiplier
useTrueRange (simple bool) : - if set to false, uses high-low.
waitForClose (simple bool) : : Considers source for direction change crossover if checked. Else, uses highSource and lowSource.
delayed (simple bool) : : if set to true lags supertrend atr stop based on target levels.
c (Candle) : Candle object containing ohlc
Returns: dir : Supertrend direction
supertrend : BuyStop if direction is 1 else SellStop
method oscillatorRange(seriesType, source, highlowLength, rangeLength, sticky)
oscillatorRange - returns Custom overbought/oversold areas for an oscillator input
Namespace types: simple CustomSeries
Parameters:
seriesType (simple CustomSeries) : - Custom series type
source (float) : - Osillator source such as RSI, COG etc.
highlowLength (simple int) : - length on which highlow of the oscillator is calculated
rangeLength (simple int) : - length used for calculating oversold/overbought range - usually same as oscillator length
sticky (simple bool) : - overbought, oversold levels won't change unless crossed
Returns: Dynamic overbought and oversold range for oscillator input
method oscillator(oscillatorType, length, shortLength, longLength, c)
oscillator - returns Choice of oscillator with custom overbought/oversold range
Namespace types: simple OscillatorType
Parameters:
oscillatorType (simple OscillatorType) : OscillatorType object
length (simple int) : - Oscillator length - not used for TSI
shortLength (simple int) : - shortLength only used for TSI
longLength (simple int) : - longLength only used for TSI
c (Candle) : Candle object containing ohlc
Returns: Oscillator value
method oscillatorWithRange(oscillatorType, length, shortLength, longLength, seriesType, highlowLength, sticky, c)
oscillatorWithRange - returns Choice of oscillator with custom overbought/oversold range
Namespace types: simple OscillatorType
Parameters:
oscillatorType (simple OscillatorType) : OscillatorType object
length (simple int) : - Oscillator length - not used for TSI
shortLength (simple int) : - shortLength only used for TSI
longLength (simple int) : - longLength only used for TSI
seriesType (simple CustomSeries) : - CustomSeries enum type
highlowLength (simple int) : - length on which highlow of the oscillator is calculated
sticky (simple bool) : - overbought, oversold levels won't change unless crossed
c (Candle) : Candle object containing ohlc
Returns: Oscillator value along with dynamic overbought and oversold range for oscillator input
Candle
Custom candle object
Fields:
o (series float) : open
h (series float) : high
l (series float) : low
c (series float) : close
barindex (series int) : bar_index
bartime (series int) : time
bartimeclose (series int) : time_close
v (series float) : volume
rzigzagLibrary "rzigzag"
Recursive Zigzag Using Matrix allows to create zigzags recursively on multiple levels. This is an old library converted to V6
zigzag(length, ohlc, numberOfPivots, offset)
calculates plain zigzag based on input
Parameters:
length (int) : Zigzag Length
ohlc (array) : Array containing ohlc values. Can also contain custom series
numberOfPivots (simple int) : Number of max pivots to be returned
offset (simple int) : Offset from current bar. Can be used for calculations based on confirmed bars
Returns: [matrix zigzagmatrix, bool flags]
iZigzag(length, h, l, numberOfPivots)
calculates plain zigzag based on input array
Parameters:
length (int) : Zigzag Length
h (array) : array containing high values of a series
l (array) : array containing low values of a series
numberOfPivots (simple int) : Number of max pivots to be returned
Returns: matrix zigzagmatrix
nextlevel(zigzagmatrix, numberOfPivots)
calculates next level zigzag based on present zigzag coordinates
Parameters:
zigzagmatrix (matrix) : Matrix containing zigzag pivots, bars, bar time, direction and level
numberOfPivots (simple int) : Number of max pivots to be returned
Returns: matrix zigzagmatrix
draw(zigzagmatrix, flags, lineColor, lineWidth, lineStyle, showLabel, xloc)
draws zigzag based on the zigzagmatrix input
Parameters:
zigzagmatrix (matrix) : Matrix containing zigzag pivots, bars, bar time, direction and level
flags (array) : Zigzag pivot flags
lineColor (color) : Zigzag line color
lineWidth (int) : Zigzag line width
lineStyle (string) : Zigzag line style
showLabel (bool) : Flag to indicate display pivot labels
xloc (string) : xloc preference for drawing lines/labels
Returns:
draw(length, ohlc, numberOfPivots, offset, lineColor, lineWidth, lineStyle, showLabel, xloc)
calculates and draws zigzag based on zigzag length and source input
Parameters:
length (int) : Zigzag Length
ohlc (array) : Array containing ohlc values. Can also contain custom series
numberOfPivots (simple int) : Number of max pivots to be returned
offset (simple int) : Offset from current bar. Can be used for calculations based on confirmed bars
lineColor (color) : Zigzag line color
lineWidth (int) : Zigzag line width
lineStyle (string) : Zigzag line style
showLabel (bool) : Flag to indicate display pivot labels
xloc (string) : xloc preference for drawing lines/labels
Returns: [matrix zigzagmatrix, array zigzaglines, array zigzaglabels, bool flags]
drawfresh(zigzagmatrix, zigzaglines, zigzaglabels, lineColor, lineWidth, lineStyle, showLabel, xloc)
draws fresh zigzag for all pivots in the input matrix.
Parameters:
zigzagmatrix (matrix) : Matrix containing zigzag pivots, bars, bar time, direction and level
zigzaglines (array) : array to which all newly created lines will be added
zigzaglabels (array) : array to which all newly created lables will be added
lineColor (color) : Zigzag line color
lineWidth (int) : Zigzag line width
lineStyle (string) : Zigzag line style
showLabel (bool) : Flag to indicate display pivot labels
xloc (string) : xloc preference for drawing lines/labels
Returns:

_matrixLibrary "_matrix"
Library helps visualize matrix as array of arrays and enables users to use array methods such as push, pop, shift, unshift etc along with cleanup activities on drawing objects wherever required
method delete(mtx, rowNumber)
deletes row from a matrix
Namespace types: matrix
Parameters:
mtx (matrix) : matrix of objects
rowNumber (int) : row index to be deleted
Returns: void
method delete(mtx, rowNumber)
Namespace types: matrix
Parameters:
mtx (matrix)
rowNumber (int)
method delete(mtx, rowNumber)
Namespace types: matrix
Parameters:
mtx (matrix)
rowNumber (int)
method delete(mtx, rowNumber)
Namespace types: matrix
Parameters:
mtx (matrix)
rowNumber (int)
method delete(mtx, rowNumber)
Namespace types: matrix
Parameters:
mtx (matrix)
rowNumber (int)
method delete(mtx, rowNumber)
Namespace types: matrix
Parameters:
mtx (matrix)
rowNumber (int)
method delete(mtx, rowNumber)
Namespace types: matrix
Parameters:
mtx (matrix)
rowNumber (int)
method delete(mtx, rowNumber)
Namespace types: matrix
Parameters:
mtx (matrix)
rowNumber (int)
method delete(mtx, rowNumber)
Namespace types: matrix
Parameters:
mtx (matrix)
rowNumber (int)
method delete(mtx, rowNumber)
Namespace types: matrix
Parameters:
mtx (matrix)
rowNumber (int)
method remove(mtx, rowNumber)
remove row from a matrix and returns them to caller
Namespace types: matrix
Parameters:
mtx (matrix) : matrix of objects
rowNumber (int) : row index to be deleted
Returns: type
method remove(mtx, rowNumber)
Namespace types: matrix
Parameters:
mtx (matrix)
rowNumber (int)
method remove(mtx, rowNumber)
Namespace types: matrix
Parameters:
mtx (matrix)
rowNumber (int)
method remove(mtx, rowNumber)
Namespace types: matrix
Parameters:
mtx (matrix)
rowNumber (int)
method remove(mtx, rowNumber)
Namespace types: matrix
Parameters:
mtx (matrix)
rowNumber (int)
method remove(mtx, rowNumber)
Namespace types: matrix
Parameters:
mtx (matrix)
rowNumber (int)
method remove(mtx, rowNumber)
Namespace types: matrix
Parameters:
mtx (matrix)
rowNumber (int)
method remove(mtx, rowNumber)
Namespace types: matrix
Parameters:
mtx (matrix)
rowNumber (int)
method remove(mtx, rowNumber)
Namespace types: matrix
Parameters:
mtx (matrix)
rowNumber (int)
method remove(mtx, rowNumber)
Namespace types: matrix
Parameters:
mtx (matrix)
rowNumber (int)
method unshift(mtx, row, maxItems)
unshift array of lines to first row of the matrix
Namespace types: matrix
Parameters:
mtx (matrix) : matrix of lines
row (array) : array of lines to be inserted in row
maxItems (simple int)
Returns: resulting matrix of type
method unshift(mtx, row, maxItems)
Namespace types: matrix
Parameters:
mtx (matrix)
row (array)
maxItems (simple int)
method unshift(mtx, row, maxItems)
Namespace types: matrix
Parameters:
mtx (matrix)
row (array)
maxItems (simple int)
method unshift(mtx, row, maxItems)
Namespace types: matrix
Parameters:
mtx (matrix)
row (array)
maxItems (simple int)
method unshift(mtx, row, maxItems)
Namespace types: matrix
Parameters:
mtx (matrix)
row (array)
maxItems (simple int)
method unshift(mtx, row, maxItems)
Namespace types: matrix
Parameters:
mtx (matrix)
row (array)
maxItems (simple int)
method unshift(mtx, row, maxItems)
Namespace types: matrix
Parameters:
mtx (matrix)
row (array)
maxItems (simple int)
method unshift(mtx, row, maxItems)
Namespace types: matrix
Parameters:
mtx (matrix)
row (array)
maxItems (simple int)
method unshift(mtx, row, maxItems)
Namespace types: matrix
Parameters:
mtx (matrix)
row (array)
maxItems (simple int)
method unshift(mtx, row, maxItems)
Namespace types: matrix
Parameters:
mtx (matrix)
row (array)
maxItems (simple int)
method push(mtx, row, maxItems)
push array of lines to end of the matrix row
Namespace types: matrix
Parameters:
mtx (matrix) : matrix of lines
row (array) : array of lines to be inserted in row
maxItems (simple int)
Returns: resulting matrix of lines
method push(mtx, row, maxItems)
Namespace types: matrix
Parameters:
mtx (matrix)
row (array)
maxItems (simple int)
method push(mtx, row, maxItems)
Namespace types: matrix
Parameters:
mtx (matrix)
row (array)
maxItems (simple int)
method push(mtx, row, maxItems)
Namespace types: matrix
Parameters:
mtx (matrix)
row (array)
maxItems (simple int)
method push(mtx, row, maxItems)
Namespace types: matrix
Parameters:
mtx (matrix)
row (array)
maxItems (simple int)
method push(mtx, row, maxItems)
Namespace types: matrix
Parameters:
mtx (matrix)
row (array)
maxItems (simple int)
method push(mtx, row, maxItems)
Namespace types: matrix
Parameters:
mtx (matrix)
row (array)
maxItems (simple int)
method push(mtx, row, maxItems)
Namespace types: matrix
Parameters:
mtx (matrix)
row (array)
maxItems (simple int)
method push(mtx, row, maxItems)
Namespace types: matrix
Parameters:
mtx (matrix)
row (array)
maxItems (simple int)
method push(mtx, row, maxItems)
Namespace types: matrix
Parameters:
mtx (matrix)
row (array)
maxItems (simple int)
method shift(mtx)
shift removes first row from matrix of lines
Namespace types: matrix
Parameters:
mtx (matrix) : matrix of lines from which the shift operation need to be performed
Returns: void
method shift(mtx)
Namespace types: matrix
Parameters:
mtx (matrix)
method shift(mtx)
Namespace types: matrix
Parameters:
mtx (matrix)
method shift(mtx)
Namespace types: matrix
Parameters:
mtx (matrix)
method shift(mtx)
Namespace types: matrix
Parameters:
mtx (matrix)
method shift(mtx)
Namespace types: matrix
Parameters:
mtx (matrix)
method shift(mtx)
Namespace types: matrix
Parameters:
mtx (matrix)
method shift(mtx)
Namespace types: matrix
Parameters:
mtx (matrix)
method shift(mtx)
Namespace types: matrix
Parameters:
mtx (matrix)
method shift(mtx)
Namespace types: matrix
Parameters:
mtx (matrix)
method rshift(mtx)
rshift removes first row from matrix of lines and returns them as array
Namespace types: matrix
Parameters:
mtx (matrix) : matrix of lines from which the rshift operation need to be performed
Returns: type
method rshift(mtx)
Namespace types: matrix
Parameters:
mtx (matrix)
method rshift(mtx)
Namespace types: matrix
Parameters:
mtx (matrix)
method rshift(mtx)
Namespace types: matrix
Parameters:
mtx (matrix)
method rshift(mtx)
Namespace types: matrix
Parameters:
mtx (matrix)
method rshift(mtx)
Namespace types: matrix
Parameters:
mtx (matrix)
method rshift(mtx)
Namespace types: matrix
Parameters:
mtx (matrix)
method rshift(mtx)
Namespace types: matrix
Parameters:
mtx (matrix)
method rshift(mtx)
Namespace types: matrix
Parameters:
mtx (matrix)
method rshift(mtx)
Namespace types: matrix
Parameters:
mtx (matrix)
method pop(mtx)
pop removes last row from matrix of lines
Namespace types: matrix
Parameters:
mtx (matrix) : matrix of lines from which the pop operation need to be performed
Returns: void
method pop(mtx)
Namespace types: matrix
Parameters:
mtx (matrix)
method pop(mtx)
Namespace types: matrix
Parameters:
mtx (matrix)
method pop(mtx)
Namespace types: matrix
Parameters:
mtx (matrix)
method pop(mtx)
Namespace types: matrix
Parameters:
mtx (matrix)
method pop(mtx)
Namespace types: matrix
Parameters:
mtx (matrix)
method pop(mtx)
Namespace types: matrix
Parameters:
mtx (matrix)
method pop(mtx)
Namespace types: matrix
Parameters:
mtx (matrix)
method pop(mtx)
Namespace types: matrix
Parameters:
mtx (matrix)
method pop(mtx)
Namespace types: matrix
Parameters:
mtx (matrix)
method rpop(mtx)
rpop removes last row from matrix of lines and reutnrs the array to caller
Namespace types: matrix
Parameters:
mtx (matrix) : matrix of lines from which the rpop operation need to be performed
Returns: void
method rpop(mtx)
Namespace types: matrix
Parameters:
mtx (matrix)
method rpop(mtx)
Namespace types: matrix
Parameters:
mtx (matrix)
method rpop(mtx)
Namespace types: matrix
Parameters:
mtx (matrix)
method rpop(mtx)
Namespace types: matrix
Parameters:
mtx (matrix)
method rpop(mtx)
Namespace types: matrix
Parameters:
mtx (matrix)
method rpop(mtx)
Namespace types: matrix
Parameters:
mtx (matrix)
method rpop(mtx)
Namespace types: matrix
Parameters:
mtx (matrix)
method rpop(mtx)
Namespace types: matrix
Parameters:
mtx (matrix)
method rpop(mtx)
Namespace types: matrix
Parameters:
mtx (matrix)
method clear(mtx)
clear clears the matrix
Namespace types: matrix
Parameters:
mtx (matrix) : matrix of lines which needs to be cleared
Returns: void
method clear(mtx)
Namespace types: matrix
Parameters:
mtx (matrix)
method clear(mtx)
Namespace types: matrix
Parameters:
mtx (matrix)
method clear(mtx)
Namespace types: matrix
Parameters:
mtx (matrix)
method clear(mtx)
Namespace types: matrix
Parameters:
mtx (matrix)
method clear(mtx)
Namespace types: matrix
Parameters:
mtx (matrix)
method clear(mtx)
Namespace types: matrix
Parameters:
mtx (matrix)
method clear(mtx)
Namespace types: matrix
Parameters:
mtx (matrix)
method clear(mtx)
Namespace types: matrix
Parameters:
mtx (matrix)
method clear(mtx)
Namespace types: matrix
Parameters:
mtx (matrix)
method flush(mtx)
clear clears the matrix but retains the drawing objects
Namespace types: matrix
Parameters:
mtx (matrix) : matrix of lines which needs to be cleared
Returns: void
method flush(mtx)
Namespace types: matrix
Parameters:
mtx (matrix)
method flush(mtx)
Namespace types: matrix
Parameters:
mtx (matrix)
method flush(mtx)
Namespace types: matrix
Parameters:
mtx (matrix)
method flush(mtx)
Namespace types: matrix
Parameters:
mtx (matrix)
method flush(mtx)
Namespace types: matrix
Parameters:
mtx (matrix)
method flush(mtx)
Namespace types: matrix
Parameters:
mtx (matrix)
method flush(mtx)
Namespace types: matrix
Parameters:
mtx (matrix)
method flush(mtx)
Namespace types: matrix
Parameters:
mtx (matrix)
method flush(mtx)
Namespace types: matrix
Parameters:
mtx (matrix)
Rolling Angled Volume Profile [Trendoscope®]🎲 Volume Profile Indicators
🎯Traditional Volume Profile
Volume profile indicators visually represent the distribution of volume across price levels. These indicators typically operate on horizontal price levels, making them effective in identifying supply and demand zones in ranging markets. However, they are less useful in trending markets where price movements follow a slope.
🎯The Need for Angled Volume Profiles
Just as support and resistance levels differ from trendlines, volume profile indicators require an equivalent method to account for volume distribution along a sloped trajectory. This would enable more accurate volume analysis in trending markets.
We identified the need of Angled Volume profile and have already published few indicators that implements the concept.
Angled Volume Profile calculates volume distribution along a slope. Users interact with the indicator by selecting the starting point, after which the volume profile is calculated for the selected trajectory.
Volume Forks is another tool that extends angled volume profile analysis, aligning volume profiles along the trajectory of pitchforks.
🎲 Rolling Volume Profile Indicator
The Rolling Volume Profile offers a new approach to angled volume profile calculations, addressing some limitations of earlier implementations:
🎯 Rolling Calculation
The volume profile is calculated for the last N bars of the instrument
The slope of the profile lines is determined by the closing prices of the starting and ending bars
Profiles are drawn in the direction of price movement between the start and end bars.
🎯 Dynamic Updates
As new bars are added, the calculations are updated, and the profile is redrawn based on the latest data.
This dynamic behavior earns it the name "Rolling Volume Profile."
🎯 Advantages Over Earlier Versions
Unlimited Profile Lines : Unlike previous implementations limited to 500 profile lines, this indicator uses polyline objects, overcoming the restriction.
Live Updates : Previous angled volume profile tools lacked real-time updates when new bars appeared. This limitation is resolved in the Rolling Volume Profile Indicator.
The Rolling Volume Profile provides an efficient and scalable solution for analyzing volume in trending markets.
🎯 Indicator Settings
Simple settings include few customisable options

Dual Zigzag [Trendoscope®]🎲 Dual Zigzag indicator is built on recursive zigzag algorithm. It is very similar to other zigzag indicators published by us and other authors. However, the key point here is, the indicator draws zigzag on both price and any other plot based indicator on separate layouts.
Before we get into the indicator, here are some brief descriptions of the underlying concepts and key terminologies
🎯 Zigzag
Zigzag indicator breaks down price or any input series into a series of Pivot Highs and Pivot Lows alternating between each other. Zigzags though shows pivot high and lows, should not be used for buying at low and selling at high. The main application of zigzag indicator is for the visualisation of market structure and this can be used as basic building block for any pattern recognition algorithms.
🎯 Recursive Zigzag Algorithm
Recursive zigzag algorithm builds zigzag on multiple levels and each level of zigzag is based on the previous level pivots. The level zero zigzag is built on price. However, for level 1, instead of price level 0 zigzag pivots are used. Similarly for level 2, level 1 zigzag pivots are used as base.
🎲 Components Dual Zigzag Indicator
Here are the components of Dual zigzag indicator
Built in Oscillator - Indicator has built in oscillator options for plotting RSI (Relative Strength Index), MFI (Money Flow Index), cci (Commodity Channel Index) , CMO (Chande Momentum Oscillator), COG (Center of Gravity), and ROC (Rate of Change). Apart from the given built in oscillators, users can also use a custom external output as base. The oscillators are not printed on the price pane. But, printed on a separate indicator overlay.
Zigzag On Oscillator - Recursive zigzag is calculated and printed on the oscillator series. Each pivot high and pivot low also prints a label having the retracement ratios, and price levels at those points. Zigzag on the oscillator is also printed on the indicator overlay pane.
Zigzag on Price - Recursive zigzag calculated based on price and printed on the price pane. This is made possible by using force_overlay option present in the drawing objects. At each zigzag pivot levels, the label having price retracement ratios, and oscillator values are printed.
It is called dual zigzag because, the indicator calculates the zigzag on both price and oscillator series of values and prints them separately on different panes on the chart.
🎲 Indicator Settings
Settings include
Theme display settings to get the right colour combination to match the background.
Zigzag settings to be used for zigzag calculation and display
Oscillator settings to chose the oscillator to be used as base for 2nd zigzag
🎲 Applications
Useful in spotting divergences with both indicator and price having their own zigzag to highlight pivots
Spotting patterns in indicators/oscillators and correlate them with the patterns on price
🎲 Using External Input
If users want to use an external indicator such as OBV instead of the built in oscillators, then can do so by using the custom option.
Here is how this can be done.
Step1. Add both Dual Zigzag and the intended indicator (in this case OBV) on the chart. Notice that both OBV and Dual zigzag appear on different panes.
Step2. Edit the indicator settings of Dual zigzag and set custom indicator by selecting "custom" as oscillator name and then by setting the custom external indicator name and input.
Step 3. You would notice that the zigzag in Dual Zigzag indictor pane is already showing the zigzag pivots based on the OBV indicator and the price pivots display obv values at the pivot points. We can leave this as is.
Step 4. As an additional step, you can also merge the OBV pane and the Dual zigzag indicator pane into one by going into OBV settings and moving the indicator to above pane. Merge the scales so that there is no two scales on the same pane and the entire scale appear on the right.
At the end, you should see two panes - one with price and other with OBV and both having their zigzag plotted.

HTF Candles Overlay [Trendoscope®]🎲 HTF Candles Overlay is a simple indicator where you can overlay higher timeframe candles on current timeframe chart.
Most of the code is encapsulated in the library HTFCandlesLib . After publishing the library as open source, many people requested to convert that into an indicator. Based on this, we decided to publish this small code for the use of community.
🎯 Usage
The indicator is simple, it helps users visualise higher timeframe candles. We majorly use this for debugging or validating our implementations based on higher timeframe. Instead of switching back and forth to different timeframes, it helps us visualise higher timeframe candles on the same chart when we are validating the implementation that involves higher timeframe calculations.
🎯 Components
The indicator provides two types of displays
Candles - overlay candles built through lines and labels
Plot - close price of higher timeframe plotted on chart
🎯 Candles
The behaviour of the candles are similar to that of hollow candles. The color of the body and the border+wick demonstrates the movement of the candle.
Body color is lime if the HTF close is higher than HTF open. Body color is orange if the HTF close is lower than the HTF open.
Wick and border color is lime if HTF close price is higher than previous HTF close price. And they are orange if HTF close price is lower than the previous HTF close price
In most cases body color will be same as the wick color. In case of stocks and indices, it may happen that the open price is too far away from previous close price due to gaps. This can lead to close price being relatively in different direction when compared to open and previous close.
Wicks are not at the centre of the candle. Instead wicks are drawn on the current chart timeframe position where the current timeframe has reached the highest or lowest point within the given HTF candle
Candles also list OHLC price of HTF candle along with HTF bar index and the range of LTF bar index that the candle spawns
Here are some pictorial representations that can help understand better.
Here are the examples of candles with gaps where body and wick/border are in different directions (colours)
🎯 Indicator Settings
Simple settings allow users to select the timeframe, whether to display candles and plots and their specific colors.
🎯 Possible inconsistencies
The overlay can show inconsistent data in certain situations. Here are some of the scenarios where the indicator may not show consistent display of the data.
When the HTF data from request.security does not match that of combined LTF data . In such cases, HTF candles may not form inline with the current timeframe candles. This happens when there is a data issue of different OHLC data available in tradingview.
When using weekly candle as either chart timeframe or higher timeframe - end of week may not coincide with end of month or other timeframes. This can cause some inconsistencies in the visuals of the indicator.
When open and close time of either LTF or HTF falls under different day due to time zone used. - time is always the time on which the candle close. So, when we use time zone that causes the exchange day to open and close on different days, that can cause some inconsistencies in the candles being drawn.

supertrendLibrary "supertrend"
supertrend : Library dedicated to different variations of supertrend
supertrend_atr(length, multiplier, atrMaType, source, highSource, lowSource, waitForClose, delayed)
supertrend_atr: Simple supertrend based on atr but also takes into consideration of custom MA Type, sources
Parameters:
length (simple int) : : ATR Length
multiplier (simple float) : : ATR Multiplier
atrMaType (simple string) : : Moving Average type for ATR calculation. This can be sma, ema, hma, rma, wma, vwma, swma
source (float) : : Default is close. Can Chose custom source
highSource (float) : : Default is high. Can also use close price for both high and low source
lowSource (float) : : Default is low. Can also use close price for both high and low source
waitForClose (simple bool) : : Considers source for direction change crossover if checked. Else, uses highSource and lowSource.
delayed (simple bool) : : if set to true lags supertrend atr stop based on target levels.
Returns: dir : Supertrend direction
supertrend : BuyStop if direction is 1 else SellStop
supertrend_bands(bandType, maType, length, multiplier, source, highSource, lowSource, waitForClose, useTrueRange, useAlternateSource, alternateSource, sticky)
supertrend_bands: Simple supertrend based on atr but also takes into consideration of custom MA Type, sources
Parameters:
bandType (simple string) : : Type of band used - can be bb, kc or dc
maType (simple string) : : Moving Average type for Bands. This can be sma, ema, hma, rma, wma, vwma, swma
length (simple int) : : Band Length
multiplier (float) : : Std deviation or ATR multiplier for Bollinger Bands and Keltner Channel
source (float) : : Default is close. Can Chose custom source
highSource (float) : : Default is high. Can also use close price for both high and low source
lowSource (float) : : Default is low. Can also use close price for both high and low source
waitForClose (simple bool) : : Considers source for direction change crossover if checked. Else, uses highSource and lowSource.
useTrueRange (simple bool) : : Used for Keltner channel. If set to false, then high-low is used as range instead of true range
useAlternateSource (simple bool) : - Custom source is used for Donchian Chanbel only if useAlternateSource is set to true
alternateSource (float) : - Custom source for Donchian channel
sticky (simple bool) : : if set to true borders change only when price is beyond borders.
Returns: dir : Supertrend direction
supertrend : BuyStop if direction is 1 else SellStop
supertrend_zigzag(length, history, useAlternativeSource, alternativeSource, source, highSource, lowSource, waitForClose, atrlength, multiplier, atrMaType)
supertrend_zigzag: Zigzag pivot based supertrend
Parameters:
length (simple int) : : Zigzag Length
history (simple int) : : number of historical pivots to consider
useAlternativeSource (simple bool)
alternativeSource (float)
source (float) : : Default is close. Can Chose custom source
highSource (float) : : Default is high. Can also use close price for both high and low source
lowSource (float) : : Default is low. Can also use close price for both high and low source
waitForClose (simple bool) : : Considers source for direction change crossover if checked. Else, uses highSource and lowSource.
atrlength (simple int) : : ATR Length
multiplier (simple float) : : ATR Multiplier
atrMaType (simple string) : : Moving Average type for ATR calculation. This can be sma, ema, hma, rma, wma, vwma, swma
Returns: dir : Supertrend direction
supertrend : BuyStop if direction is 1 else SellStop
zupertrend(length, history, useAlternativeSource, alternativeSource, source, highSource, lowSource, waitForClose, atrlength, multiplier, atrMaType)
zupertrend: Zigzag pivot based supertrend
Parameters:
length (simple int) : : Zigzag Length
history (simple int) : : number of historical pivots to consider
useAlternativeSource (simple bool)
alternativeSource (float)
source (float) : : Default is close. Can Chose custom source
highSource (float) : : Default is high. Can also use close price for both high and low source
lowSource (float) : : Default is low. Can also use close price for both high and low source
waitForClose (simple bool) : : Considers source for direction change crossover if checked. Else, uses highSource and lowSource.
atrlength (simple int) : : ATR Length
multiplier (simple float) : : ATR Multiplier
atrMaType (simple string) : : Moving Average type for ATR calculation. This can be sma, ema, hma, rma, wma, vwma, swma
Returns: dir : Supertrend direction
supertrend : BuyStop if direction is 1 else SellStop
zsupertrend(zigzagpivots, history, source, highSource, lowSource, waitForClose, atrMaType, atrlength, multiplier)
zsupertrend: Same as zigzag supertrend. But, works on already calculated array rather than Calculating fresh zigzag
Parameters:
zigzagpivots (array) : : Precalculated zigzag pivots
history (simple int) : : number of historical pivots to consider
source (float) : : Default is close. Can Chose custom source
highSource (float) : : Default is high. Can also use close price for both high and low source
lowSource (float) : : Default is low. Can also use close price for both high and low source
waitForClose (simple bool) : : Considers source for direction change crossover if checked. Else, uses highSource and lowSource.
atrMaType (simple string) : : Moving Average type for ATR calculation. This can be sma, ema, hma, rma, wma, vwma, swma
atrlength (simple int) : : ATR Length
multiplier (simple float) : : ATR Multiplier
Returns: dir : Supertrend direction
supertrend : BuyStop if direction is 1 else SellStop

taLibrary "ta"
Collection of all custom and enhanced TA indicators
ma(source, maType, length)
returns custom moving averages
Parameters:
source (float) : Moving Average Source
maType (simple string) : Moving Average Type : Can be sma, ema, hma, rma, wma, vwma, swma, highlow, linreg, median
length (simple int) : Moving Average Length
Returns: moving average for the given type and length
atr(maType, length)
returns ATR with custom moving average
Parameters:
maType (simple string) : Moving Average Type : Can be sma, ema, hma, rma, wma, vwma, swma, highlow, linreg, median
length (simple int) : Moving Average Length
Returns: ATR for the given moving average type and length
atrpercent(maType, length)
returns ATR as percentage of close price
Parameters:
maType (simple string) : Moving Average Type : Can be sma, ema, hma, rma, wma, vwma, swma, highlow, linreg, median
length (simple int) : Moving Average Length
Returns: ATR as percentage of close price for the given moving average type and length
bb(source, maType, length, multiplier, sticky)
returns Bollinger band for custom moving average
Parameters:
source (float) : Moving Average Source
maType (simple string) : Moving Average Type : Can be sma, ema, hma, rma, wma, vwma, swma, highlow, linreg, median
length (simple int) : Moving Average Length
multiplier (float) : Standard Deviation multiplier
sticky (simple bool) : - sticky boundaries which will only change when value is outside boundary.
Returns: Bollinger band with custom moving average for given source, length and multiplier
bbw(source, maType, length, multiplier, sticky)
returns Bollinger bandwidth for custom moving average
Parameters:
source (float) : Moving Average Source
maType (simple string) : Moving Average Type : Can be sma, ema, hma, rma, wma, vwma, swma, highlow, linreg, median
length (simple int) : Moving Average Length
multiplier (float) : Standard Deviation multiplier
sticky (simple bool) : - sticky boundaries which will only change when value is outside boundary.
Returns: Bollinger Bandwidth for custom moving average for given source, length and multiplier
bpercentb(source, maType, length, multiplier, sticky)
returns Bollinger Percent B for custom moving average
Parameters:
source (float) : Moving Average Source
maType (simple string) : Moving Average Type : Can be sma, ema, hma, rma, wma, vwma, swma, highlow, linreg, median
length (simple int) : Moving Average Length
multiplier (float) : Standard Deviation multiplier
sticky (simple bool) : - sticky boundaries which will only change when value is outside boundary.
Returns: Bollinger Percent B for custom moving average for given source, length and multiplier
kc(source, maType, length, multiplier, useTrueRange, sticky)
returns Keltner Channel for custom moving average
Parameters:
source (float) : Moving Average Source
maType (simple string) : Moving Average Type : Can be sma, ema, hma, rma, wma, vwma, swma, highlow, linreg, median
length (simple int) : Moving Average Length
multiplier (float) : Standard Deviation multiplier
useTrueRange (simple bool) : - if set to false, uses high-low.
sticky (simple bool) : - sticky boundaries which will only change when value is outside boundary.
Returns: Keltner Channel for custom moving average for given souce, length and multiplier
kcw(source, maType, length, multiplier, useTrueRange, sticky)
returns Keltner Channel Width with custom moving average
Parameters:
source (float) : Moving Average Source
maType (simple string) : Moving Average Type : Can be sma, ema, hma, rma, wma, vwma, swma, highlow, linreg, median
length (simple int) : Moving Average Length
multiplier (float) : Standard Deviation multiplier
useTrueRange (simple bool) : - if set to false, uses high-low.
sticky (simple bool) : - sticky boundaries which will only change when value is outside boundary.
Returns: Keltner Channel Width for custom moving average
kpercentk(source, maType, length, multiplier, useTrueRange, sticky)
returns Keltner Channel Percent K Width with custom moving average
Parameters:
source (float) : Moving Average Source
maType (simple string) : Moving Average Type : Can be sma, ema, hma, rma, wma, vwma, swma, highlow, linreg, median
length (simple int) : Moving Average Length
multiplier (float) : Standard Deviation multiplier
useTrueRange (simple bool) : - if set to false, uses high-low.
sticky (simple bool) : - sticky boundaries which will only change when value is outside boundary.
Returns: Keltner Percent K for given moving average, source, length and multiplier
dc(length, useAlternateSource, alternateSource, sticky)
returns Custom Donchian Channel
Parameters:
length (simple int) : - donchian channel length
useAlternateSource (simple bool) : - Custom source is used only if useAlternateSource is set to true
alternateSource (float) : - Custom source
sticky (simple bool) : - sticky boundaries which will only change when value is outside boundary.
Returns: Donchian channel
dcw(length, useAlternateSource, alternateSource, sticky)
returns Donchian Channel Width
Parameters:
length (simple int) : - donchian channel length
useAlternateSource (simple bool) : - Custom source is used only if useAlternateSource is set to true
alternateSource (float) : - Custom source
sticky (simple bool) : - sticky boundaries which will only change when value is outside boundary.
Returns: Donchian channel width
dpercentd(length, useAlternateSource, alternateSource, sticky)
returns Donchian Channel Percent of price
Parameters:
length (simple int) : - donchian channel length
useAlternateSource (simple bool) : - Custom source is used only if useAlternateSource is set to true
alternateSource (float) : - Custom source
sticky (simple bool) : - sticky boundaries which will only change when value is outside boundary.
Returns: Donchian channel Percent D
oscillatorRange(source, method, highlowLength, rangeLength, sticky)
oscillatorRange - returns Custom overbought/oversold areas for an oscillator input
Parameters:
source (float) : - Osillator source such as RSI, COG etc.
method (simple string) : - Valid values for method are : sma, ema, hma, rma, wma, vwma, swma, highlow, linreg, median
highlowLength (simple int) : - length on which highlow of the oscillator is calculated
rangeLength (simple int) : - length used for calculating oversold/overbought range - usually same as oscillator length
sticky (simple bool) : - overbought, oversold levels won't change unless crossed
Returns: Dynamic overbought and oversold range for oscillator input
oscillator(type, length, shortLength, longLength, source, highSource, lowSource, method, highlowLength, sticky)
oscillator - returns Choice of oscillator with custom overbought/oversold range
Parameters:
type (simple string) : - oscillator type. Valid values : cci, cmo, cog, mfi, roc, rsi, stoch, tsi, wpr
length (simple int) : - Oscillator length - not used for TSI
shortLength (simple int) : - shortLength only used for TSI
longLength (simple int) : - longLength only used for TSI
source (float) : - custom source if required
highSource (float) : - custom high source for stochastic oscillator
lowSource (float) : - custom low source for stochastic oscillator
method (simple string) : - Valid values for method are : sma, ema, hma, rma, wma, vwma, swma, highlow, linreg, median
highlowLength (simple int) : - length on which highlow of the oscillator is calculated
sticky (simple bool) : - overbought, oversold levels won't change unless crossed
Returns: Oscillator value along with dynamic overbought and oversold range for oscillator input

PitchforkLibrary "Pitchfork"
Pitchfork class
method tostring(this)
Converts PitchforkTypes/Fork object to string representation
Namespace types: Fork
Parameters:
this (Fork) : PitchforkTypes/Fork object
Returns: string representation of PitchforkTypes/Fork
method tostring(this)
Converts Array of PitchforkTypes/Fork object to string representation
Namespace types: array
Parameters:
this (array) : Array of PitchforkTypes/Fork object
Returns: string representation of PitchforkTypes/Fork array
method tostring(this, sortKeys, sortOrder)
Converts PitchforkTypes/PitchforkProperties object to string representation
Namespace types: PitchforkProperties
Parameters:
this (PitchforkProperties) : PitchforkTypes/PitchforkProperties object
sortKeys (bool) : If set to true, string output is sorted by keys.
sortOrder (int) : Applicable only if sortKeys is set to true. Positive number will sort them in ascending order whreas negative numer will sort them in descending order. Passing 0 will not sort the keys
Returns: string representation of PitchforkTypes/PitchforkProperties
method tostring(this, sortKeys, sortOrder)
Converts PitchforkTypes/PitchforkDrawingProperties object to string representation
Namespace types: PitchforkDrawingProperties
Parameters:
this (PitchforkDrawingProperties) : PitchforkTypes/PitchforkDrawingProperties object
sortKeys (bool) : If set to true, string output is sorted by keys.
sortOrder (int) : Applicable only if sortKeys is set to true. Positive number will sort them in ascending order whreas negative numer will sort them in descending order. Passing 0 will not sort the keys
Returns: string representation of PitchforkTypes/PitchforkDrawingProperties
method tostring(this, sortKeys, sortOrder)
Converts PitchforkTypes/Pitchfork object to string representation
Namespace types: Pitchfork
Parameters:
this (Pitchfork) : PitchforkTypes/Pitchfork object
sortKeys (bool) : If set to true, string output is sorted by keys.
sortOrder (int) : Applicable only if sortKeys is set to true. Positive number will sort them in ascending order whreas negative numer will sort them in descending order. Passing 0 will not sort the keys
Returns: string representation of PitchforkTypes/Pitchfork
method createDrawing(this)
Creates PitchforkTypes/PitchforkDrawing from PitchforkTypes/Pitchfork object
Namespace types: Pitchfork
Parameters:
this (Pitchfork) : PitchforkTypes/Pitchfork object
Returns: PitchforkTypes/PitchforkDrawing object created
method createDrawing(this)
Creates PitchforkTypes/PitchforkDrawing array from PitchforkTypes/Pitchfork array of objects
Namespace types: array
Parameters:
this (array) : array of PitchforkTypes/Pitchfork object
Returns: array of PitchforkTypes/PitchforkDrawing object created
method draw(this)
draws from PitchforkTypes/PitchforkDrawing object
Namespace types: PitchforkDrawing
Parameters:
this (PitchforkDrawing) : PitchforkTypes/PitchforkDrawing object
Returns: PitchforkTypes/PitchforkDrawing object drawn
method delete(this)
deletes PitchforkTypes/PitchforkDrawing object
Namespace types: PitchforkDrawing
Parameters:
this (PitchforkDrawing) : PitchforkTypes/PitchforkDrawing object
Returns: PitchforkTypes/PitchforkDrawing object deleted
method delete(this)
deletes underlying drawing of PitchforkTypes/Pitchfork object
Namespace types: Pitchfork
Parameters:
this (Pitchfork) : PitchforkTypes/Pitchfork object
Returns: PitchforkTypes/Pitchfork object deleted
method delete(this)
deletes array of PitchforkTypes/PitchforkDrawing objects
Namespace types: array
Parameters:
this (array) : Array of PitchforkTypes/PitchforkDrawing object
Returns: Array of PitchforkTypes/PitchforkDrawing object deleted
method delete(this)
deletes underlying drawing in array of PitchforkTypes/Pitchfork objects
Namespace types: array
Parameters:
this (array) : Array of PitchforkTypes/Pitchfork object
Returns: Array of PitchforkTypes/Pitchfork object deleted
method clear(this)
deletes array of PitchforkTypes/PitchforkDrawing objects and clears the array
Namespace types: array
Parameters:
this (array) : Array of PitchforkTypes/PitchforkDrawing object
Returns: void
method clear(this)
deletes array of PitchforkTypes/Pitchfork objects and clears the array
Namespace types: array
Parameters:
this (array) : Array of Pitchfork/Pitchfork object
Returns: void
PitchforkDrawingProperties
Pitchfork Drawing Properties object
Fields:
extend (series bool) : If set to true, forks are extended towards right. Default is true
fill (series bool) : Fill forklines with transparent color. Default is true
fillTransparency (series int) : Transparency at which fills are made. Only considered when fill is set. Default is 80
forceCommonColor (series bool) : Force use of common color for forks and fills. Default is false
commonColor (series color) : common fill color. Used only if ratio specific fill colors are not available or if forceCommonColor is set to true.
PitchforkDrawing
Pitchfork drawing components
Fields:
medianLine (Line type from Trendoscope/Drawing/2) : Median line of the pitchfork
baseLine (Line type from Trendoscope/Drawing/2) : Base line of the pitchfork
forkLines (array type from Trendoscope/Drawing/2) : fork lines of the pitchfork
linefills (array type from Trendoscope/Drawing/2) : Linefills between forks
Fork
Fork object property
Fields:
ratio (series float) : Fork ratio
forkColor (series color) : color of fork. Default is blue
include (series bool) : flag to include the fork in drawing. Default is true
PitchforkProperties
Pitchfork Properties
Fields:
forks (array) : Array of Fork objects
type (series string) : Pitchfork type. Supported values are "regular", "schiff", "mschiff", Default is regular
inside (series bool) : Flag to identify if to draw inside fork. If set to true, inside fork will be drawn
Pitchfork
Pitchfork object
Fields:
a (chart.point) : Pivot Point A of pitchfork
b (chart.point) : Pivot Point B of pitchfork
c (chart.point) : Pivot Point C of pitchfork
properties (PitchforkProperties) : PitchforkProperties object which determines type and composition of pitchfork
dProperties (PitchforkDrawingProperties) : Drawing properties for pitchfork
lProperties (LineProperties type from Trendoscope/Drawing/2) : Common line properties for Pitchfork lines
drawing (PitchforkDrawing) : PitchforkDrawing object
FibRatiosLibrary "FibRatios"
Library with calculation logic for fib retracement, extension and ratios
retracement(a, b, ratio, logScale, precision)
Calculates the retracement for points a, b with given ratio and scale
Parameters:
a (float) : Starting point a
b (float) : Second point b
ratio (float) : Ratio for which we need to calculate retracement c
logScale (bool) : Flag to get calculations in log scale. Default is false
precision (int) : rounding precision. If set to netagive number, round_to_mintick is applied. Default is -1
Returns: retracement point c for points a,b with given ratio and scale
retracementRatio(a, b, c, logScale, precision)
Calculates the retracement ratio for points a, b, c with given scale
Parameters:
a (float) : Starting point a
b (float) : Second point b
c (float) : Retracement point. c should be placed between a and b
logScale (bool) : Flag to get calculations in log scale. Default is false
precision (int) : rounding precision. If set to netagive number, round_to_mintick is applied. Default is 3
Returns: retracement ratio for points a,b,c on given scale
extension(a, b, c, ratio, logScale, precision)
Calculates the extensions for points a, b, c with given ratio and scale
Parameters:
a (float) : Starting point a
b (float) : Second point b
c (float) : Retracement point. c should be placed between a and b
ratio (float) : Ratio for which we need to calculate extension d
logScale (bool) : Flag to get calculations in log scale. Default is false
precision (int) : rounding precision. If set to netagive number, round_to_mintick is applied. Default is -1
Returns: extensoin point d for points a,b,c with given ratio and scale
extensionRatio(a, b, c, d, logScale, precision)
Calculates the extension ratio for points a, b, c, d with given scale
Parameters:
a (float) : Starting point a
b (float) : Second point b
c (float) : Retracement point. c should be placed between a and b
d (float) : Extension point. d should be placed beyond a, c. But, can be with b,c or beyond b
logScale (bool) : Flag to get calculations in log scale. Default is false
precision (int) : rounding precision. If set to netagive number, round_to_mintick is applied. Default is 3
Returns: extension ratio for points a,b,c,d on given scale

alertsLibrary "alerts"
The library provides options to run alert() calls in loop without worrying about limitations of frequency options.
When an alert statement is called within a loop,
it will fire just once per bar irrespective of how many iterations allowed when fequency is set to alert.freq_once_per_bar or alert.freq_once_per_bar_close
it will fire continuously till it breaks when frequency is set to alert.freq_all
The function helps overcome this issue by using varip key array which resets on every bar
method alert(message, key)
Enhanced alert which can be used in loops
Namespace types: series string, simple string, input string, const string
Parameters:
message (string) : Alert message to be fired
key (string) : Key to be checked to avoid repetitive alerts
Returns: array containing id of already fired alerts
method updateAlertTemplate(this, template)
Updates alert template with given keys and values
Namespace types: map
Parameters:
this (map) : map containing key value pair
template (string) : Alert message template
Returns: updated alert message

utilsLibrary "utils"
Few essentials captured together (subset of arrayutils)
timer(timeStart, timeEnd)
finds difference between two timestamps
Parameters:
timeStart (int) : start timestamp
timeEnd (int)
Returns:
method check_overflow(pivots, barArray, dir)
finds difference between two timestamps
Namespace types: array
Parameters:
pivots (array) : pivots array
barArray (array) : pivot bar array
dir (int) : direction for which overflow need to be checked
Returns: bool overflow
method get_trend_series(pivots, length, highLow, trend)
finds series of pivots in particular trend
Namespace types: array
Parameters:
pivots (array) : pivots array
length (int) : length for which trend series need to be checked
highLow (int) : filter pivot high or low
trend (int) : Uptrend or Downtrend
Returns: int trendIndexes
method get_trend_series(pivots, firstIndex, lastIndex)
finds series of pivots in particular trend
Namespace types: array
Parameters:
pivots (array) : pivots array
firstIndex (int) : First index of the series
lastIndex (int) : Last index of the series
Returns: int trendIndexes
getConsolidatedLabel(include, labels, separator)
Consolidates labels into single string by concatenating it with given separator
Parameters:
include (array) : array of conditions to include label or not
labels (array) : string array of labels
separator (string) : Separator for concatenating labels
Returns: string labelText
method getColors(theme)
gets array of colors based on theme
Namespace types: series Theme
Parameters:
theme (series Theme) : dark or light theme
Returns: color themeColors

HTFCandlesLibLibrary "HTFCandlesLib"
Library to get detailed higher timeframe candle information
method tostring(this, delimeter)
Returns OHLC values, BarIndex of higher and lower timeframe candles in string format
Namespace types: Candle
Parameters:
this (Candle) : Current Candle object
delimeter (string) : delimeter to join the string components of the candle
Returns: String representation of the Candle
method draw(this, bullishColor, bearishColor, printDescription)
Draws the current candle using boxes and lines for body and wicks
Namespace types: Candle
Parameters:
this (Candle) : Current Candle object
bullishColor (color) : color for bullish representation
bearishColor (color) : color for bearish representation
printDescription (bool) : if set to true prints the description
Returns: Current candle object
getCurrentCandle(ltfCandles)
Gets the current candle along with reassigned ltf components. To be used with request.security to capture higher timeframe candle data
Parameters:
ltfCandles (array) : Lower timeframe Candles array
Returns: Candle object with embedded lower timeframe key candles in them
Candle
Candle represents the data related to a candle
Fields:
o (series float) : Open price of the candle
h (series float) : High price of the candle
l (series float) : Low price of the candle
c (series float) : Close price of the candle
lo (Candle) : Lower timeframe candle that records the open price of the current candle.
lh (Candle) : Lower timeframe candle that records the high price of the current candle.
ll (Candle) : Lower timeframe candle that records the low price of the current candle.
lc (Candle) : Lower timeframe candle that records the close price of the current candle.
barindex (series int) : Bar Index of the candle
bartime (series int) : Bar time of the candle
last (Candle) : Link to last candle of the series if any
