200 EMA w/ Ticker Memory200 EMA w/ Ticker Memory — Multi-Symbol & Multi-Timeframe EMA Tracker with Alerts
Overview
The 200 EMA w/ Ticker Memory indicator allows you to monitor the 200-period Exponential Moving Average (EMA) across multiple symbols and timeframes. Designed for traders managing multiple tickers, it provides customizable timeframe inputs per symbol and instant alerts on price touches of the 200 EMA.
Key Features
Multi-symbol support: Configure up to 20 different symbols, each with its own timeframe setting.
Flexible timeframe input: Assign specific timeframes per symbol or use a default timeframe fallback.
Accurate 200 EMA calculation: Uses request.security to fetch 200 EMA from the symbol-specific timeframe.
Visual EMA plots: Displays both the EMA on the selected timeframe and the EMA on the current chart timeframe for comparison.
Touch alerts: Configurable alerts when price “touches” the 200 EMA within a user-defined sensitivity percentage.
Ticker memory: Remembers your configured symbols and displays them in an on-chart table.
Compact info table: Displays current symbol status, alert settings, and timeframe in a clean, transparent table overlay.
How to Use
Configure Symbols and Timeframes:
Input your desired symbols (up to 20) and their respective timeframes under the “Symbol Settings” groups in the indicator’s settings pane.
Set Default Timeframe:
Choose a default timeframe to be used when no specific timeframe is assigned for a symbol.
Adjust Alert Settings:
Enable or disable alerts and set the touch sensitivity (% distance from EMA to trigger alerts).
Alerts
Alerts trigger once per bar when the price touches the 200 EMA within the defined sensitivity threshold.
Alert messages include:
Symbol / Current price / EMA value / EMA timeframe used / Chart timeframe / Timestamp
Customization
200 EMA Color: Change the line color for better visibility.
Touch Sensitivity: Fine-tune how close price must be to the EMA to count as a touch (default 0.1%).
Enable Touch Alerts: Turn on/off alert notifications easily.
For:
- Swing traders monitoring multiple stocks or assets.
- Day traders watching key EMA levels on different timeframes.
- Analysts requiring a quick visual and alert system for 200 EMA touches.
- Portfolio managers tracking key technical levels across various securities.
Limitations
Supports up to 20 configured symbols (can be extended manually if needed).
Works best on charts with reasonable bar frequency due to request.security usage.
Alert frequency is limited to once per bar for clarity.
Disclaimer
This indicator is provided “as-is” for educational and informational purposes only. It does not guarantee trading success or financial gain.
Trendfollowing

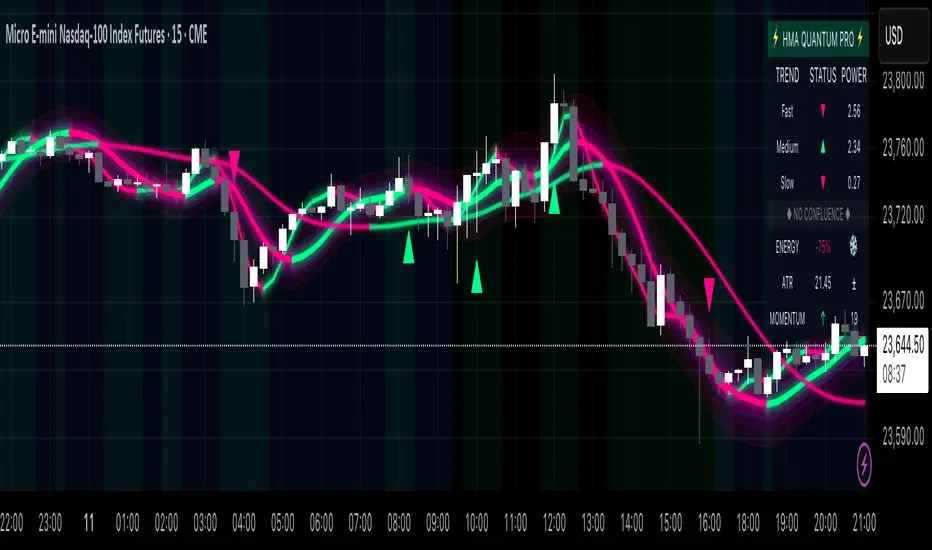
Hull Moving Average Quantum Pro - Advanced Trading SystemThe Hull Moving Average Quantum Pro is a next-generation technical analysis tool that combines the legendary smoothness of Alan Hull's HMA formula with advanced quantum field visualization technology. This professional-grade indicator features three synchronized Hull Moving Average periods working in harmony to identify high-probability trading opportunities.
🎯 KEY FEATURES:
• Multi-Timeframe HMA Confluence - Triple HMA system (9, 21, 55 periods) for comprehensive trend analysis
• Quantum Field Visualization - Fibonacci-based dynamic support/resistance bands with 0.618, 1.0, and 1.618 ratios
• Energy Flow Momentum - Real-time visual representation of market momentum and directional bias
• Confluence Zone Detection - Automatically highlights areas where multiple HMAs converge for high-probability setups
• Professional Holographic Dashboard - Real-time trend strength, momentum, and market status display
• Three Visual Themes - Dark Intergalactic (Quantum Trading), Light Minimal (Clean Charts), Pro Modern (Low Saturation)
⚡ WHAT MAKES IT UNIQUE:
Unlike traditional moving average indicators, the HMA Quantum Pro eliminates lag while maintaining smoothness, providing traders with faster signals without sacrificing reliability. The quantum field visualization adds a new dimension to price action analysis by creating dynamic zones that adapt to market volatility.
📊 PERFECT FOR:
• Day Trading & Scalping - Fast HMA (9) provides quick entry/exit signals
• Swing Trading - Medium HMA (21) confirms trend continuation
• Position Trading - Slow HMA (55) identifies major trend changes
• All Markets - Forex, Stocks, Crypto, Futures, Indices
🔧 ADVANCED SETTINGS:
• Customizable HMA periods for any trading style
• Adjustable confluence threshold for precision filtering
• Visual intensity control for optimal chart clarity
• Field transparency settings for multi-indicator setups
💡 HOW TO USE:
1. Strong Bullish Signal - All three HMAs aligned upward with price above quantum fields
2. Strong Bearish Signal - All three HMAs aligned downward with price below quantum fields
3. Confluence Zones - High probability reversal/continuation areas
4. Energy Flow - Confirms momentum direction and strength
⭐ FREE VERSION FEATURES:
This free version includes all visual features and calculations. Premium version (coming soon) will add advanced alerts, multi-timeframe analysis, and AI-powered trade suggestions.
Created by professional traders for serious market participants. The Hull Moving Average formula was created by Alan Hull to reduce lag while maintaining smoothness - this indicator enhances that foundation with modern visualization technology.
EMA Triad Vanguard Pro [By TraderMan]📌 EMA Triad Vanguard Pro — Advanced Trend & Position Management System
📖 Introduction
EMA Triad Vanguard Pro is an advanced indicator that utilizes three different EMAs (Exponential Moving Averages) to analyze the direction, strength, and reliability of market trends.
It goes beyond a single timeframe, performing trend analysis across 8 different timeframes simultaneously and automatically tracking TP/SL management.
This makes it a powerful reference tool for both short-term traders and medium-to-long-term swing traders.
⚙ How It Works
EMAs:
EMA 21 → Responds quickly to short-term price changes.
EMA 50 → Shows medium-term price direction.
EMA 200 → Determines the long-term market trend.
Trend Direction Logic:
📈 Long Signal: EMA 21 crosses above EMA 200 and EMA 21 > EMA 50.
📉 Short Signal: EMA 21 crosses below EMA 200 and EMA 21 < EMA 50.
Trend Strength Calculation:
Calculates the percentage distance between EMAs.
Strength levels: Very Weak → Weak → Strong → Very Strong.
Multi-Timeframe Analysis:
Analyzes trend direction for: 5min, 15min, 30min, 1H, 4H, Daily, Weekly, and Monthly charts.
Generates an overall market bias from combined results.
Automatic Position Management:
When a position is opened, TP1, TP2, TP3, and SL levels are calculated automatically.
As price reaches these levels, chart labels appear (TP1★, TP2★, TP3★, SL!).
📊 How to Use
1️⃣ Long (Buy) Setup
EMA 21 must cross above EMA 200 ✅
EMA 21 must be above EMA 50 ✅
Overall market bias should be “Bullish” ✅
Entry Price: closing price of the signal candle.
TP levels: calculated based on upward % targets.
SL: a set % below the entry price.
2️⃣ Short (Sell) Setup
EMA 21 must cross below EMA 200 ✅
EMA 21 must be below EMA 50 ✅
Overall market bias should be “Bearish” ✅
Entry Price: closing price of the signal candle.
TP levels: calculated based on downward % targets.
SL: a set % above the entry price.
💡 Pro Tips
Multi-timeframe alignment significantly increases the signal reliability.
If trend strength is “Very Strong”, chances of hitting TP targets are higher.
Weak trends may cause false signals → confirm with extra indicators (RSI, MACD, Volume).
TP levels are ideal for partial take-profits → lock in gains and reduce risk.
📌 Advantages
✅ Displays both trend direction and trend strength at a glance.
✅ Multi-timeframe approach avoids tunnel vision from a single chart.
✅ Automatic TP/SL calculation eliminates manual measuring.
✅ Labeled signal alerts make tracking positions easy and visual.
⚠ Important Notes
No indicator is 100% accurate — sudden news events or manipulations may cause false signals.
Use it together with other technical and fundamental analysis methods.
Signal reliability may decrease in low liquidity markets.
🎯 In summary:
EMA Triad Vanguard Pro combines trend tracking, position management, and multi-timeframe analysis in a single package, helping professional traders reduce workload and make more strategic trades.

SAR PowerTrend Analyzer Pro [By TraderMan]📈 SAR PowerTrend Analyzer Pro
Hello Trader! 👋 This powerful SAR PowerTrend Analyzer Pro indicator analyzes market trends across multiple timeframes by combining Parabolic SAR and ATR indicators to provide clear and actionable signals. Designed for everyone who wants to track trends and enter trades confidently on TradingView. Here’s the detailed breakdown:
🔍 What’s the core concept?
Parabolic SAR (Stop and Reverse):
A classic tool to detect price reversals and determine trend direction. When price is above SAR → uptrend (bullish), below SAR → downtrend (bearish).
ATR (Average True Range):
Measures price volatility. A higher ATR means stronger trend potential; lower ATR means weak or indecisive trends.
This indicator merges these two to not only tell “up or down” but also provide a numerical trend strength reading. So you can clearly know when a trend is strong or weak.
⏱️ Comprehensive Multi-Timeframe Analysis
It doesn’t rely on just one timeframe! 📊
5 min, 15 min
1 hour, 4 hours
1 day, 1 week, 1 month
Tracking trends on all these simultaneously gives you a more reliable market overview. Helps avoid false signals from short-term noise and align with long-term trends.
🎯 How to use it? (Entry Signals)
Long Signal:
Price crosses SAR line from below → shows “LONG” label and green trend color, indicating bullish momentum.
Short Signal:
Price crosses SAR line from above → shows “SHORT” label and red trend color, signaling bearish trend start.
📊 Visuals and Table on Chart
SAR lines plotted above and below price with clear green/red colors.
Background color changes with trend direction for instant visual feedback.
Top-right table shows each timeframe’s:
Trend Direction (Bullish/Bearish)
Trend Strength (numerical value 0 to 1)
General market direction and strength are summarized in the table’s bottom rows.
⚡ Things to watch before entering trades
Check the table! If most timeframes are Bullish and strong, consider LONG positions.
If most are Bearish and strong, SHORT positions might be safer.
Avoid relying on single timeframe signals, wait for multi-timeframe confirmation.
Always watch price action and volume.
Place stop losses just outside the SAR line to manage risk effectively.
Risk management is key! Protecting your capital matters as much as making profits.
🎉 Why use this indicator?
✅ Multi-timeframe analysis brings the bigger picture to your screen.
✅ Clear color-coded signals make trend following easy and intuitive.
✅ Numerical trend strength optimizes your entry/exit decisions.
✅ Suitable for beginners and pros alike.
✅ Fast, stable, and visually clean on TradingView.
🧠 Pro Tip:
This indicator works best when combined with other technical tools and news analysis. There’s no “magic single indicator,” but a smart combination wins the race! 😉
✨ Add this powerful trend analysis tool to your charts now, catch the market’s rhythm, and boost your gains! 🚀📈

Mutanabby_AI | Ultimate Algo | Remastered+Overview
The Mutanabby_AI Ultimate Algo Remastered+ represents a sophisticated trend-following system that combines Supertrend analysis with multiple moving average confirmations. This comprehensive indicator is designed specifically for identifying high-probability trend continuation and reversal opportunities across various market conditions.
Core Algorithm Components
**Supertrend Foundation**: The primary signal generation relies on a customizable Supertrend indicator with adjustable sensitivity (1-20 range). This adaptive trend-following tool uses Average True Range calculations to establish dynamic support and resistance levels that respond to market volatility.
**SMA Confirmation Matrix**: Multiple Simple Moving Averages (SMA 4, 5, 9, 13) provide layered confirmation for signal strength. The algorithm distinguishes between regular signals and "Strong" signals based on SMA 4 vs SMA 5 relationship, offering traders different conviction levels for position sizing.
**Trend Ribbon Visualization**: SMA 21 and SMA 34 create a visual trend ribbon that changes color based on their relationship. Green ribbon indicates bullish momentum while red signals bearish conditions, providing immediate visual trend context.
**RSI-Based Candle Coloring**: Advanced 61-tier RSI system colors candles with gradient precision from deep red (RSI ≤20) through purple transitions to bright green (RSI ≥79). This visual enhancement helps traders instantly assess momentum strength and overbought/oversold conditions.
Signal Generation Logic
**Buy Signal Criteria**:
- Price crosses above Supertrend line
- Close price must be above SMA 9 (trend confirmation)
- Signal strength determined by SMA 4 vs SMA 5 relationship
- "Strong Buy" when SMA 4 ≥ SMA 5
- Regular "Buy" when SMA 4 < SMA 5
**Sell Signal Criteria**:
- Price crosses below Supertrend line
- Close price must be below SMA 9 (trend confirmation)
- Signal strength based on SMA relationship
- "Strong Sell" when SMA 4 ≤ SMA 5
- Regular "Sell" when SMA 4 > SMA 5
Advanced Risk Management System
**Automated TP/SL Calculation**: The indicator automatically calculates stop loss and take profit levels using ATR-based measurements. Risk percentage and ATR length are fully customizable, allowing traders to adapt to different market conditions and personal risk tolerance.
**Multiple Take Profit Targets**:
- 1:1 Risk-Reward ratio for conservative profit taking
- 2:1 Risk-Reward for balanced trade management
- 3:1 Risk-Reward for maximum profit potential
**Visual Risk Display**: All risk management levels appear as both labels and optional trend lines on the chart. Customizable line styles (solid, dashed, dotted) and positioning ensure clear visualization without chart clutter.
**Dynamic Level Updates**: Risk levels automatically recalculate with each new signal, maintaining current market relevance throughout position lifecycles.
Visual Enhancement Features
**Customizable Display Options**: Toggle trend ribbon, TP/SL levels, and risk lines independently. Decimal precision adjustments (1-8 decimal places) accommodate different instrument price formats and personal preferences.
**Professional Label System**: Clean, informative labels show entry points, stop losses, and take profit targets with precise price levels. Labels automatically position themselves for optimal chart readability.
**Color-Coded Momentum**: The gradient RSI candle coloring system provides instant visual feedback on momentum strength, helping traders assess market energy and potential reversal zones.
Implementation Strategy
**Timeframe Optimization**: The algorithm performs effectively across multiple timeframes, with higher timeframes (4H, Daily) providing more reliable signals for swing trading. Lower timeframes work well for day trading with appropriate risk adjustments.
**Sensitivity Adjustment**: Lower sensitivity values (1-5) generate fewer but higher-quality signals, ideal for conservative approaches. Higher sensitivity (15-20) increases signal frequency for active trading styles.
**Risk Management Integration**: Use the automated risk calculations as baseline parameters, adjusting risk percentage based on account size and market conditions. The 1:1, 2:1, 3:1 targets enable systematic profit-taking strategies.
Market Application
**Trend Following Excellence**: Primary strength lies in capturing significant trend movements through the Supertrend foundation with SMA confirmation. The dual-layer approach reduces false signals common in single-indicator systems.
**Momentum Assessment**: RSI-based candle coloring provides immediate momentum context, helping traders assess signal strength and potential continuation probability.
**Range Detection**: The trend ribbon helps identify ranging conditions when SMA 21 and SMA 34 converge, alerting traders to potential breakout opportunities.
Performance Optimization
**Signal Quality**: The requirement for both Supertrend crossover AND SMA 9 confirmation significantly improves signal reliability compared to basic trend-following approaches.
**Visual Clarity**: The comprehensive visual system enables rapid market assessment without complex calculations, ideal for traders managing multiple instruments.
**Adaptability**: Extensive customization options allow fine-tuning for specific markets, trading styles, and risk preferences while maintaining the core algorithm integrity.
## Non-Repainting Design
**Educational Note**: This indicator uses standard TradingView functions (Supertrend, SMA, RSI) with normal behavior patterns. Real-time updates on current candles are expected and standard across all technical indicators. Historical signals on closed candles remain fixed and unchanged, ensuring reliable backtesting and analysis.
**Signal Confirmation**: Final signals are confirmed only when candles close, following standard technical analysis principles. The algorithm provides clear distinction between developing signals and confirmed entries.
Technical Specifications
**Supertrend Parameters**: Default sensitivity of 4 with ATR length of 11 provides balanced signal generation. Sensitivity range from 1-20 allows adaptation to different market volatilities and trading preferences.
**Moving Average Configuration**: SMA periods of 8, 9, and 13 create multi-layered trend confirmation, while SMA 21 and 34 form the visual trend ribbon for broader market context.
**Risk Management**: ATR-based calculations with customizable risk percentage ensure dynamic adaptation to market volatility while maintaining consistent risk exposure principles.
Recommended Settings
**Conservative Approach**: Sensitivity 4-5, RSI length 14, higher timeframes (4H, Daily) for swing trading with maximum signal reliability.
**Active Trading**: Sensitivity 6-8, RSI length 8-10, intermediate timeframes (1H) for balanced signal frequency and quality.
**Scalping Setup**: Sensitivity 10-15, RSI length 5-8, lower timeframes (15-30min) with enhanced risk management protocols.
## Conclusion
The Mutanabby_AI Ultimate Algo Remastered+ combines proven trend-following principles with modern visual enhancements and comprehensive risk management. The algorithm's strength lies in its multi-layered confirmation approach and automated risk calculations, providing both novice and experienced traders with clear signals and systematic trade management.
Success with this system requires understanding the relationship between signal strength indicators and adapting sensitivity settings to match current market conditions. The comprehensive visual feedback system enables rapid decision-making while the automated risk management ensures consistent trade parameters.
Practice with different sensitivity settings and timeframes to optimize performance for your specific trading style and risk tolerance. The algorithm's systematic approach provides an excellent framework for disciplined trend-following strategies across various market environments.

Zero Lag Liquidity [AlgoAlpha]🟠 OVERVIEW
This script plots liquidity zones with zero lag using lower-timeframe wick profiles and high-volume wicks to mark key price reactions. It’s called Zero Lag Liquidity because it captures significant liquidity imbalances in real time by processing lower-TF price-volume distributions directly inside the wick of abnormal candles. The tool builds a volume histogram inside long upper/lower wicks, then calculates a local Point of Control (POC) to mark the price where most volume occurred. These levels act as visual liquidity zones, which can trigger labels, break signals, and trend detection depending on price interaction.
🟠 CONCEPTS
The core concept relies on identifying high-volume candles with unusually long wicks—often a sign of opposing liquidity. When a large upper or lower wick appears with a strong volume spike, the script builds a histogram of lower-timeframe closes and volumes inside that wick. It bins the wick into segments, sums volume per bin, and finds the POC. This POC becomes the liquidity level. The script then dynamically tracks whether price breaks above or rejects off these levels, adjusts the active trend regime accordingly, and highlights bars to help users spot continuation or reversal behavior. The logic avoids repainting or subjective interpretation by using fixed thresholds and lower-TF price action.
🟠 FEATURES
Dynamic liquidity levels rendered at POC of significant wicks, colored by bullish/bearish direction.
Break detection that removes levels once price decisively crosses them twice in the same direction.
Rejection detection that plots ▲/▼ markers when price bounces off levels intrabar.
Volume labels for each level, shown either as raw volume or percentage of total level volume.
Candle coloring based on trend direction (break-dominant).
🟠 USAGE
Use this indicator to track where liquidity has most likely entered the market via abnormal wick events. When a long wick forms with high volume, the script looks inside it (using your chosen lower timeframe) and marks the most traded price within it. These levels can serve as expected reversal or breakout zones. Rejections are marked with small arrows, while breaks trigger trend shifts and remove the level. You can toggle trend coloring to see directional bias after a breakout. Use the wick multiplier to control how selective the detector is (higher = stricter). Alerts and label modes help customize the signal for different asset types and chart styles.

TrendGradient [By TraderMan]TrendGradient Indicator: What It Does, How It Works, and How to Use It 📊✨
The **TrendGradient ** indicator is a Pine Script tool designed for the TradingView platform, assisting traders in trend analysis, generating buy/sell signals, and determining target price (TP) and stop-loss (SL) levels. In this guide, I’ll explain in detail what the indicator does, how it operates, how to use it, and strategies for opening positions. Get ready to dive into this colorful and powerful tool! 🚀
🌟 **What Is TrendGradient and What Does It Do?**
TrendGradient is an indicator that analyzes price movements to identify trend direction and strength while generating actionable buy and sell signals. Here are its core functions:
1. **Trend Tracking**: Uses 38-period and 62-period Exponential Moving Averages (EMAs) to determine the trend direction (bullish or bearish).
2. **Buy/Sell Signals**: Generates signals based on EMA crossovers and crossunders.
3. **Target and Stop Levels**: Calculates entry, take-profit (TP1, TP2, TP3), and stop-loss (SL) levels using the Average True Range (ATR).
4. **Volatility and Trend Analysis**: Visualizes volatility levels (low, medium, high) and trend strength (strong/weak) via ATR and EMA.
5. **Visual Clarity**: Provides a user-friendly interface with colored lines, labels, tables, and shapes.
This indicator is ideal for trend-following traders and can be used for both short-term (scalping/day trading) and long-term strategies. 📈
---
### 🛠️ **How Does TrendGradient Work?**
Let’s break down the indicator’s mechanics step by step:
#### 1. **EMA-Based Trend Analysis** 📉
- **EMA 38 and EMA 62**: The indicator uses 38-period and 62-period Exponential Moving Averages to smooth price data and identify trend direction.
- **EMA 38 > EMA 62**: Bullish trend (uptrend) 📈
- **EMA 38 < EMA 62**: Bearish trend (downtrend) 📉
- EMA crossovers trigger buy/sell signals:
- **Crossover (EMA 38 crosses above EMA 62)**: Buy signal (BUY).
- **Crossunder (EMA 38 crosses below EMA 62)**: Sell signal (SELL).
- The EMAs focus on the last 20 days of data to display recent trends only.
#### 2. **ATR-Based Levels** ⚖️
- **ATR (Average True Range)**: Measures price volatility and is used to calculate entry, TP, and SL levels.
- **Entry Price**: For buys, the closing price plus an ATR multiplier; for sells, the closing price minus an ATR multiplier.
- **Take-Profit Levels (TP1, TP2, TP3)**: Calculated by adding/subtracting ATR multiples (default: 2.0, 4.0, 6.0) to/from the entry price.
- **Stop-Loss (SL)**: Set at a distance from the entry price using an ATR multiplier (default: 2.0 + additional SL).
- These levels are visualized on the chart with colored lines (yellow: entry, green: TP1, teal: TP2, blue: TP3, red: SL) and labels.
#### 3. **Signal and Status Visualization** 🖼️
- **Lines and Labels**: Buy/sell signals are marked with green "BUY" and red "SELL" labels on the chart.
- **Table**: A table in the top-right corner summarizes signal status, entry/TP/SL levels, trend strength, volatility, and trend direction.
- **Color Coding**:
- Green: Bullish trend, buy signal, or TP achievements.
- Red: Bearish trend, sell signal, or SL triggered.
- Yellow, teal, blue: Entry and TP levels.
- **Bar Coloring**: Bars are colored green (bullish) or red (bearish) based on EMA alignment.
#### 4. **TP/SL Monitoring** ✅❌
- The indicator checks if the price hits TP or SL levels and displays labels like "✔️ TP Achieved" or "❌ SL Stopped Out."
- When a TP or SL is hit, the position status updates (e.g., "In Progress ⏳", "Successful ✅", or "Failed ❌").
#### 5. **Volatility and Trend Strength** 📊
- **Volatility (ATR)**: Classified as "Low" (red), "Medium" (orange), or "High" (green) based on the ATR’s position within its 50-bar range.
- **Trend Strength**: If EMA 38 > EMA 62, the trend is "Strong" (green); otherwise, it’s "Weak" (red).
---
### 📋 **How to Use TrendGradient?**
Follow these steps to effectively use TrendGradient:
#### 1. **Add the Indicator to TradingView** 🖥️
- In TradingView, search for "TrendGradient " in the **Indicators** menu and add it to your chart.
- Use default settings or customize parameters like ATR period, multipliers, and display duration (default: 20 days) in the **Settings** menu.
#### 2. **Identify Signals** 🔍
- **Buy Signal (BUY)**: Appears when a green "BUY" label is displayed and EMA 38 crosses above EMA 62.
- **Sell Signal (SELL)**: Appears when a red "SELL" label is displayed and EMA 38 crosses below EMA 62.
- Check the top-right table for signal status ("BUY", "SELL", or "-") and position levels (Entry, TP1, TP2, TP3, SL).
#### 3. **Opening a Position** 🚪
- **Long Position (Buy)**:
1. When a "BUY" signal appears, check the entry price (yellow line).
2. Open a position at or near the entry price.
3. Set TP1, TP2, TP3 (green, teal, blue lines) and SL (red line) as targets/stops.
- **Short Position (Sell)**:
1. When a "SELL" signal appears, check the entry price.
2. Open a position at or near the entry price.
3. Use TP and SL levels as targets/stops.
- **Note**: ATR-based levels adjust dynamically to market volatility, ensuring adaptability.
#### 4. **Position Management** 🛡️
- **Take-Profit (TP)**: Realize profits when the price hits TP1, TP2, or TP3. For example, close part of the position at TP1 and hold the rest for TP2/TP3.
- **Stop-Loss (SL)**: Close the position if the price hits the SL level ("❌ SL Stopped Out" appears).
- **Partial Closes**: Use multiple TP levels to scale out of positions incrementally.
#### 5. **Trend and Volatility Analysis** 📊
- **Trend Direction and Strength**: The table shows whether the trend is "Up" or "Down" and its strength ("Strong" or "Weak"). Strong trends may warrant more aggressive positions.
- **Volatility**: ATR-based volatility indicators help gauge market conditions. High volatility (green) suggests larger price moves, while low volatility (red) indicates calmer markets.
#### 6. **Risk Management** ⚠️
- Always use the SL level and assess the risk/reward ratio (e.g., 2:1 for TP1, 4:1 for TP2).
- In low volatility (red), consider smaller positions; in high volatility (green), expect larger moves.
---
### 🛠️ **Example Position Opening Scenario**
**Scenario: Long Position**
- **Situation**: EMA 38 crosses above EMA 62, and a green "BUY" label appears.
- **Entry Price**: 100 (yellow line).
- **TP Levels**: TP1: 104, TP2: 108, TP3: 112.
- **SL Level**: 96.
- **Strategy**:
1. Open a long position at 100.
2. Close 50% of the position at TP1 (104), hold the rest for TP2 (108) or TP3 (112).
3. Exit fully if the price hits SL (96).
- **Table Status**: "Signal: BUY", "Position Status: In Progress ⏳", "Trend Strength: Strong", "Volatility: High".
**Scenario: Short Position**
- **Situation**: EMA 38 crosses below EMA 62, and a red "SELL" label appears.
- **Entry Price**: 100.
- **TP Levels**: TP1: 96, TP2: 92, TP3: 88.
- **SL Level**: 104.
- **Strategy**: Manage the position similarly, scaling out at TP levels.
---
### 💡 **Tips and Suggestions**
1. **Timeframe**: The indicator works across timeframes (1H, 4H, daily). Short-term traders can use 1H-4H, while long-term traders may prefer daily charts.
2. **Combine with Other Indicators**: Use RSI, MACD, or support/resistance levels to confirm signals.
3. **Backtesting**: Test the strategy on historical data to evaluate performance.
4. **Customization**: Adjust ATR multipliers or EMA periods to suit your market or strategy.
5. **Discipline**: Stick to signals and avoid emotional decisions.
---
### 🎨 **Visual Features**
- **Colored Lines and Labels**: Entry, TP, and SL levels are displayed with colored lines (yellow, green, teal, blue, red) for clarity.
- **Table**: The top-right table summarizes all key information (signal, levels, trend, volatility).
- **Bar Coloring**: Green bars for bullish trends and red bars for bearish trends make trend direction easy to spot.
- **Emojis**: Position status is enhanced with emojis like ⏳ (in progress), ✅ (successful), and ❌ (failed) for visual appeal.
---
### ⚠️ **Warnings and Limitations**
- **Market Conditions**: The indicator performs best in trending markets; it may produce false signals in ranging markets.
- **Risk Management**: Always use proper risk/reward ratios and risk only a small portion of your capital.
- **Lag**: EMAs are lagging indicators, so signals may be delayed in fast-moving markets.
- **Customization Needs**: Default settings may not suit all markets; test and optimize as needed.
---
### 🌟 **Conclusion**
TrendGradient is a user-friendly, visually appealing indicator for trend tracking and automated level calculation. It generates signals via EMA crossovers, calculates dynamic TP/SL levels with ATR, and presents all information clearly through tables, lines, and labels. By using this tool with discipline, you can make more informed and successful trading decisions! 🚀
If you have further questions or need help customizing the indicator, feel free to ask! 💬 Good luck and happy trading! 🍀

EMA ZONE MASTER [By TraderMan]🟢 EMA Zone Master Indicator Explanation 🚀
🌟 What is the EMA Zone Master?
The EMA Zone Master is a powerful TradingView Pine Script indicator designed to help traders identify trends, entry points, and manage trades with precision. It leverages a 200-period EMA (Exponential Moving Average) to create a dynamic zone for spotting bullish 📈 and bearish 📉 trends. The indicator provides clear buy/sell signals, take-profit (TP) levels, and stop-loss (SL) levels, making it ideal for both novice and experienced traders! 💪
🔍 How Does It Work?
The indicator uses the 200-period EMA as its core, surrounded by a zone defined by a percentage offset (default 0.3%). Here's how it operates:
Trend Detection 🧠:
The price's position relative to the EMA zone determines the trend:
Above the zone (with tolerance and minimum distance) signals a bullish trend (BUY 📈).
Below the zone signals a bearish trend (SELL 📉).
A neutral trend occurs when the price is within the zone or lacks momentum.
A trend is confirmed after a set number of bars (default 3) to filter out noise. 🔎
Trade Signals 🚦:
Buy Signal: Triggered when the price breaks above the EMA zone with confirmation.
Sell Signal: Triggered when the price breaks below the EMA zone with confirmation.
Signals are visualized with labels ("BUY" or "SELL") on the chart for clarity. ✅
Position Management 🎯:
Entry Price: Set at the closing price when a signal is triggered.
Take-Profit Levels: Three TP levels (TP1, TP2, TP3) are calculated based on a Risk/Reward Ratio (default 0.7).
Stop-Loss: Calculated using the ATR (Average True Range) with a multiplier (default 6.0) for volatility-based protection. 🛡️
Lines and labels for entry, TP, and SL are drawn on the chart for easy tracking.
Trend Strength 💪:
The indicator calculates trend strength (0-100%) and categorizes it as Very Strong, Strong, Moderate, Weak, or Very Weak. This helps gauge the reliability of the trend. 🌡
Analysis Comment 📝:
A dynamic comment provides professional insights based on trend strength, guiding traders on whether to act or wait. 🧑💼
Visuals & Alerts 🔔:
The EMA, zone boundaries, and candlestick colors change based on the trend (green for bullish, red for bearish, gray for neutral).
A table in the top-right corner summarizes key data: trend direction, strength, entry price, TP/SL levels, and success rate.
Alerts are generated with detailed trade information when a new signal appears.
🛠 How to Use It?
Setup on TradingView ⚙️:
Add the EMA Zone Master to your chart via the TradingView Pine Script editor.
Customize settings like EMA Length (default 200), Zone Width (0.3%), ATR Period (50), and Risk/Reward Ratio (0.7) to suit your trading style. 🛠
Interpreting Signals 📊:
Buy Signal (AL): Look for a "BUY" label and green candlesticks when the price breaks above the EMA zone. 📈
Sell Signal (SAT): Look for a "SELL" label and red candlesticks when the price breaks below the EMA zone. 📉
Check the table for trend strength and analysis comments to confirm the signal's reliability.
Opening a Position 💸:
Long Position: Enter a buy trade when a "BUY" signal appears. Set your take-profit at TP1, TP2, or TP3 and stop-loss at the SL level shown on the chart.
Short Position: Enter a sell trade when a "SELL" signal appears. Use the TP and SL levels provided.
The indicator automatically plots these levels as lines and labels for easy reference. 🎯
Managing Trades 🕒:
Monitor the trade's progress via the table and labels.
The indicator tracks if TP1, TP2, or TP3 is hit or if the trade stops out, updating the Last Result in the table (e.g., "✅ TP1 SUCCESS" or "❌ STOPPED OUT").
Use the Success Rate (displayed in the table) to gauge historical performance (75% for BUY, 65% for SELL, 50% for NEUTRAL).
Using Alerts 🔔:
Set up alerts in TradingView to receive notifications when a buy or sell signal is triggered.
The alert message includes the trend, strength, entry price, TP/SL levels, success rate, and analysis comment for quick decision-making.
📈 How to Open a Position?
Wait for a Signal: Ensure a "BUY" or "SELL" label appears, and the trend strength is at least Moderate (40%+) for higher confidence. ✅
Check the Table: Review the trend direction, strength, and analysis comment to confirm the trade setup. 📊
Enter the Trade:
For a Buy: Enter at the entry price shown, set TP1/TP2/TP3 and SL as indicated by the lines/labels.
For a Sell: Same process, but for a short position.
Monitor: Watch for TP or SL hits. The indicator will update the table with the result (e.g., "✅ TP3 SUCCESS"). 🕒
Risk Management: Always adhere to the stop-loss level to limit losses, and consider partial profit-taking at TP1 or TP2 for safer trading. 🛡️
🎉 Why Use EMA Zone Master?
Clear Signals: Easy-to-read buy/sell signals with visual cues. 🚦
Automated Levels: Pre-calculated TP and SL levels save time and reduce errors. 🧮
Trend Strength Insight: Helps avoid weak trends and focus on high-probability setups. 💪
Professional Analysis: Dynamic comments guide your trading decisions. 🧑💼
Customizable: Adjust settings to match your trading style or market conditions. ⚙️
Alert System: Stay informed with detailed alerts for timely action. 🔔
⚠️ Tips for Success
Confirm with Other Tools: Use additional indicators (e.g., RSI, MACD) to validate signals. 🔍
Test First: Backtest the indicator on your preferred market/timeframe to understand its performance. 📉
Risk Management: Always use proper position sizing and respect stop-loss levels. 🛑
Higher Timeframes: The indicator works best on higher timeframes (e.g.,15MİN, 1H, 4H, Daily) for stronger signals. ⏰
Happy trading with EMA Zone Master! 🚀 Let it guide you to smarter, more confident trades. 💰 Feel free to tweak settings and share your results! 😊

TrendSync TP Engine [By TraderMan]📘 TrendSync TP Engine – Overview & User Guide
TrendSync TP Engine is a trend-following indicator that automatically detects trend direction based on how long the price stays above or below a defined EMA (Exponential Moving Average). Once a trend is confirmed, it plots entry, take-profit (TP), and stop-loss (SL) levels directly on the chart.
Its purpose is to offer a clear roadmap for manual traders and act as a “TP engine” in trend-based trading.
🔧 How It Works
Trend Detection:
If the price closes consistently above or below the EMA for a minimum number of bars, a LONG or SHORT trend is triggered.
EMA-Based Trade Plan:
When a new trend is detected, the script automatically plots:
Entry level
TP1, TP2, TP3
SL level
based on dynamic ATR offsets.
TP / SL Labels:
As the price hits TP or SL targets, real-time labels appear on the chart showing trade progress.
Built-in Alert System:
Alerts are triggered when:
A new position opens
TP1, TP2, TP3 levels are reached
Stop loss is hit
🚀 How to Use
Add to Chart:
Apply the indicator to your chart on any timeframe (1H, 4H, 1D, etc.).
Configure Settings:
Adjust parameters like:
EMA length
Minimum trend duration
TP/SL distances (in ATR multiples)
to fit your strategy.
Follow the Plan:
Once a trend begins, you'll see:
Blue line for entry
Green dashed lines for TP1/TP2/TP3
Red dashed line for SL
Let the engine guide your trades.
🎯 Who Is It For?
Trend-following traders
Manual traders who want structured trade plans
Users who prefer automated visual signals & alerts
Developers looking to build strategy logic on top
✅ Key Features
Automatic levels: Entry, TP1-3, SL lines
Alert-ready: Real-time push/email/webhook notifications
Clear visuals: All levels labeled with real-time status
Flexible & modular: Can be extended into a full strategy
Disclaimer: This tool is for educational and informational purposes only. It does not constitute financial advice. Use at your own discretion with proper risk management.

Smart Trend Signals [QuantAlgo]🟢 Overview
The Smart Trend Signals indicator is created to address a fundamental challenge in technical analysis: generating timely trend signals while adapting to varying market volatility conditions. The indicator distinguishes itself by employing volatility-adjusted calculations that automatically modify signal sensitivity based on current market conditions, rather than using fixed parameters that perform inconsistently across different market environments. By processing Long and Short signals through separate dynamic calculation engines, each optimized for its respective directional bias, the indicator reduces the common issue of delayed or conflicting signals that plague many traditional trend-following tools. Additionally, the integration of linear regression-based trend confirmation adds another layer of signal validation, helping to filter market noise while maintaining responsiveness to genuine price movements. This adaptive approach makes the indicator practical for both traders and investors across different asset classes and timeframes, from short-term forex/crypto scalping to long-term equity position analysis.
🟢 How It Works
The indicator uses a straightforward calculation process that combines volatility measurement with momentum detection to generate directional signals. The system first calculates Average True Range (ATR) over a user-defined period to measure current market volatility. This ATR value is then multiplied by the Smart Trend Multiplier setting to create dynamic reference levels that expand during volatile periods and contract during calmer market conditions.
For signal generation, the indicator maintains separate calculation paths for Long/Buy and Short/Sell opportunities. Long signals are generated when price moves above a dynamically calculated level below the current price, confirmed by an exponential moving average crossover in the same direction. Short signals work in reverse, triggering when price moves below a calculated level above the current price, also requiring EMA confirmation. This dual-path approach allows each signal type to operate with parameters suited to its directional bias.
🟢 How to Use
Long Signals (Green Labels): Appear as "Long" labels below price bars when the indicator detects upward price momentum above the calculated reference level, confirmed by EMA crossover. These signals identify moments when price action demonstrates bullish characteristics based on the volatility-adjusted calculations.
Short Signals (Red Labels): Display as "Short" labels above price bars when downward price momentum below the reference level is detected and confirmed by EMA crossover. These signals highlight instances where price action exhibits bearish characteristics according to the indicator's mathematical framework.
Customizable Bar Coloring: This feature colors individual price bars to match the current signal direction. When enabled, each bar reflects the indicator's current directional bias, creating a continuous visual representation of trend periods across the chart timeline.
Built-in Alert System: Provides automatic notifications for new signals with detailed exchange and ticker information. The alert system monitors the indicator's calculations continuously and triggers notifications when new long or short signals are generated, allowing traders/investors to track multiple instruments simultaneously.
🟢 Pro Tips for Trading and Investing
→ Parameter Adjustment: Higher Smart Trend Multiplier settings generate fewer signals that may be more selective, while lower settings produce more frequent signals that may include more false positives. Test different settings to find what works for your trading style and market conditions.
→ Timeframe Analysis: Using higher timeframes for general trend direction and lower timeframes for entry timing is a common approach.
→ Risk Management: No indicator eliminates the need for proper risk management. Use appropriate position sizing and stop-loss strategies regardless of signal quality or frequency.
→ Market Conditions: The indicator may perform differently in trending versus ranging markets. Frequent signal changes might indicate choppy conditions. Backtest and paper trade before risking real capital.

Mean Reversion & Momentum Hybrid | D_QUANT 📌 Mean Reversion & Momentum Hybrid | D_QUANT
📖 Description:
This indicator combines mean reversion logic, volatility filtering, and percentile-based momentum to deliver clear, context-aware buy/sell signals designed for trend-following and contrarian setups.
At its core, it merges:
A Bollinger Band % Positioning Model (BB%)
A 75th/25th Percentile Momentum System
A Volatility-Adjusted Trend Filter using RMA + ATR
All tied together with a dynamic gradient-style oscillator that visualizes signal strength and persistence over time — making it easy to track high-conviction setups.
Signals only trigger when all three core components align, filtering out noise and emphasizing high-probability turning points or trend continuations.
⚙️ Methodology Overview:
Bollinger Bands % (BB%):
Price is measured as a percentage between upper and lower Bollinger Bands (based on OHLC4). Entries are only considered when price exceeds custom BB% thresholds — emphasizing market extremes.
Volatility-Based Trend Filter (RMA + ATR):
A smoothed RMA baseline is paired with ATR to define trend bias. This ensures signals only occur when price deviates meaningfully beyond recent volatility.
Percentile Momentum Model (75th/25th Rank):
Price is compared against its rolling 75th and 25th percentile. If price breaks these statistical boundaries (adjusted by ATR), it triggers a directional momentum condition.
Signal Consensus Engine:
All three layers must agree — BB% condition, trend filter, and percentile momentum — before a buy or sell signal is plotted.
Gradient Oscillator Visualization:
Signals appear as a fading oscillator line with a gradient-filled area beneath it. The color intensity represents how “fresh” or “strong” the signal is, fading over time if not reconfirmed, offering both clarity and signal aging at a glance.
🔧 User Inputs:
🧠 Core Settings:
Source: Select the price input (default: close)
Bollinger Bands Length: Period for BB basis and deviation
Bollinger Bands Multiplier: Width of the bands
Minimum BB Width (% of Price): Prevents signals during low-volatility chop
📊 BB% Thresholds:
BB% Long Threshold (L): Minimum %B to consider a long
BB% Short Threshold (S): Maximum %B to consider a short
🔍 Trend Filter Parameters:
RMA Length: Period for the smoothed trend baseline
ATR Length: Lookback for ATR in trend deviation filter
⚡️ Momentum Parameters:
Momentum Length: Period for percentile momentum calculation
Mult_75 / Mult_25: ATR-adjusted thresholds for breakout above/below percentile levels
🎨 Visualization:
Bar Coloring: Highlights candles during active signals
Background Coloring: Optional background shading for signals
Show Oscillator Plot: Toggle the gradient-style oscillator
🧪 Use Case:
This indicator works well across all assets for trend identification. It is particularly effective when used on higher timeframes (e.g. 12H, 1D,2D) to capture mean reversion bounces or confirm breakouts backed by percentile momentum and volatility expansion.
⚠️ Notes:
This is not financial advice. Use in combination with proper risk management and confluence from other tools.

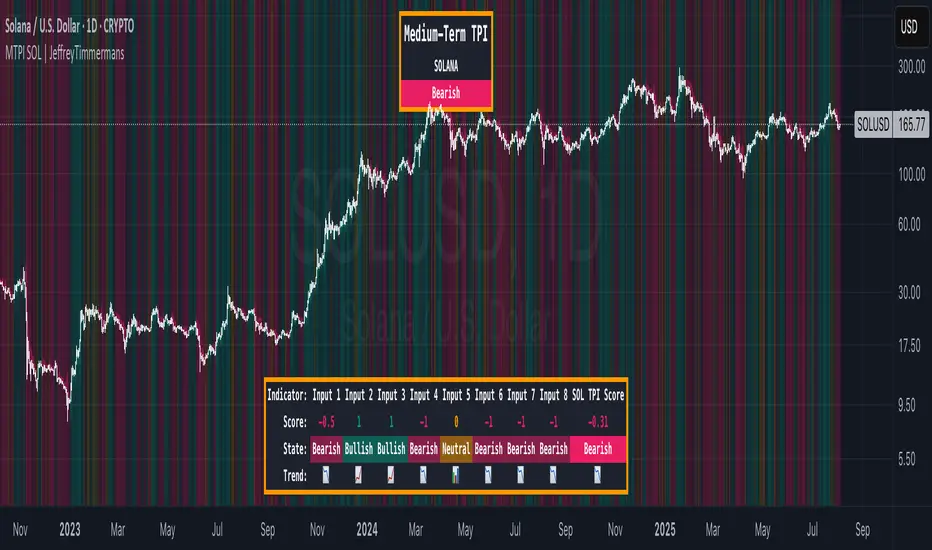
MTPI SUI | JeffreyTimmermansMedium-Term Trend Probability Indicator
The "Medium-Term Trend Probability Indicator" on SUI is a custom-designed tool created to analyze SUI from a medium-term perspective. While short-term indicators often respond to quick fluctuations and long-term models focus on broader macro cycles, the MTPI sits perfectly in between—detecting trend shifts over multiple weeks and helping traders and analysts stay ahead of the curve.
This specific version of the MTPI is applied to SUI, making it a dedicated trend-following tool for this unique digital asset, tuned to reflect its own volatility and structural behavior.
Key Features
Medium-Term Focus:
The MTPI is optimized for trend tracking over medium horizons—typically weeks to a few months. It filters out noise while remaining responsive to meaningful directional changes.
6 Input Signals:
The model combines 6 carefully selected input trend-following indicators, each targeting different dimensions of trend strength and continuation.
Market Regimes:
The MTPI classifies market conditions into:
Bullish → Strong upward momentum and trend confirmation
Bearish → Sustained downward pressure and breakdown signals
Neutral → Mixed signals or transition phases, often seen in consolidations or early reversals
Visual Background:
The chart background shifts based on the active regime. This provides instant visual clarity on whether the asset is trending, reversing, or consolidating.
Indicator Dashboard:
At the bottom of the chart, the MTPI includes a live dashboard showing:
The state of all 6 inputs (Bullish, Bearish, Neutral)
The composite MTPI Score
The resulting Market Trend classification
How It Works
Input Signal Logic:
Each input returns one of three possible scores:
+1 = Bullish
-1 = Bearish
0 = Neutral
Score Aggregation:
The MTPI Score is calculated as the average of all 6 input values:
Score > +0.1 → Bullish regime
Score < -0.1 → Bearish regime
Between -0.1 and +0.1 → Neutral regime
Background Coloring:
The background changes automatically to match the current trend regime, making it visually easy to interpret the dominant market environment.
Use Cases
Mid-Term Strategy Alignment:
Use the MTPI to align with the dominant medium-term market direction on SUI.
Rotation & Momentum Detection:
Catch early signs of reversals, breakout expansions, or trend exhaustion.
Multi-Timeframe Integration:
Combine MTPI with short-term tools (STPI) or long-term indicators (LTPI) for a complete market overview.
Dynamic Alerts:
Bullish Alert: MTPI Score crosses above +0.1
Bearish Alert: MTPI Score crosses below -0.1
Neutral Zone: MTPI Score enters between -0.1 and +0.1
Conclusion
The MTPI – SUI is a reliable medium-term probability model that simplifies complex market structure into an actionable, color-coded signal system. By distilling 6 intelligent inputs into one combined trend score, it offers clear directional bias and regime classification—crucial for positioning in a volatile asset like SUI. Whether used standalone or as part of a broader trend framework, this indicator enhances clarity, discipline, and precision in your medium-term trading decisions.

MTPI OTHERS.D | JeffreyTimmermansMedium-Term Trend Probability Indicator
The "Medium-Term Trend Probability Indicator" on OTHERS.D is a custom-built model designed to measure the medium-term trend strength of the entire crypto market excluding the Top 10 assets. By focusing on the performance of smaller-cap and emerging cryptocurrencies, this indicator offers a refined view of risk appetite and capital rotation beyond the major players like BTC, ETH, and other top coins.
OTHERS.D (Total Crypto Market Cap Dominance excluding the Top 10) serves as a proxy for altcoin speculation cycles, market breadth, and rotational momentum. The MTPI leverages this by applying 8 carefully selected trend-following indicators to generate a composite probability score that reflects the directional bias of the broader altcoin market.
Key Features
Mid-Term Trend Orientation:
The MTPI focuses on multi-week to multi-month trend phases, filtering out short-term volatility while responding faster than long-term macro models.
8 Input Signals:
Built using 8 trend-following indicators, each measuring trend strength, direction, and persistence within the "OTHERS" segment.
Market Regime Detection:
The MTPI identifies three distinct market states:
Bullish → Clear upward trend in the altcoin market (excluding top 10)
Bearish → Persistent downward movement or weakness in the broader altcoin segment
Neutral → Choppy or indecisive behavior
Background Coloring:
The background dynamically adapts based on the current regime, making it easy to visually identify dominant conditions.
Trend Dashboard:
A dashboard displays:
The current state of all 8 trend signals
The overall MTPI score
The interpreted market regime
How It Works
Trend Signal Evaluation:
Each of the 8 inputs outputs a discrete signal:
+1 → Bullish
-1 → Bearish
0 → Neutral
Composite Score Calculation:
The MTPI score is computed as the average of the 8 inputs:
Score > +0.1 → Bullish regime
Score < -0.1 → Bearish regime
Between -0.1 and +0.1 → Neutral regime
This produces a normalized score from -1 to +1, helping quantify trend confidence and detect early shifts in momentum.
Color-Coded Background:
The score automatically drives the background color:
Green tones for bullish phases
Red tones for bearish phases
Gray/orange tones for sideways conditions
Use Cases
Altcoin Rotation Tracking:
Use MTPI – OTHERS.D to monitor when capital is rotating into or out of smaller-cap cryptocurrencies — a key signal for risk-on or risk-off sentiment.
Medium-Term Positioning:
Perfect for swing traders or trend followers looking to align positions with the dominant trend in the non-top-10 market segment.
Multi-Timeframe Confirmation:
Combine MTPI with other tools like STPI (Short-Term) or LTPI (Long-Term) for enhanced decision-making and better timing across timeframes.
Dynamic Alerts:
Bullish Entry: MTPI score crosses above +0.1
Bearish Entry: MTPI score crosses below -0.1
Neutral Zone: MTPI score moves between -0.1 and +0.1
These alerts help you react quickly to regime shifts in the altcoin market outside the top 10.
Conclusion
The MTPI – OTHERS.D is a focused, probability-based trend tool built for analyzing the non-top-10 segment of the crypto market. By merging 8 independent trend signals into a single composite score and regime model, it provides a clear lens into where capital is flowing and how smaller-cap crypto assets are behaving. An essential tool for anyone active in altcoin trading, rotational strategies, or full-spectrum crypto market analysis.

MTPI SOL | JeffreyTimmermansMedium-Term Trend Probability Indicator
The "Medium-Term Trend Probability Indicator" on SOL (Solana) is a custom-built tool designed to analyze Solana (SOL) from a medium-term perspective. Unlike short-term indicators that react quickly to intraday volatility or long-term models that focus on macro cycles, the MTPI is optimized to detect medium-term market trends—capturing key turning points and momentum shifts that unfold over multiple weeks.
This version of the MTPI is applied to SOL, making it a Solana-specific trend-following tool with particular sensitivity to its price behavior and structural dynamics.
Key Features
Medium-Term Focus:
Built to monitor price action over several weeks to months, the MTPI filters out short-term noise while remaining responsive to meaningful trend changes.
8 Input Signals:
The MTPI aggregates 8 carefully selected trend-following inputs, each tuned to reflect mid-cycle behavior in SOL’s price movements.
Market Regimes:
The MTPI classifies market behavior into one of three clear regimes:
Bullish → Momentum and structure align to support a continued uptrend
Bearish → Majority of signals point to trend deterioration or downside momentum
Neutral → Mixed signals, often during consolidation or early transition phases
Visual Background:
The background color shifts dynamically to reflect the active regime—making it easy to visually interpret the prevailing market condition.
Comprehensive Dashboard:
The lower panel displays:
The state of each individual input (Bullish, Bearish, Neutral)
The numerical MTPI Score (average of all 8 signals)
The final Trend Classification (Bullish / Bearish / Neutral)
How It Works
Input Analysis:
Each of the 8 inputs outputs a score based on its internal signal:
+1 = Bullish condition
-1 = Bearish condition
0 = Neutral / indecisive
Score Calculation:
The MTPI Score is calculated as the average of all 8 input signals:
Score > +0.1 = Bullish regime
Score < -0.1 = Bearish regime
Score between -0.1 and +0.1 = Neutral regime
Background Coloring:
Color-coded backgrounds instantly reflect the current trend classification based on the MTPI Score, helping traders stay aligned with the market direction at all times.
Use Cases
Mid-Term Positioning:
Identify strong trend phases on SOL with reduced noise and increased directional clarity.
Confirmation Layer:
Use MTPI as a mid-term confirmation tool alongside short-term setups or long-term macro models (like LTPI).
Rotation or Transition Detection:
Spot key moments when SOL transitions from expansion to contraction phases (and vice versa).
Dynamic Alerts:
Bullish Signal: MTPI Score crosses above +0.1
Bearish Signal: MTPI Score crosses below -0.1
Neutral Zone: MTPI Score enters between -0.1 and +0.1
Conclusion
The Medium-Term Trend Probability Indicator (MTPI – SOL) provides a powerful framework for identifying trend phases on Solana with mid-term relevance. By combining 8 intelligent inputs into a single score and market classification, it offers clarity in times of uncertainty and confidence in times of momentum. Whether used alone or as part of a broader multi-timeframe strategy, the MTPI helps refine entries, exits, and macro alignment in the dynamic world of Solana trading.
Hann Window FIR Filter Ribbon [BigBeluga]🔵 OVERVIEW
The Hann Window FIR Filter Ribbon is a trend-following visualization tool based on a family of FIR filters using the Hann window function. It plots a smooth and dynamic ribbon formed by six Hann filters of progressively increasing length. Gradient coloring and filled bands reveal trend direction and compression/expansion behavior. When short-term trend shifts occur (via filter crossover), it automatically anchors visual support/resistance zones at the nearest swing highs or lows.
🔵 CONCEPTS
Hann FIR Filter: A finite impulse response filter that uses a Hann (cosine-based) window for weighting past price values, resulting in a non-lag, ultra-smooth output.
hannFilter(length)=>
var float hann = na // Final filter output
float filt = 0
float coef = 0
for i = 1 to length
weight = 1 - math.cos(2 * math.pi * i / (length + 1))
filt += price * weight
coef += weight
hann := coef != 0 ? filt / coef : na
Ribbon Stack: The indicator plots 6 Hann FIR filters with increasing lengths, creating a smooth "ribbon" that adapts to price shifts and visually encodes volatility.
Gradient Coloring: Line colors and fill opacity between layers are dynamically adjusted based on the distance between the filters, showing momentum expansion or contraction.
Dynamic Swing Zones: When the shortest filter crosses its nearest neighbor, a swing high/low is located, and a triangle-style level is anchored and projected to the right.
Self-Extending Levels: These dynamic levels persist and extend until invalidated or replaced by a new opposite trend break.
🔵 FEATURES
Plots 6 Hann FIR filters with increasing lengths (controlled by Ribbon Size input).
Automatically colors each filter and the fill between them with smooth gradient transitions.
Detects trend shifts via filter crossover and anchors visual resistance (red) or support (green) zones.
Support/resistance zones are triangle-style bands built around recent swing highs/lows.
Levels auto-extend right and adapt in real time until invalidated by price action.
Ribbon responds smoothly to price and shows contraction or expansion behavior clearly.
No lag in crossover detection thanks to FIR architecture.
Adjustable sensitivity via Length and Ribbon Size inputs.
🔵 HOW TO USE
Use the ribbon gradient as a visual trend strength and smooth direction cue.
Watch for crossover of shortest filters as early trend change signals.
Monitor support/resistance zones as potential high-probability reaction points.
Combine with other tools like momentum or volume to confirm trend breaks.
Adjust ribbon thickness and length to suit your trading timeframe and volatility preference.
🔵 CONCLUSION
Hann Window FIR Filter Ribbon blends digital signal processing with trading logic to deliver a visually refined, non-lagging trend tool. The adaptive ribbon offers insight into momentum compression and release, while swing-based levels give structure to potential reversals. Ideal for traders who seek smooth trend detection with intelligent, auto-adaptive zone plotting.

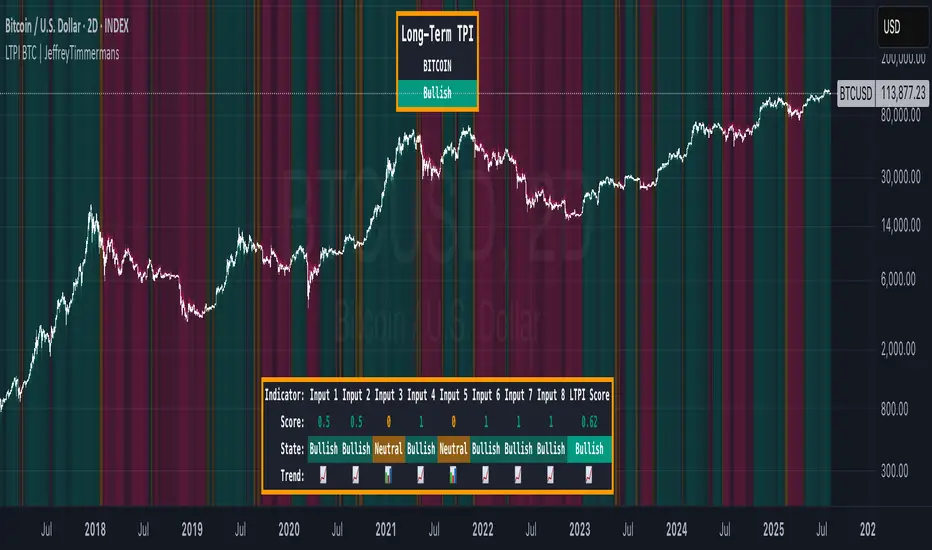
LTPI BTC | JeffreyTimmermansLong-Term Trend Probability Indicator
The "Long-Term Trend Probability Indicator" on BTC is a custom-built tool designed to analyze BTC from a long-term perspective. Unlike short-term indicators that react to price volatility, LTPI focuses on major trend shifts on BTC, and therefore across the entire crypto market, helping to identify major trend shifts early.
This version of the LTPI is applied to BTC, making it a BTC specific trend following tool, but very broad (crypto wise), because BTC is the biggest asset.
Key Features
Long-Term Focus:
Designed for macro market analysis with less sensitivity to short-term noise.
8 Input Signals:
Combines 8 carefully selected inputs (trend following indicators) into a single score that reflects the overall market condition.
Market Regimes:
Classifies the BTC trend into:
Bullish: Strong uptrend, expansion phase
Bearish: Strong downtrend, contraction phase
Neutral: Transitional or uncertain
Visual Background:
Background colors clearly display which regime is active.
Comprehensive Dashboard:
The panel at the bottom shows each input’s state, the composite LTPI score, and the resulting market trend.
How It Works
Inputs Analysis:
Each of the 8 inputs outputs one of three states:
+1 (Bullish)
-1 (Bearish)
0 (Neutral)
Score Calculation:
The total score is the sum of all 8 input signals divided by 8.
Score > 0.1 = Bullish
Score < -0.1 = Bearish
Between -0.1 and 0.1 = Neutral
Background Coloring:
Background colors dynamically adjust to reflect the long-term market regime.
Use Cases
Long-Term Positioning:
Identify periods of global expansion or contraction to position yourself accordingly.
Macro Confirmation:
Use LTPI in combination with medium-term (MTPI) and short-term tools for multi-timeframe confirmation.
Market Timing:
Alerts when LTPI crosses key thresholds help highlight the start of major bullish or bearish phases.
Dynamic Alerts:
Bullish Entry: LTPI score crosses above 0.1
Bearish Entry: LTPI score crosses below -0.1
Neutral Zone: Score moves back between -0.1 and 0.1
Conclusion
The Long-Term Trend Probability Indicator (LTPI – BTC) is a powerful tool for identifying long-term market phases across the entire crypto ecosystem. By focusing on long term trends and combining 8 inputs into a single probability score, it provides a clear macro trend perspective for strategic decision-making.
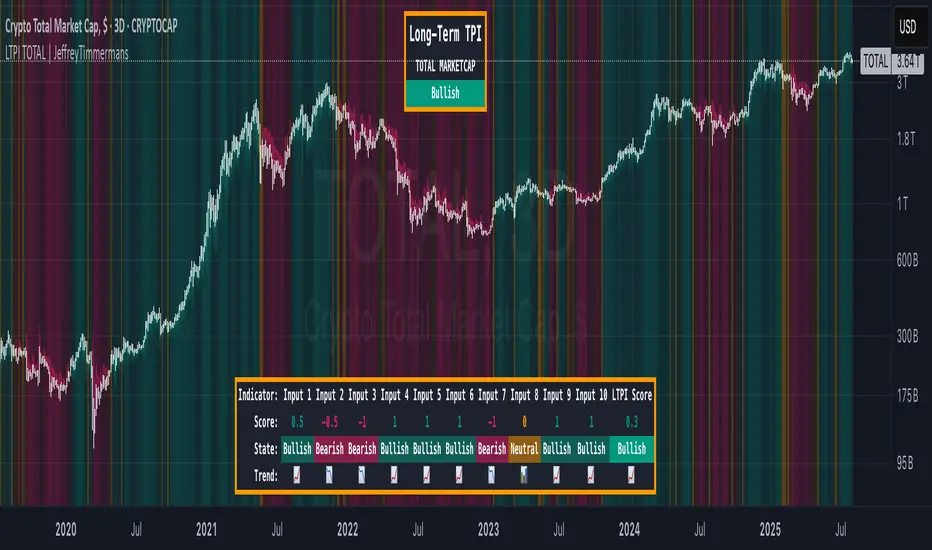
LTPI TOTAL | JeffreyTimmermansLong-Term Trend Probability Indicator
The "Long-Term Trend Probability Indicator" on TOTAL is a custom-built tool designed to analyze the global crypto market (TOTAL) from a long-term perspective. Unlike short-term indicators that react to price volatility, LTPI focuses on major trend shifts across the entire crypto market, helping to identify major trend shifts early.
This version of the LTPI is applied to the TOTAL market cap, making it a broad trend following tool.
Key Features
Long-Term Focus:
Designed for macro market analysis with less sensitivity to short-term noise.
10 Input Signals:
Combines 10 carefully selected inputs (trend following indicators) into a single score that reflects the overall market condition.
Market Regimes:
Classifies the TOTAL market into:
Bullish: Strong uptrend, expansion phase
Bearish: Strong downtrend, contraction phase
Neutral: Transitional or uncertain
Visual Background:
Background colors clearly display which regime is active.
Comprehensive Dashboard:
The panel at the bottom shows each input’s state, the composite LTPI score, and the resulting market trend.
How It Works
Inputs Analysis:
Each of the 10 inputs outputs one of three states:
+1 (Bullish)
-1 (Bearish)
0 (Neutral)
Score Calculation:
The total score is the sum of all 10 input signals divided by 10.
Score > 0.1 = Bullish
Score < -0.1 = Bearish
Between -0.1 and 0.1 = Neutral
Background Coloring:
Background colors dynamically adjust to reflect the long-term market regime.
Use Cases
Long-Term Positioning:
Identify periods of global expansion or contraction to position yourself accordingly.
Macro Confirmation:
Use LTPI in combination with medium-term (MTPI) and short-term tools for multi-timeframe confirmation.
Market Timing:
Alerts when LTPI crosses key thresholds help highlight the start of major bullish or bearish phases.
Dynamic Alerts:
Bullish Entry: LTPI score crosses above 0.1
Bearish Entry: LTPI score crosses below -0.1
Neutral Zone: Score moves back between -0.1 and 0.1
Conclusion
The Long-Term Trend Probability Indicator (LTPI – TOTAL) is a powerful tool for identifying long-term market phases across the entire crypto ecosystem. By focusing on long term trends and combining 10 inputs into a single probability score, it provides a clear macro perspective for strategic decision-making.
Trend Strength Index [Alpha Extract]The Trend Strength Index leverages Volume Weighted Moving Average (VWMA) and Average True Range (ATR) to quantify trend intensity in cryptocurrency markets, particularly Bitcoin. The combination of VWMA and ATR is particularly powerful because VWMA provides a more accurate representation of the market's true average price by weighting periods of higher trading volume more heavily—capturing genuine momentum driven by increased participation rather than treating all price action equally, which is crucial in volatile assets like Bitcoin where volume spikes often signal institutional interest or market shifts.
Meanwhile, ATR normalizes this measurement for volatility, ensuring that trend strength readings remain comparable across different market conditions; without ATR's adjustment, raw price deviations from the mean could appear artificially inflated during high-volatility periods (like during news events or liquidations) or understated in low-volatility sideways markets, leading to misleading signals. Together, they create a volatility-adjusted, volume-sensitive metric that reliably distinguishes between meaningful trend developments and noise.
This indicator measures the normalized distance between price and its volume-weighted mean, providing a clear visualization of trend strength while accounting for market volatility. It helps traders identify periods of strong directional movement versus consolidation, with color-coded gradients for intuitive interpretation.
🔶 CALCULATION
The indicator processes price data through these analytical stages:
Volume Weighted Moving Average: Computes a smoothed average weighted by trading volume
Volatility Normalization: Uses ATR to account for market volatility
Distance Measurement: Calculates absolute deviation between current price and VWMA
Strength Normalization: Divides price deviation by ATR for a volatility-adjusted metric
Formula:
VWMA = Volume-Weighted Moving Average of Close over specified length
ATR = Average True Range over specified length
Price Distance = |Close - VWMA|
Trend Strength = Price Distance / ATR
🔶 DETAILS Visual Features:
VWMA Line: Blue line overlay on the price chart representing the volume-weighted mean
Trend Strength Area: Histogram-style area plot with dynamic color gradient (red for weak trends, transitioning through orange and yellow to green for strong trends)
Threshold Line: Horizontal red line at the customizable Trend Enter level
Background Highlight: Subtle green background when trend strength exceeds the enter threshold for strong trend visualization
Alert System: Triggers notifications for strong trend detection
Interpretation:
0-Weak (Red): Minimal trend strength, potential consolidation or ranging market
Mid-Range (Orange/Yellow): Building momentum, watch for breakout potential
At/Above Enter Threshold (Green): Strong trend conditions, potential for continued directional moves
Threshold Crossing: Trend strength crossing above the enter level signals increasing conviction in the current direction
Color Transitions: Gradual shifts from warm (red/orange) to cool (green) tones indicate strengthening trends
🔶 EXAMPLES
Strong Trend Entry: When trend strength crosses above the enter threshold (e.g., 1.2), it identifies the onset of a powerful move where price deviates significantly from the mean.
Example: During a rally, trend strength rising from yellow (around 1.0) to green (1.2+) often precedes sustained upward momentum, providing entry opportunities for trend followers.
Consolidation Detection: Low trend strength values in red shades (below 0.5) highlight periods of low volatility and mean reversion potential.
Example: After a sharp sell-off, persistent red values signal a likely sideways phase, allowing traders to avoid whipsaws and wait for orange/yellow transitions as a precursor to recovery.
Volatility-Adjusted Pullbacks: In volatile markets, the ATR component ensures trend strength remains accurate; a dip back to yellow from green during minor corrections can indicate healthy pullbacks within a strong trend.
Example: Trend strength briefly falling to yellow levels (e.g., 0.8-1.1) after hitting green provides profit-taking signals without invalidating the overall bullish bias if the VWMA holds as support.
Threshold Alert Integration: The alert condition combines strength value with the enter threshold for timely notifications.
Example: Receiving a "Strong Trend Detected" alert when the area plot turns green helps confirm Bitcoin's breakout from consolidation, aligning with increased volume for higher-probability trades.
🔶 SETTINGS
Customization Options:
Lengths: VWMA length (default 14), ATR length (default 14)
Thresholds: Trend enter (default 1.2, step 0.1), trend exit (default 1.15, for potential future signal enhancements)
Visuals: Automatic color scaling with red at 0, transitioning to green at/above enter threshold
Alert Conditions: Strong trend detection (when strength > enter)
The Trend Strength Index equips traders with a robust, easy-to-interpret tool for gauging trend intensity in volatile markets like Bitcoin. By normalizing price deviations against volatility, it delivers reliable signals for identifying high-momentum opportunities while the gradient coloring and alerts facilitate quick assessments in both trending and choppy conditions.

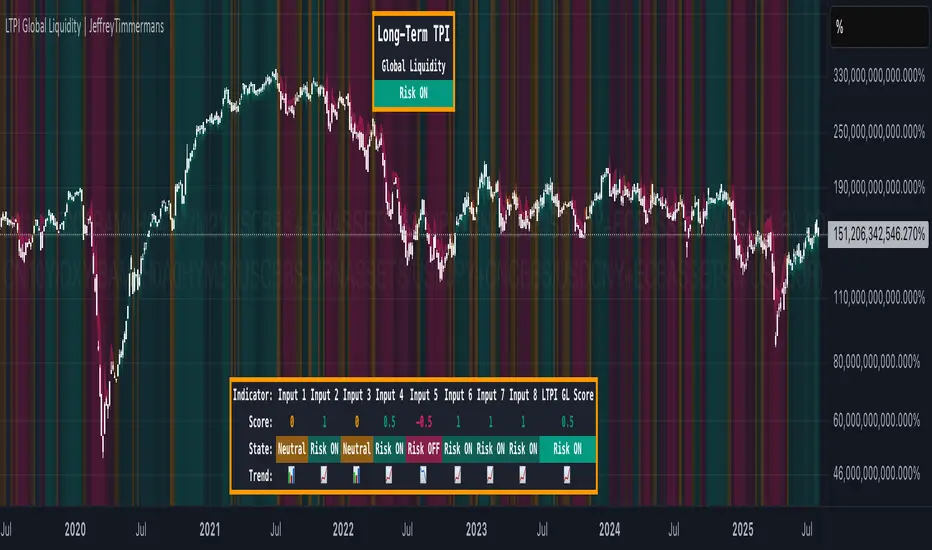
LTPI Global Liquidity | JeffreyTimmermansLong-Term Probability Indicator (LTPI)
The "Long-Term Probability Indicator (LTPI)" on a generic liquidity ticker is a custom-built analytical tool designed to evaluate market conditions over a long-term horizon, with a strong focus on global liquidity trends. By combining six carefully selected input signals into a single probability score, this indicator helps traders and analysts identify prevailing long-term market states: Bullish, Bearish, or Neutral.
Where short-term systems/timeframes react quickly to price fluctuations, LTPI smooths out noise and focuses on the bigger picture, allowing for informed strategic decision-making rather than short-term speculation.
Key Features
Multi-Input Aggregation:
Uses six independent inputs, each based on long-term liquidity and macro-related data, to generate a composite market probability score.
Long-Term Focus:
Prioritizes medium-to-long-term trends, ignoring smaller fluctuations that often mislead traders in volatile markets.
Simplified Market States:
Classifies the global market into three primary states:
Bullish: Favorable liquidity and conditions for long-term risk-taking.
Bearish: Tightening liquidity and conditions that require caution.
Neutral: Transitional phases or uncertain conditions.
Background Coloring:
Visual cues on the chart help identify which regime is active at a glance.
Global Liquidity Perspective:
Designed for use on a generic liquidity ticker, based on M2 money supply, to track macroeconomic liquidity flows and risk appetite.
Dashboard Display:
A compact on-screen table summarizes all six inputs, their states, and the resulting LTPI score.
Dynamic Alerts:
Real-time alerts signal when the LTPI shifts from one regime to another.
Inputs & Settings
LTPI Inputs:
Input Sources (6): Each input is a carefully chosen trend following indicator.
Weighting: Each input contributes equally to the final score.
Score Calculation:
Bullish = +1
Bearish = -1
Neutral = 0
Color Settings:
Strong Bullish: Bright Green
Weak Bullish: Light Green
Neutral: Gray/Orange
Weak Bearish: Light Red
Strong Bearish: Bright Red
(Colors can be customized.)
Calculation Process
Collect Data:
Six long-term inputs are evaluated at each bar.
Scoring:
Each input’s state contributes +1 (bullish), -1 (bearish), or around 0 (neutral).
Aggregate Probability:
The LTPI Score is calculated as the sum of all six scores divided by 6, resulting in a value between -1 and +1.
Market Classification:
Score > 0.1: Bullish regime
Score < -0.1: Bearish regime
-0.1 ≤ Score ≤ 0.1: Neutral
Background Coloring:
Background colors are applied to highlight the current regime.
How to Use LTPI
Strategic Positioning:
Bullish: Favor holding or adding to long-term positions.
Bearish: Reduce risk, protect capital.
Neutral: Wait for confirmation before making significant moves.
Confirmation Tool:
LTPI works best when combined with shorter-term indicators like MTPI or trend-following tools to confirm alignment across multiple timeframes.
Dynamic Alerts:
Bullish Regime Entry: When the LTPI Score crosses above 0.1.
Bearish Regime Entry: When the LTPI Score crosses below -0.1.
Neutral Zone: When the score moves back between -0.1 and 0.1.
These alerts help identify significant macro-driven shifts in market conditions.
Conclusion
The Long-Term Probability Indicator (LTPI) is an advanced, liquidity-focused tool for identifying macro-driven market phases. By consolidating six inputs into a single probability score and presenting the results visually, LTPI helps long-term investors and analysts stay aligned with global liquidity trends and avoid being distracted by short-term volatility.
MTPI TOTAL / BTC | JeffreyTimmermansMedium-Term Probability Indicator (MTPI)
The "Medium-Term Probability Indicator (MTPI)" is a multi-factor model designed to evaluate the medium-term state of a market. By aggregating signals from 20 underlying inputs, it generates a composite score that classifies the market as Bullish, Bearish, or Neutral. This helps traders understand the prevailing market regime and adapt strategies accordingly.
Key Features
Multi-Input Scoring: Combines up to 20 individual inputs (indicators, conditions, or models) into a single probability-based score.
Composite Market State: Translates raw input signals into three states: Bullish, Bearish, or Neutral.
Dynamic Background Coloring: Uses color-coded background shading to visually separate bullish, bearish, and neutral phases.
MTPI Score: Calculates a final numeric score (ranging from -1 to +1) to quantify the market’s directional bias.
Dashboard Display: Shows all input signals, their individual states, and the aggregated MTPI score at a glance.
Medium-Term Focus: Helps identify prevailing conditions that last from several weeks to several months.
Inputs & Settings
MTPI Settings:
Input Signals (1 to 20): Default: Predefined conditions. Each input evaluates the market from a unique perspective (trend, momentum, volatility, etc.).
Composite Score Calculation: Default weighting is equal across all inputs.
Color Settings:
Bullish: Bright green background
Neutral: Gray/orange background
Bearish: Bright red background
These colors can be customized as desired.
Calculation Process
Signal Aggregation:
Each input generates a state:
1 to 0.1 = Bullish
0.1 to -0.1 = Neutral
-0.1 to -1 = Bearish
Scoring:
The MTPI aggregates these values and calculates an average score.
Classification:
Bullish: Score > 0
Bearish: Score < 0
Neutral: Score ≈ 0
Visualization:
Background Coloring: Highlights the dominant phase on the chart.
Dashboard: Displays individual input states, the total MTPI score, and the resulting classification.
How to Use the MTPI
Identifying Market Regimes:
Bullish: Majority of inputs align positively. Favor long positions or trend-following strategies.
Bearish: Majority of inputs align negatively. Favor short positions or defensive strategies.
Neutral: Mixed signals. Caution or range-bound strategies may be preferable.
Transition Detection:
Changes in background color or the MTPI dashboard (score flipping from positive to negative, or vice versa) indicate potential regime shifts.
Dynamic Dashboard:
Score: Displays the net sum of all input signals (normalized).
State: Provides the classification (Bullish, Bearish, Neutral).
Trend: Visual cues for each input showing the current contribution to the MTPI.
Conclusion
The Medium-Term Probability Indicator (MTPI) consolidates multiple signals into a single, intuitive visualization that helps traders quickly assess the medium-term market environment. Its combination of a multi-input dashboard, composite scoring, and background coloring makes it a powerful decision-support tool.
This script is developed by Jeffrey Timmermans and is designed to complement other analysis methods.
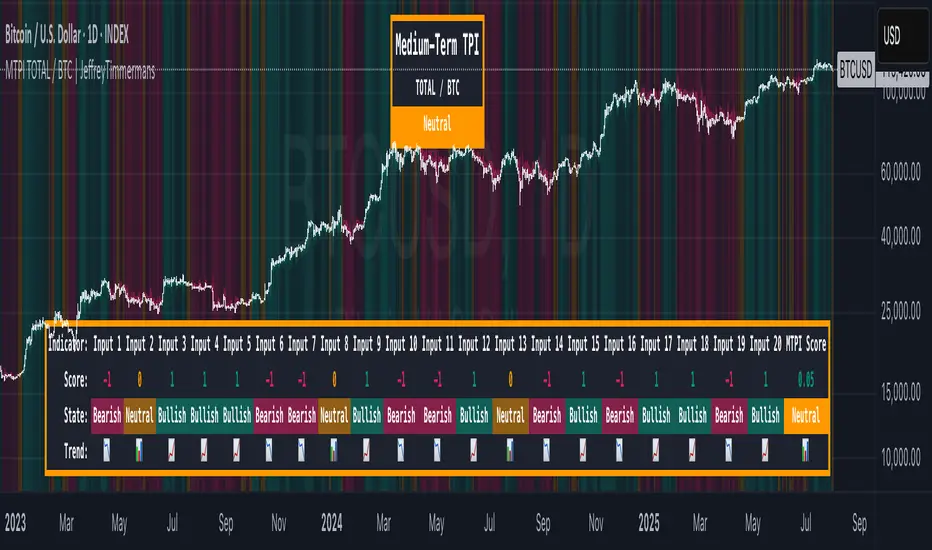
19/23 ema/maMA combination used in the ZFT system so students can identify long term, and short term trends within a minute. This variance emphasizes short term cross overs.
ZFT ClassicMA combination used in the ZFT system so students can identify long term, medium term, and short term trends within a minute.

Intelligent Moving📘 Intelligent Moving – Adaptive Neural Trend Engine
Intelligent Moving is an invite-only, closed-source indicator that dynamically adjusts itself to evolving market conditions using a built-in neural optimizer. It combines a custom adaptive Moving Average, ATR-based deviation bands, and a fully internal virtual trade simulator to deliver smart trend signals and automatic parameter tuning — all without repainting or manual intervention.
This script is built entirely from original code and does not use any open-source components or built-in TradingView indicators.
🧠 Core Logic and Visual Structure
The indicator plots:
- A central moving average (optimized dynamically),
- Upper and lower deviation bands based on ATR × adaptive coefficients,
- Buy (aqua) and Sell (orange) arrows on reversion signals,
- Color-coded trend zones based on price vs. moving average.
All three bands change color in real time depending on the price’s position relative to the MA, clearly showing uptrends (e.g. blue) and downtrends (e.g. red).
📈 Signal Logic: Reversion from Extremes
- Buy Signal: After price closes below the lower deviation band, it then closes back above it.
- Sell Signal: After price closes above the upper deviation band, it then closes back below it.
These signals are not based on crossovers, oscillators, or lagging logic — they are pure structure-based reversion entries, designed to detect exhaustion and reversal zones.
🤖 Built-In Neural Optimizer (Perceptron Engine)
At the heart of Intelligent Moving lies a self-training engine that uses simulated (virtual) positions to test multiple configurations and pick the best one. Here’s how it works:
🔄 Virtual Trade Simulation
At regular intervals (user-defined), the script:
- Simulates virtual buy/sell positions based on its signal logic.
- Applies virtual Stop-Loss (just beyond the signal zone) and virtual Take-Profit (when price crosses back over the MA).
- Calculates simulated profit for each combination of:
- - MA periods,
- - Upper/lower ATR multipliers.
🧠 Neural Training Process
- A perceptron-like engine evaluates the simulated results.
- It selects the best-performing configuration and applies it to live plotting.
- You can choose whether optimization uses a base value or the last best result from the previous training pass.
This process runs forward-only and never overwrites history or uses future data. It's completely transparent and non-repainting.
⚙️ Customization and Parameters
Users can control:
- MA period range, step, and training type (base vs last best)
- Deviation multiplier ranges and step
- Training depth (number of bars in history)
- Training interval (how often to retrain)
- Spread simulation, alert options, and all visual settings
💡 What Makes It Unique
- ✅ Self-optimization with virtual trades and perceptron logic
- ✅ Adaptive deviation bands based on ATR (not standard deviation)
- ✅ No built-in indicators, no repaints, no curve-fitting
- ✅ Clear trend zones and reversal signals
- ✅ Optimized for live use and consistent behavior across assets
Unlike typical moving average tools, Intelligent Moving thinks, adapts, and reacts — turning a standard concept into a living, learning trend engine.
📊 Use Cases
- Trend detection with adaptive coloring
- Reversion trading from volatility extremes
- Dynamic strategy building with minimal manual input
- Alerts for automated or discretionary traders
🔒 Invite-Only Notice
This script is invite-only and closed-source.
The optimization logic, trade simulation system, and perceptron engine were developed from scratch, specifically for this indicator. No built-in functions (e.g. MA, BB, RSI) or public scripts were used or copied.
All decisions and calculations are based on current and past price only — no repainting, retrofitting, or future leakage.
⚠️ Disclaimer
This indicator is for educational and analytical use only.
It does not predict future prices or guarantee profits. Always use appropriate risk management and test thoroughly before live trading.