Trend Cloud with Buy/Sell Text [wjdtks255]Indicator Title: Trend Cloud with Buy/Sell Signal Pro
Short Description
A high-probability trend-following indicator based on Supertrend dynamics, enhanced with a Volume Filter to pinpoint explosive entries while minimizing false breakouts.
Detailed Description (Overview)
The Trend Cloud with Buy/Sell Text is designed for traders who prioritize clarity and momentum. It visualizes market trends through a "Trend Cloud" system and generates real-time BUY/SELL signals only when price action is backed by significant trading volume.
Key Technical Pillars
Dynamic Trend Cloud: Fills the area between the price and the Supertrend line, providing immediate visual feedback on trend strength and potential support/resistance zones.
Smart Volume Filter: A unique logic that compares current volume against a 20-period moving average. Labels only appear when a trend shift occurs with above-average volume, filtering out weak "fakeouts."
No-Repaint Labels: Signals are calculated and fixed at the close of the candle, ensuring that the BUY/SELL text remains permanent for reliable historical backtesting and live execution.
The Alpha Hunter Strategy (How to Trade)
1. Long Entry (Buy)
Condition: The cloud turns Aqua and a "BUY" label appears below the candle.
Confirmation: Ensure the price remains above the Aqua Trend Line.
Volume Check: The indicator automatically verifies if the volume is higher than the 20-period average before displaying the label.
Exit: Exit when a "SELL" signal appears or the price closes below the Aqua line.
2. Short Entry (Sell)
Condition: The cloud turns Red and a "SELL" label appears above the candle.
Confirmation: Price should stay below the Red Trend Line.
Exit: Exit when a "BUY" signal appears or the price closes above the Red line.
Input Parameters & Optimization
ATR Period (Default: 10): Determines the sensitivity to price volatility.
ATR Factor (Default: 3.0): Controls the distance of the trend line. Increase to 3.5 - 4.0 to reduce noise in choppy markets.
Volume Filter (Toggle): When enabled, only high-momentum signals are shown.
Recommended Usage
Best Timeframes: 15m, 1h, 4h.
Asset Classes: Highly effective for Crypto (BTC/ETH) and high-volume stocks.
Trendcloud

50% Fib Trend Cloud + ATR BandsThis indicator plots two structural 50% fibonacci midpoints from recent confirmed 'left/right' swings that form a *cloud* of equilibrium, then adds a rolling 50% fibonacci range midpoint based on a lookback window that's wrapped in ATR bands. Importantly, it solves a specific trading problem:
Structural midpoints (macro context) are powerful but can lag when price escapes prior ranges. Enter rolling 50% fib + ATR ➡️ which restores real-time balance & tolerance (micro context). Together they show where price is balanced structurally, where it’s balanced right now, and how much volatility to tolerate before acting.
➖➖➖
🔑 Why this is different
Most tools either draw a single midpoint (ex., daily 50%) or ATR bands around a moving average. This script fuses dual swing-based 50% midpoints (structure) + a rolling 50% with ATR (flow), so you don’t lose context when price escapes prior ranges. The cloud tells you who’s in control (fast vs. slow structure). The rolling 50% + ATR tells you how far is “too far” now.
➖➖➖
🧠 What it does (at a glance)
🔸Structural Equilibrium × 2 (Fib1/Fib2)
Two independent 50% midpoints formed from swing pivots (configurable Left/Right bars + optional smoothing). Their gap is the Midpoint Cloud = structural “fair value” zone.
🔸Rolling 50% + ATR Bands
A rolling highest/lowest window computes an always-current 50% rolling midpoint plot; ±ATR × length envelopes define a soft value area and over-stretch boundaries.
🔸Actionable Visuals
Optional fill between Fib1/Fib2, labels, and candle-overlay modes to instantly read regime (above both / below both / between).
🔸Smart Defaults
Timeframe-aware presets for L/R pivots & smoothing; full manual overrides available.
➖➖➖
⚙️ Calculations (plain-English)
🔸Pivot midpoints (Fib1 & Fib2):
1) Detect a swing using `Left/Right` bars
2) Take the swing’s high/low → compute 50%
3) (Optional) Smooth the line (SMA) to stabilize on noisy TFs
4) Repeat with a different sensitivity to get two distinct midpoints
🔸Rolling midpoint:
Highest High / Lowest Low over the last *N* bars → (HH + LL) / 2
🔸ATR levels:
`Upper = Rolling50 + ATR × Mult`, `Lower = Rolling50 − ATR × Mult`
(Typical: ATR length 14–21; Multipliers 2.236 for L1, 5.382 for L2)
➖➖➖
🤖 Auto-Configured Presets (with Manual Override)
💡Goal: make the midpoints “just work” on common timeframes while still letting you dial them in.
💡How Auto Presets work
When Auto Presets = ON, the script picks sensible L/R/S (Left bars / Right bars / Smoothing) for Fib Trend 1 and Fib Trend 2 based on chart timeframe.
🔸Fib 1 (fast) emphasizes *micro-structure* for quicker bias shifts.
🔸Fib 2 (slow) emphasizes *macro-structure* for anchor/bias context.
These defaults keep Fib 1 responsive without jitter and Fib 2 stable without lag.
➡️ Turn Auto Presets = OFF to take full control with the manual inputs described below.
➖➖➖
🛠 Manual Fib Midpoint Settings (when Auto = OFF)
💡Each midpoint uses three knobs:
🔸Pivot Left (L): bars to the left that must be lower/higher to qualify a swing
🔸Pivot Right (R): bars to the right that must be lower/higher to confirm the swing
🔸Smoothing (S): SMA period applied to the raw 50% midpoint (stabilizes noise)
5-Minute optimized defaults
🔸Fib Trend 1: `L21 / R5 / S55` → responsive local structure (entries/exits, re-balancing zones)
🔸Fib Trend 2: `L55 / R13 / S89` → broader structure (trend context, anchors/stops)
Timeframe guidance
🔸1m–3m: may feel a touch laggy → consider ~`L13 / R3 / S34`
🔸15m–1h: defaults remain strong → optionally ~`L34 / R8 / S89`
🔸4h+ : increase span for stability → `L89–144 / R13–21 / S144–233`
➡️ Rule of thumb: shorter L/R = faster detection, longer S = smoother line. Tune until Fib 1 captures the “active swing” and Fib 2 captures the “dominant swing” without whipsaw.
➖➖➖
🎛 Inputs (quick reference)
🔸Fib Trend 1/2: Source (High/Low/Close), Left/Right bars, Smoothing length, Show/Hide, Cloud fill toggle
🔸Rolling 50%: Lookback length, Price basis (Wicks/Close/HLC3/OHLC4), Plot scope (Full / Last N / None)
🔸ATR Bands: ATR length, Multipliers (L1/L2), Plot scope, Line width/colors
🔸Overlay & Labels: Candle overlay mode, Label padding/size, 50% centerline toggle, Plot widths
➖➖➖
🖍️ Candle Coloring & Overlay Modes
💡Purpose: make trend instantly visible on the candles and ATR levels.
1) Color Logic (dropdown)
🔸 Fib Midpoints — Colors by position of price vs. Fib 1 & Fib 2
🔸ATR Zones — Colors by which ATR zone price is in relative to the Rolling 50%
➡️ Price Reference: Choose the input used for the decision (Close, HL2, OHLC3, OHLC4).
➡️Tip: Close is crisp; HL2/OHLC variants are smoother.
2) Overlay Style (dropdown)
🔸 None — No visual change to candles
🔸 Bar Color — Uses `barcolor()` to tint built-in candles (this takes into account your Trading View settings, for instance if you have wicks set to white, they will show up as white with this setting)
🔸 PlotCandles — Draws unified custom candles (body, wick, border) with the same color for maximum clarity
💡Practical use
🔸 Pick Fib Midpoints to read structural bias at a glance (above/below/between the cloud).
🔸 Pick ATR Zones to read value vs. stretch around the Rolling 50% (mean-reversion vs. trend extension).
➖➖➖
📘 How to use
A) Trend confirmation
- Strong bullish bias when price holds above both structural mids; strong bearish when below both.
- Use the Rolling 50% + ATR as a dynamic re-entry zone: pullbacks that respect ATR(L1) often continue the prevailing trend.
B) Transition / mean reversion
- Inside the Cloud (between Fib1 & Fib2) treat behavior as neutralization/re-balancing; range tactics tend to outperform momentum plays.
- In ranges, fades near ±ATR around the rolling 50% can mark short-term edges.
C) Breakout context
- When price leaves the Cloud, the Rolling 50% keeps you anchored so price never feels “floating.” A clean hold outside ATR(L1/L2) suggests regime strength; quick re-entries hint at traps.
➖➖➖
🖼 Chart examples
➡️ Each snapshot shows how the Cloud (structure) and the Rolling 50% + ATR (flow) work together.
1) 1-Minute Downtrend – Cloud as Dynamic Ceiling
- The Cloud slopes down; pullbacks repeatedly fail under the Cloud’s underside.
- Rolling 50% (dashed mid) + ATR(L1) act as a reversion band: rallies stall near upper ATR and rotate lower.
2) 15-Minute Persistent Drift – Structure Guides, Flow Times Entries
- Long drift lower with Cloud overhead.
- Consolidations near the rolling mid resolve in the trend direction; ATR bands frame risk on each attempt.
3) 15-Minute Uptrend (BTC) – From Cloud Escape to Value Stair-Step
- After escaping the prior Cloud, rolling 50% + ATR establish a new higher value area.
- Pullbacks into ATR(L1) produce orderly stair-steps; Cloud remains supportive on deeper dips
4) 5-Minute BTC – Pullback to Value then Rotate
- Strong leg up; retrace tags lower ATR band and rotates back toward the rolling mid.
- Labels (Fib1/Fib2) make the structural context explicit for decision-making.
➖➖➖
🧪 Starter presets
- Intraday (5–15m): Fib1 ~ L21/R5 (smooth 5), Fib2 ~ L55/R13 (smooth 9) • Rolling = 55 • ATR = 14 • L1 = 2.5x, L2 = 5.0x
- Scalping: Shorten lookbacks & smoothing; keep ATR multipliers similar, or tighten L1.
- Swing: Lengthen all lookbacks; consider ATR length 21–28.
➖➖➖
🏁Final Word
This script is not just a visual tool, it’s a complete trend and structure framework. Whether you're looking for clean trend alignment, dynamic support/resistance, or early warning signs of a reversal, this system is tuned to help you react with confidence — not hindsight.
Rembember, no single indicator should be used in isolation. For best results, combine it with price action analysis, higher-timeframe context, and complementary tools like trendlines, moving averages etc Use it as part of a well-rounded trading approach to confirm setups — not to define them alone.
---
💡Turn logic into clarity. Structure into trades. And uncertainty into confidence.

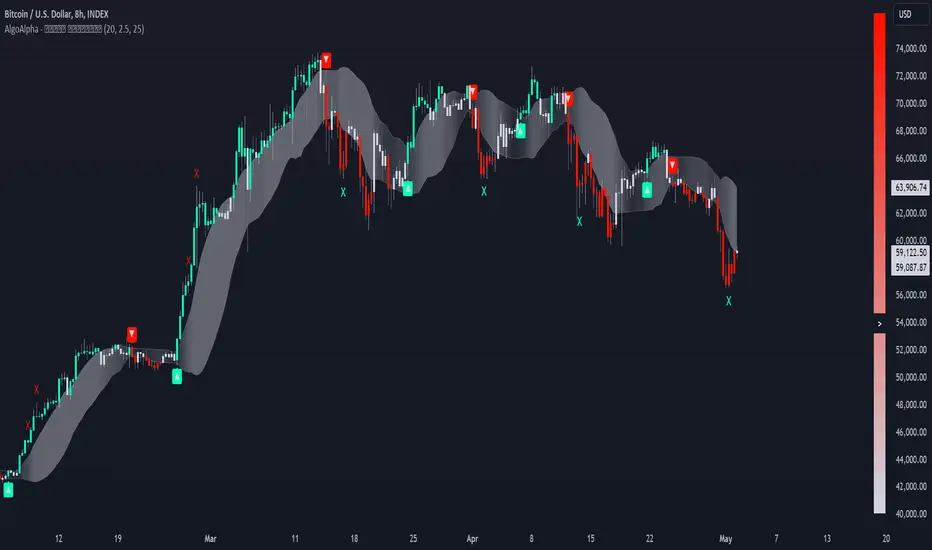
Trend Strength Signals [AlgoAlpha]🌟Introducing the Trend and Strength Signals indicator by AlgoAlpha ! This tool is designed to help you identify trends and gauge market strength with precision and ease. 📈🚀
🛠 Customizable Parameters : Adjust the period, standard deviation multiplier, gauge size, and colors to fit your trading style.
📊 Trend Detection : Visualize trends with clear color-coded signals for uptrends and downtrends.
📈 Strength Gauge : Assess market strength with a dynamic gauge that adapts to the current price action.
🔔 Alerts : Set alerts for bullish and bearish trend crossovers and take profit points to stay ahead of the market.
🎨 Visual Enhancements : Enjoy a clutter-free chart with the integration of plot shapes, color fills, and gradient gauges.
🚀 Quick Guide to Using the Trend and Strength Signals Indicator
Maximize your trading with the Trend and Strength Signals indicator by following these streamlined steps! 🎯✨
🛠 Add the Indicator : Add the indicator to your favorites. Customize settings like period, standard deviation multiplier, and colors to fit your trading style.
📊 Market Analysis : Observe the color-coded candles and gauge to understand market trend direction and strength. Use the alerts for key trading signals.
🔔 Alerts : Enable notifications for trend crossovers and take profit points to catch trading opportunities without constantly monitoring the chart.
⚙️ How it works
This indicator calculates the moving average and standard deviation of the closing price over a customizable period to identify the upper and lower bounds. When the price crosses these bounds, it signals an uptrend or downtrend. The gauge measures market strength by comparing the price to the moving average and scaling it over a customizable range, while the underlying logic uses concepts from the Bollinger Bands, this indicator gives a unique perspective on price behavior through added features and signals derived from it.
Unleash the power of trend and strength analysis with this comprehensive indicator! Happy trading! 🚀📈✨
TrendSphere (Zeiierman)█ Overview
TrendSphere is designed to capture and visualize market trends and volatility effectively. It combines various volatility measures and trend analysis techniques, producing dynamic bands and a central trend line on the price chart. Its essence is to offer a real-time, reliable estimate of the underlying linear trend in the price.
█ How It Works
Real-Time Trend Estimation
At its core, TrendSphere is designed to offer instantaneous and accurate insights into the inherent linear trend of asset prices. By continually updating its estimations, it ensures traders are equipped with the most current data. This allows the construction of support and resistance bands around the estimated trend, providing trading opportunities.
Dynamic Bands and Trend Line
TrendSphere plots a central trend line and dynamic bands around it on the price chart. Influenced by volatility, the distance between these elements offers a clear view of market conditions and the strength or weakness of trends. These bands not only depict potential turning points but also offer traders valuable opportunities to trade within the confines of the overarching trend.
Volatility Measures
Traders can select their preferred volatility measure and adjust settings to best fit their analysis needs. The bands and trend line dynamically respond to these selections, offering a tailored view of market conditions.
ATR (Average True Range): Reflects market volatility by evaluating the range between high and low prices.
Historical Volatility: Computes price variability using the standard deviation of log returns.
Bollinger Band Width: Measures the distance between Bollinger Bands, providing another angle on market volatility.
Eliminating Common Complications
One of the standout features of TrendSphere is its ability to determine linear price trends without falling prey to challenges like backpainting or repainting. In layman's terms, this means traders get a more trustworthy and unaltered view of price movements, leading to enhanced decision-making in line with the genuine trajectory of price trends.
█ How to Use
Trend Analysis
Observe the central trend line; its direction indicates the prevailing trend. When the price is above the trend line, it suggests an upward trend, and when it's below, it indicates a downward trend.
Volatility Analysis
Wider bands imply higher market volatility, suggesting larger price swings, while narrower bands indicate lower volatility. Traders can use the bands to identify potential reversal points and overbought/oversold conditions.
Potential Trading Signals (Using Bollinger bandwidth as volatility measure)
Consider buying when the price is above the trend line with narrowing bands, suggesting a strong upward trend.
Consider selling when the price is below the trend line with narrowing bands, indicating a strong downward trend.
█ Settings
Select Volatility Measure
Choose the desired volatility measure: ATR, Historical Volatility, or Bollinger Band Width.
Volatility Scaling Factor
Adjusts the scale of the volatility measure, influencing the width of the bands.
Volatility Strength
Modifies the influence of volatility on the bands, adjusting their responsiveness to volatility changes.
Length
Defines the number of periods used in calculating the selected volatility measure, impacting the stability and responsiveness of the bands.
Trend Sensitivity
Adjusts the sensitivity of the trend component, affecting how quickly it reacts to price changes.
█ Related scripts with the same calculation philosophy
TrendCylinder
Predictive Trend and Structure
-----------------
Disclaimer
The information contained in my Scripts/Indicators/Ideas/Algos/Systems does not constitute financial advice or a solicitation to buy or sell any securities of any type. I will not accept liability for any loss or damage, including without limitation any loss of profit, which may arise directly or indirectly from the use of or reliance on such information.
All investments involve risk, and the past performance of a security, industry, sector, market, financial product, trading strategy, backtest, or individual's trading does not guarantee future results or returns. Investors are fully responsible for any investment decisions they make. Such decisions should be based solely on an evaluation of their financial circumstances, investment objectives, risk tolerance, and liquidity needs.
My Scripts/Indicators/Ideas/Algos/Systems are only for educational purposes!

SuperCloudSupercloud is a MA based Trend Representation. Its different from a normal MA Cloud. Cloud starts from '0' level and rise or fall based on price.
Supercloud is plotted based on the difference of the price movement between various MA's of different length. All MA's are plotted with reference to EMA 200. So when the MA's converge or Diverge or Bounce back we can still be in the Trend unless the Cloud goes below or above Zero Line.
works in all Timeframes.
Up Trend:
-> All MA's are Above Zero and Cloud color is complete green
-> A decrease in Cloud Volume indicates a weaker Momentum
Down Trend:
-> All MA's are Below Zero and Cloud color is complete red
-> A decrease in Cloud Volume indicates a weaker Momentum
Sideways:
-> A Mixed color indicates a Sideways moment.
Cloud Outlines:
1) The outer edge of Cloud shows the actual trend.
2) its based on MA-5, when price is above MA 5 or Below MA 5 a bright green and bright red outlines are plotted.
Buy Signals Confirmation:
upper Outer Cloud must be Bright Green
Cloud under must be fully Shaded Green
Alternatively EMA crossover can be used and confirmed.
Sell Signals Confirmation:
lower Outer Cloud must be Bright Red
Cloud under must be fully Shaded Red
Alternatively EMA cross under can be used and confirmed.
MACD
MACD is also plotted within the cloud.
Color ribbon is used to plot MACD
Histogram is not present. Instead use the width of the MACD Ribbon
Correspondingly Outer Cloud represents the Histogram.
Zero Line:
Zero line is actually EMA5 which is to be treated as EMA200 for our visual representation.
A sideway channel is plotted around Zero line.
When price reaches this sideways Zone price usually get rejections and starts moving side ways.
Trend is established only after price crosses the sideway band.
Sideway is calculated based on mintick of the Asset which varies. a min value equivalent to 10EMA or value 10 must be used for better usage.
