CCI Zero Line StrategyCCI Zero Line Strategy i have created this using cci just check in different time frame you and check the results
Trend Analizi

ATH대비 지정하락률에 도착 시 매수 - 장기홀딩 선물 전략(ATH Drawdown Re-Buy Long Only)본 스크립트는 과거 하락 데이터를 이용하여, 정해진 하락 %가 발생하는 경우 자기 자본의 정해진 %만큼을 진입하게 설계되어진 스트레티지입니다.
레버리지를 사용할 수 있으며 기본적으로 셋팅해둔 값이 내장되어있습니다.(자유롭게 바꿔서 쓰시면 됩니다.) 추가적으로 2번의 진입 외에도 다른 진입 기준, 진입 %를 설정하실 수 있으며 - ChatGPT에게 요청하면 수정해줄 것입니다.
실제 사용용도로는 KillSwitch 기능을 꺼주세요. 바 돋보기 기능을 켜주세요.
ATH Drawdown Re-Buy Long Only 전략 설명
1. 전략 개요
ATH Drawdown Re-Buy Long Only 전략은 자산의 역대 최고가(ATH, All-Time High)를 기준으로 한 하락폭(드로우다운)을 활용하여,
특정 구간마다 단계적으로 롱 포지션을 구축하는 자동 재매수(Long Only) 전략입니다.
본 전략은 다음과 같은 목적을 가지고 설계되었습니다.
급격한 조정 구간에서 체계적인 분할 매수 및 레버리지 활용
ATH를 기준으로 한 명확한 진입 규칙 제공
실시간으로
평단가
레버리지
청산가 추정
계좌 MDD
수익률
등을 시각적으로 제공하여 리스크와 포지션 상태를 직관적으로 확인할 수 있도록 지원
※ 본 전략은 교육·연구·백테스트 용도로 제공되며,
어떠한 형태의 투자 권유 또는 수익을 보장하지 않습니다.
2. 전략의 핵심 개념
2-1. ATH(역대 최고가) 기준 드로우다운
전략은 차트 상에서 항상 가장 높은 고가(High)를 ATH로 기록합니다.
새로운 고점이 형성될 때마다 ATH를 갱신하고, 해당 ATH를 기준으로 다음을 계산합니다.
현재 바의 저가(Low)가 ATH에서 몇 % 하락했는지
현재 바의 종가(Close)가 ATH에서 몇 % 하락했는지
그리고 사전에 설정한 두 개의 드로우다운 구간에서 매수를 수행합니다.
1차 진입 구간: ATH 대비 X% 하락 시
2차 진입 구간: ATH 대비 Y% 하락 시
각 구간은 ATH가 새로 갱신될 때마다 한 번씩만 작동하며,
새로운 ATH가 생성되면 다시 “1차 / 2차 진입 가능 상태”로 초기화됩니다.
2-2. 첫 포지션 100% / 300% 특수 규칙
이 전략의 중요한 특징은 **“첫 포지션 진입 시의 예외 규칙”**입니다.
전략이 현재 어떠한 포지션도 들고 있지 않은 상태에서
최초로 롱 포지션을 진입하는 시점(첫 포지션)에 대해:
기본적으로는 **자산의 100%**를 기준으로 포지션을 구축하지만,
만약 그 순간의 가격이 ATH 대비 설정값 이상(예: 약 –72.5% 이상 하락한 상황) 이라면
→ 자산의 300% 규모로 첫 포지션을 진입하도록 설계되어 있습니다.
이 규칙은 다음과 같이 동작합니다.
첫 진입이 1차 드로우다운 구간에서 발생하든,
첫 진입이 2차 드로우다운 구간에서 발생하든,
현재 하락폭이 설정된 기준 이상(예: –72.5% 이상) 이라면
→ “이 정도 하락이면 첫 진입부터 더 공격적으로 들어간다”는 의미로 300% 규모로 진입
그 이하의 하락폭이라면
→ 첫 진입은 100% 규모로 제한
즉, 전략은 다음 두 가지 모드로 동작합니다.
일반적인 상황의 첫 진입: 자산의 100%
심각한 드로우다운 구간에서의 첫 진입: 자산의 300%
이 특수 규칙은 깊은 하락에서는 공격적으로, 평소에는 상대적으로 보수적으로 진입하도록 설계된 것입니다.
3. 전략 동작 구조
3-1. 매수 조건
차트 상 High 기준으로 ATH를 추적합니다.
각 바마다 해당 ATH에서의 하락률을 계산합니다.
사용자가 설정한 두 개의 드로우다운 구간(예시):
1차 구간: 예를 들어 ATH – 50%
2차 구간: 예를 들어 ATH – 72.5%
각 구간에 대해 다음과 같은 조건을 확인합니다.
“이번 ATH 구간에서 아직 해당 구간 매수를 한 적이 없는 상태”이고,
현재 바의 저가(Low)가 해당 구간 가격 이하를 찍는 순간
→ 해당 바에서 매수 조건 충족으로 간주
실제 주문은:
해당 구간 가격에 맞춰 롱 포지션 진입(리밋/시장가 기반 시뮬레이션) 으로 처리됩니다.
3-2. ATH 갱신과 진입 기회 리셋
차트 상에서 새로운 고점(High)이 기존 ATH를 넘어서는 순간,
ATH가 갱신되고,
1차 / 2차 진입 여부를 나타내는 내부 플래그가 초기화됩니다.
이를 통해, 시장이 새로운 고점을 돌파해 나갈 때마다,
해당 구간에서 다시 한 번씩 1차·2차 드로우다운 진입 기회를 갖게 됩니다.
4. 포지션 사이징 및 레버리지
4-1. 계좌 자산(Equity) 기준 포지션 크기 결정
전략은 현재 계좌 자산을 다음과 같이 정의하여 사용합니다.
현재 자산 = 초기 자본 + 실현 손익 + 미실현 손익
각 진입 구간에서의 포지션 가치는 다음과 같이 결정됩니다.
1차 진입 구간:
“자산의 몇 %를 사용할지”를 설정값으로 입력
설정된 퍼센트를 계좌 자산에 곱한 뒤,
다시 전략 내 레버리지 배수(Leverage) 를 곱하여 실제 포지션 가치를 계산
2차 진입 구간:
동일한 방식으로, 독립된 퍼센트 설정값을 사용
즉, 포지션 가치는 다음과 같이 계산됩니다.
포지션 가치 = 현재 자산 × (해당 구간 설정 % / 100) × 레버리지 배수
그리고 이를 해당 구간의 진입 가격으로 나누어 실제 수량(토큰 단위) 를 산출합니다.
4-2. 첫 포지션의 예외 처리 (100% / 300%)
첫 포지션에 대해서는 위의 일반적인 퍼센트 설정 대신,
다음과 같은 고정 비율이 사용됩니다.
기본: 자산의 100% 규모로 첫 포지션 진입
단, 진입 시점의 ATH 대비 하락률이 설정값 이상(예: –72.5% 이상) 일 경우
→ 자산의 300% 규모로 첫 포지션 진입
이때 역시 다음 공식을 사용합니다.
포지션 가치 = 현재 자산 × (100% 또는 300%) × 레버리지
그리고 이를 가격으로 나누어 실제 진입 수량을 계산합니다.
이 규칙은:
첫 진입이 1차 구간이든 2차 구간이든 동일하게 적용되며,
“충분히 깊은 하락 구간에서는 첫 진입부터 더 크게,
평소에는 비교적 보수적으로” 라는 운용 철학을 반영합니다.
4-3. 실레버리지(Real Leverage)의 추적
전략은 각 바 단위로 다음을 추적합니다.
바가 시작할 때의 기존 포지션 크기
해당 바에서 새로 진입한 수량
이를 바탕으로, 진입이 발생한 시점에 다음을 계산합니다.
실제 레버리지 = (포지션 가치 / 현재 자산)
그리고 차트 상에 예를 들어:
Lev 2.53x 와 같은 형식의 레이블로 표시합니다.
이를 통해, 매수 시점마다 실제 계좌 레버리지가 어느 정도였는지를 직관적으로 확인할 수 있습니다.
5. 시각화 및 모니터링 요소
5-1. 차트 상 시각 요소
전략은 차트 위에 다음과 같은 정보를 직접 표시합니다.
ATH 라인
High 기준으로 계산된 역대 최고가를 주황색 선으로 표시
평단가(평균 진입가) 라인
현재 보유 포지션이 있을 때,
해당 포지션의 평균 진입가를 노란색 선으로 표시
추정 청산가(고정형 청산가) 라인
포지션 수량이 변화하는 시점을 감지하여,
당시의 평단가와 실제 레버리지를 이용해 근사적인 청산가를 계산
이를 빨간색 선으로 차트에 고정 표시
포지션이 없거나 레버리지가 1배 이하인 경우에는 청산가 라인을 제거
매수 마커 및 레이블
1차/2차 매수 조건이 충족될 때마다 해당 지점에 매수 마커를 표시
"Buy XX% @ 가격", "Lev XXx" 형태의 라벨로
진입 비율과 당시 레버리지를 함께 시각화
레이블의 위치는 설정에서 선택 가능:
바 아래 (Below Bar)
바 위 (Above Bar)
실제 가격 위치 (At Price)
5-2. 우측 상단 정보 테이블
차트 우측 상단에는 현재 계좌·포지션 상태를 요약한 정보 테이블이 표시됩니다.
대표적으로 다음 항목들이 포함됩니다.
Pos Qty (Token)
현재 보유 중인 포지션 수량(토큰 기준, 절대값 기준)
Pos Value (USDT)
현재 포지션의 시장 가치 (수량 × 현재 가격)
Leverage (Now)
현재 실레버리지 (포지션 가치 / 현재 자산)
DD from ATH (%)
현재 가격 기준, 최근 ATH에서의 하락률(%)
Avg Entry
현재 포지션의 평균 진입 가격
PnL (%)
현재 포지션 기준 미실현 손익률(%)
Max DD (Equity %)
전략 전체 기간 동안 기록된 계좌 기준 최대 손실(MDD, Max Drawdown)
Last Entry Price
가장 최근에 포지션을 추가로 진입한 직후의 평균 진입 가격
Last Entry Lev
위 “Last Entry Price” 시점에서의 실레버리지
Liq Price (Fixed)
위에서 설명한 고정형 추정 청산가
Return from Start (%)
전략 시작 시점(초기 자본) 대비 현재 계좌 자산의 총 수익률(%)
이 테이블을 통해 사용자는:
현재 계좌와 포지션의 상태
리스크 수준
누적 성과
를 직관적으로 파악할 수 있습니다.
6. 시간 필터 및 라벨 옵션
6-1. 전략 동작 기간 설정
전략은 옵션으로 특정 기간에만 전략을 동작시키는 시간 필터를 제공합니다.
“Use Date Range” 옵션을 활성화하면:
시작 시각과 종료 시각을 지정하여
해당 구간에 한해서만 매매가 발생하도록 제한
옵션을 비활성화하면:
전략은 전체 차트 구간에서 자유롭게 동작
6-2. 진입 라벨 위치 설정
사용자는 매수/레버리지 라벨의 위치를 선택할 수 있습니다.
바 아래 (Below Bar)
바 위 (Above Bar)
실제 가격 위치 (At Price)
이를 통해 개인 취향 및 차트 가독성에 맞추어
시각화 방식을 유연하게 조정할 수 있습니다.
7. 활용 대상 및 사용 예시
본 전략은 다음과 같은 목적에 적합합니다.
현물 또는 선물 롱 포지션 기준 장기·스윙 관점 추매 전략 백테스트
“고점 대비 하락률”을 기준으로 한 규칙 기반 운용 아이디어 검증
레버리지 사용 시
계좌 레버리지·청산가·MDD를 동시에 모니터링하고자 하는 경우
특정 자산에 대해
“새로운 고점이 형성될 때마다
일정한 규칙으로 깊은 조정 구간에서만 분할 진입하고자 할 때”
실거래에 그대로 적용하기보다는,
전략 아이디어 검증 및 리스크 프로파일 분석,
자신의 성향에 맞는 파라미터 탐색 용도로 사용하는 것을 권장합니다.
8. 한계 및 유의사항
백테스트 결과는 미래 성과를 보장하지 않습니다.
과거 데이터에 기반한 시뮬레이션일 뿐이며,
실제 시장에서는
유동성
슬리피지
수수료 체계
강제청산 규칙
등 다양한 변수가 존재합니다.
청산가는 단순화된 공식에 따른 추정치입니다.
거래소별 실제 청산 규칙, 유지 증거금, 수수료, 펀딩비 등은
본 전략의 계산과 다를 수 있으며,
청산가 추정 라인은 참고용 지표일 뿐입니다.
레버리지 및 진입 비율 설정에 따라 손실 폭이 매우 커질 수 있습니다.
특히 **“첫 포지션 300% 진입”**과 같이 매우 공격적인 설정은
시장 급락 시 계좌 손실과 청산 리스크를 크게 증가시킬 수 있으므로
신중한 검토가 필요합니다.
실거래 연동 시에는 별도의 리스크 관리가 필수입니다.
개별 손절 기준
포지션 상한선
전체 포트폴리오 내 비중 관리 등
본 전략 외부에서 추가적인 안전장치가 필요합니다.
9. 결론
ATH Drawdown Re-Buy Long Only 전략은 단순한 “저가 매수”를 넘어서,
ATH 기준으로 드로우다운을 구조적으로 활용하고,
첫 포지션에 대한 **특수 규칙(100% / 300%)**을 적용하며,
레버리지·청산가·MDD·수익률을 통합적으로 시각화함으로써,
하락 구간에서의 규칙 기반 롱 포지션 구축과
리스크 모니터링을 동시에 지원하는 전략입니다.
사용자는 본 전략을 통해:
자신의 시장 관점과 리스크 허용 범위에 맞는
드로우다운 구간
진입 비율
레버리지 설정
다양한 시나리오에 대한 백테스트와 분석
을 수행할 수 있습니다.
다시 한 번 강조하지만,
본 전략은 연구·학습·백테스트를 위한 도구이며,
실제 투자 판단과 책임은 전적으로 사용자 본인에게 있습니다.
/ENG Version.
This script is designed to use historical drawdown data and automatically enter positions when a predefined percentage drop from the all-time high occurs, using a predefined percentage of your account equity.
You can use leverage, and default parameter values are provided out of the box (you can freely change them to suit your style).
In addition to the two main entry levels, you can add more entry conditions and custom entry percentages – just ask ChatGPT to modify the script.
For actual/live usage, please turn OFF the KillSwitch function and turn ON the Bar Magnifier feature.
ATH Drawdown Re-Buy Long Only Strategy
1. Strategy Overview
The ATH Drawdown Re-Buy Long Only strategy is an automatic re-buy (Long Only) system that builds long positions step-by-step at specific drawdown levels, based on the asset’s all-time high (ATH) and its subsequent drawdown.
This strategy is designed with the following goals:
Systematic scaled buying and leverage usage during sharp correction periods
Clear, rule-based entry logic using drawdowns from ATH
Real-time visualization of:
Average entry price
Leverage
Estimated liquidation price
Account MDD (Max Drawdown)
Return / performance
This allows traders to intuitively monitor both risk and position status.
※ This strategy is provided for educational, research, and backtesting purposes only.
It does not constitute investment advice and does not guarantee any profits.
2. Core Concepts
2-1. Drawdown from ATH (All-Time High)
On the chart, the strategy always tracks the highest high as the ATH.
Whenever a new high is made, ATH is updated, and based on that ATH the following are calculated:
How many percent the current bar’s Low is below the ATH
How many percent the current bar’s Close is below the ATH
Using these, the strategy executes buys at two predefined drawdown zones:
1st entry zone: When price drops X% from ATH
2nd entry zone: When price drops Y% from ATH
Each zone is allowed to trigger only once per ATH cycle.
When a new ATH is created, the “1st / 2nd entry possible” flags are reset, and new opportunities open up for that ATH leg.
2-2. Special Rule for the First Position (100% / 300%)
A key feature of this strategy is the special rule for the very first position.
When the strategy currently holds no position and is about to open the first long position:
Under normal conditions, it builds the position using 100% of account equity.
However, if at that moment the price has dropped by at least a predefined threshold from ATH (e.g. around –72.5% or more),
→ the strategy will open the first position using 300% of account equity.
This rule works as follows:
Whether the first entry happens at the 1st drawdown zone or at the 2nd drawdown zone,
If the current drawdown from ATH is at or below the threshold (e.g. –72.5% or worse),
→ the strategy interprets this as “a sufficiently deep crash” and opens the initial position with 300% of equity.
If the drawdown is less severe than the threshold,
→ the first entry is capped at 100% of equity.
So the strategy has two modes for the first entry:
Normal market conditions: 100% of equity
Deep drawdown conditions: 300% of equity
This special rule is intended to be aggressive in extremely deep crashes while staying more conservative in normal corrections.
3. Strategy Logic & Execution
3-1. Entry Conditions
The strategy tracks the ATH using the High price.
For each bar, it calculates the drawdown from ATH.
The user defines two drawdown zones, for example:
1st zone: ATH – 50%
2nd zone: ATH – 72.5%
For each zone, the strategy checks:
If no buy has been executed yet for that zone in the current ATH leg, and
If the current bar’s Low touches or falls below that zone’s price level,
→ That bar is considered to have triggered a buy condition.
Order simulation:
The strategy simulates entering a long position at that zone’s price level
(using a limit/market-like approximation for backtesting).
3-2. ATH Reset & Entry Opportunity Reset
When a new High goes above the previous ATH:
The ATH is updated to this new high.
Internal flags that track whether the 1st and 2nd entries have been used are reset.
This means:
Each time the market makes a new ATH,
The strategy once again has a fresh opportunity to execute 1st and 2nd drawdown entries for that new ATH leg.
4. Position Sizing & Leverage
4-1. Position Size Based on Account Equity
The strategy defines current equity as:
Current Equity = Initial Capital + Realized PnL + Unrealized PnL
For each entry zone, the position value is calculated as follows:
The user inputs:
“What % of equity to use at this zone”
The strategy:
Multiplies current equity by that percentage
Then multiplies by the strategy’s leverage factor
Thus:
Position Value = Current Equity × (Zone % / 100) × Leverage
Finally, this position value is divided by the entry price to determine the actual position size in tokens.
4-2. Exception for the First Position (100% / 300%)
For the very first position (when there is no open position),
the strategy does not use the zone % parameters. Instead, it uses fixed ratios:
Default: Enter the first position with 100% of equity.
If the drawdown from ATH at that moment is greater than or equal to a predefined threshold (e.g. –72.5% or more)
→ Enter the first position with 300% of equity.
The position value is computed as:
Position Value = Current Equity × (100% or 300%) × Leverage
Then it is divided by the entry price to obtain the token quantity.
This rule:
Applies regardless of whether the first entry occurs at the 1st zone or 2nd zone.
Embeds the philosophy:
“In very deep crashes, go much larger on the first entry; otherwise, stay more conservative.”
4-3. Tracking Real Leverage
On each bar, the strategy tracks:
The existing position size at the start of the bar
The newly added size (if any) on that bar
When a new entry occurs, it calculates the real leverage at that moment:
Real Leverage = (Position Value / Current Equity)
This is then displayed on the chart as a label, for example:
Lev 2.53x
This makes it easy to see the actual leverage level at each entry point.
5. Visualization & Monitoring
5-1. On-Chart Visual Elements
The strategy plots the following directly on the chart:
ATH Line
The all-time high (based on High) is plotted as an orange line.
Average Entry Price Line
When a position is open, the average entry price of that position is plotted as a yellow line.
Estimated Liquidation Price (Fixed) Line
The strategy detects when the position size changes.
At each size change, it uses the current average entry price and real leverage to compute an approximate liquidation price.
This “fixed liquidation price” is then plotted as a red line on the chart.
If there is no position, or if leverage is 1x or lower, the liquidation line is removed.
Entry Markers & Labels
When 1st/2nd entry conditions are met, the strategy:
Marks the entry point on the chart.
Displays labels such as "Buy XX% @ Price" and "Lev XXx",
showing both entry percentage and real leverage at that time.
The label placement is configurable:
Below Bar
Above Bar
At Price
5-2. Information Table (Top-Right Panel)
In the top-right corner of the chart, the strategy displays a summary table of the current account and position status. It typically includes:
Pos Qty (Token)
Absolute size of the current position (in tokens)
Pos Value (USDT)
Market value of the current position (qty × current price)
Leverage (Now)
Current real leverage (position value / current equity)
DD from ATH (%)
Current drawdown (%) from the latest ATH, based on current price
Avg Entry
Average entry price of the current position
PnL (%)
Unrealized profit/loss (%) of the current position
Max DD (Equity %)
The maximum equity drawdown (MDD) recorded over the entire backtest period
Last Entry Price
Average entry price immediately after the most recent add-on entry
Last Entry Lev
Real leverage at the time of the most recent entry
Liq Price (Fixed)
The fixed estimated liquidation price described above
Return from Start (%)
Total return (%) of equity compared to the initial capital
Through this table, users can quickly grasp:
Current account and position status
Current risk level
Cumulative performance
6. Time Filters & Label Options
6-1. Strategy Date Range Filter
The strategy provides an option to restrict trading to a specific time range.
When “Use Date Range” is enabled:
You can specify start and end timestamps.
The strategy will only execute trades within that range.
When this option is disabled:
The strategy operates over the entire chart history.
6-2. Entry Label Placement
Users can customize where entry/leverage labels are drawn:
Below Bar (Below Bar)
Above Bar (Above Bar)
At the actual price level (At Price)
This allows you to adjust visualization according to personal preference and chart readability.
7. Use Cases & Applications
This strategy is suitable for the following purposes:
Long-term / swing-style re-buy strategies for spot or futures long positions
Testing rule-based strategies that rely on “drawdown from ATH” as a main signal
Monitoring account leverage, liquidation price, and MDD when using leverage
Handling situations where, for a given asset:
“Every time a new ATH is formed,
you want to wait for deep corrections and enter only at specific drawdown zones”
It is generally recommended to use this strategy not as a direct plug-and-play live system, but as a tool for:
Strategy idea validation
Risk profile analysis
Parameter exploration to match your personal risk tolerance and style
8. Limitations & Warnings
Backtest results do not guarantee future performance.
They are based on historical data only.
In live markets, additional factors exist:
Liquidity
Slippage
Fee structures
Exchange-specific liquidation rules
Funding fees, etc.
The liquidation price is only an approximate estimate, derived from a simplified formula.
Actual liquidation rules, maintenance margin requirements, fees, and other details differ by exchange.
The liquidation line should be treated as a reference indicator, not an exact guarantee.
Depending on the configured leverage and entry percentages, losses can be very large.
In particular, extremely aggressive settings such as “first position 300% of equity” can greatly increase the risk of large account drawdowns and liquidation during sharp market crashes.
Use such settings with extreme caution.
For live trading, additional risk management is essential:
Your own stop-loss rules
Maximum position size limits
Portfolio-level exposure controls
And other external safety mechanisms beyond this strategy
9. Conclusion
The ATH Drawdown Re-Buy Long Only strategy goes beyond simple “buy the dip” logic. It:
Systematically utilizes drawdowns from ATH as a structural signal
Applies a special first-position rule (100% / 300%)
Integrates visualization of leverage, liquidation price, MDD, and returns
All of this supports rule-based long position building in drawdown phases and comprehensive risk monitoring.
With this strategy, users can:
Explore different:
Drawdown zones
Entry percentages
Leverage levels
Run various backtests and scenario analyses
Better understand the risk/return profile that fits their own market view and risk tolerance
Once again, this strategy is intended for research, learning, and backtesting only.
All real trading decisions and their consequences are solely the responsibility of the user.

15m ORB + FVG Strategy (ChadAnt)Core Logic
The indicator's logic revolves around three main phases:
1. Defining the 15-Minute Opening Range (ORB)
The script calculates the highest high (rangeHigh) and lowest low (rangeLow) that occurred during the first 15 minutes of the trading day.
This time window is defined by the sessionStr input, which defaults to 0930-0945 (exchange time).
The high and low of this range are plotted as small gray dots once the session ends (rangeSet = true).
2. Identifying a Fair Value Gap (FVG) Setup
After the 15-minute range is set, the indicator waits for a breakout of either the range high or range low.
A "Strict FVG breakout" requires two conditions on the first candle that closes beyond the range:
The candle before the breakout candle ( bars ago) must have been inside the range.
The breakout candle ( bar ago) must have closed outside the range.
A Fair Value Gap (FVG) must form on the most recent three candles (the current bar and the two previous bars).
Bullish FVG (Long Setup): The low of the current bar (low) is greater than the high of the bar two periods prior (high ). This FVG represents a price inefficiency that the trade expects to fill.
Bearish FVG (Short Setup): The high of the current bar (high) is less than the low of the bar two periods prior (low ).
If a valid FVG setup occurs, the indicator marks a pending setup and draws a colored box to highlight the FVG area (Green for Bullish FVG, Red for Bearish FVG).
3. Trade Entry and Management
If a pending setup is identified, the trade is structured as a re-entry trade into the FVG zone:
Entry Price: Set at the outer boundary of the FVG, which is the low of the current bar for a Long setup, or the high of the current bar for a Short setup.
Stop Loss (SL): Set at the opposite boundary of the FVG, which is the low for a Long setup, or the high for a Short setup.
The trade is triggered (tradeActive = true) once the price retraces to the pendingEntry level.
Risk/Reward (RR) Targets: Three Take Profit (TP) levels are calculated based on the distance between the Entry and Stop Loss:
$$\text{Risk} = | \text{Entry} - \text{SL} |$$
$$\text{TP}n = \text{Entry} \pm (\text{Risk} \times \text{RR}n)$$
where $n$ is 1, 2, or 3, corresponding to the input $\text{RR}1$, $\text{RR}2$, and $\text{RR}3$ values (defaults: 1.0, 1.5, and 2.0).
Trade Lines: Upon triggering, lines for the Entry, Stop Loss, and three Take Profit levels are drawn on the chart for a specified length (lineLength).
A crucial feature is the directional lock (highBroken / lowBroken):
If the price breaks a range level (e.g., simpleBrokeHigh) but without a valid FVG setup, the corresponding directional flag (e.g., highBroken) is set to true permanently for the day.
This prevents the indicator from looking for any subsequent trade setups in that direction for the rest of the day, suggesting that the initial move, without an FVG, exhausted the opportunity.
Open-source script
In true TradingView spirit, the creator of this script has made it open-source, so that traders can review and verify its functionality. Kudos to the author! While you can use it for free, remember that republishing the code is subject to our House Rules.
ChadAnt
Disclaimer
The information and publications are not meant to be, and do not constitute, financial, investment, trading, or other types of advice or recommendations supplied

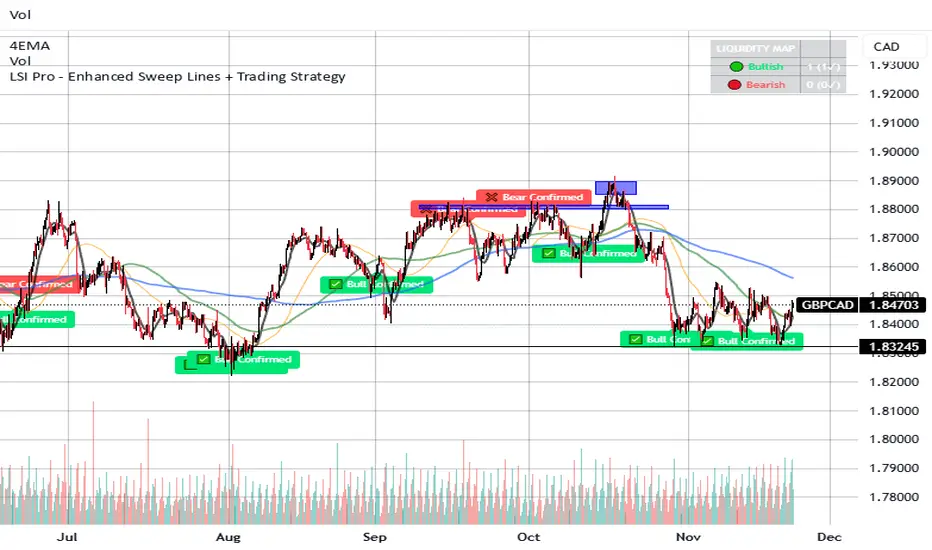
LSI Pro - Enhanced Sweep Lines + Trading StrategyThis is a very powerful and sensitive indicator, it embrace the institutional sweep, signaling the high volumes area with the liquidity areas and levels with bear or bull confirmations.
and more ...
It works very good with most instruments such crypto - forex and stocks.
write me to get access.
Trendviewer_Auctheo.Trendviewer 240 is built for traders who want clearer structure and fewer false starts. It reads higher-timeframe trend strength and turns it into a simple visual map on your active chart. You get precise directional bias, dynamic stop zones that adapt to current volatility, and optional filters that help you stay aligned with momentum instead of fighting it.
The script highlights areas where the trend is shifting, shows you when conditions are supportive for entries, and manages exits using a mix of adaptive levels and tiered targets. Everything is designed to keep your decision-making clean without cluttering the chart or revealing unnecessary details.
If you trade with the higher timeframe in mind but want the execution on the lower timeframe to feel controlled and confident, this tool will fit right in.
Please for free to contact us @theauctiontheorist@gmail.com

Mirror Blocks: StrategyMirror Blocks is an educational structural-wave model built around a unique concept:
the interaction of mirrored weighted moving averages (“blocks”) that reflect shifts in market structure as price transitions between layered symmetry zones.
Rather than attempting to “predict” markets, the Mirror Blocks framework visualizes how price behaves when it expands away from, contracts toward, or flips across stacked WMA structures. These mirrored layers form a wave-like block system that highlights transitional zones in a clean, mechanical way.
This strategy version allows you to study how these structural transitions behave in different environments and on different timeframes.
The goal is understanding wave structure, not generating signals.
How It Works
Mirror Blocks builds three mirrored layers:
Top Block (Structural High Symmetry)
Base Block (Neutral Wave)
Bottom Block (Structural Low Symmetry)
The relative position of these blocks — and how price interacts with them — helps visualize:
Compression and expansion
Reversal zones
Wave stability
Momentum transitions
Structure flips
A structure is considered bullish-stack aligned when:
Top > Base > Bottom
and bearish-stack aligned when:
Bottom > Base > Top
These formations create the core of the Mirror Blocks wave engine.
What the Strategy Version Adds
This version includes:
Long Only, Short Only, or Long & Short modes
Adjustable symmetry distance (Mirror Distance)
Configurable WMA smoothing length
Optional trend filter using fast/slow MA comparison
ENTER / EXIT / LONG / SHORT labels for structural transitions
Fixed stop-loss controls for research
A clean, transparent structure with no hidden components
It is optimized for educational chart study, not automated signals.
Intended Purpose
Mirror Blocks is meant to help traders:
Study structural transitions
Understand symmetry-based wave models
Explore how price interacts with mirrored layers
Examine reversals and expansions from a mechanical perspective
Conduct long and short backtesting for research
Develop a deeper sense of market rhythm
This is not a prediction model.
It is a visual and structural framework for understanding movement.
Backtesting Disclaimer
Backtest results can vary depending on:
Slippage settings
Commission settings
Timeframe
Asset volatility
Structural sensitivity parameters
Past performance does not guarantee future results.
Use this as a research tool only.
Warnings & Compliance
This script is educational.
It is not financial advice.
It does not provide signals.
It does not promise profitability.
The purpose is to help visualize structure, not predict price.
The strategy features are simply here to help users study how structural transitions behave under various conditions.
License
Released under the Michael Culpepper Gratitude License (2025).
Use and modify freely for education and research with attribution.
No resale.
No promises of profitability.
Purpose is understanding, not signals.

Hash Momentum Strategy# Hash Momentum Strategy
## 📊 Overview
The **Hash Momentum Strategy** is a professional-grade momentum trading system designed to capture strong directional price movements with precision timing and intelligent risk management. Unlike traditional EMA crossover strategies, this system uses momentum acceleration as its primary signal, resulting in earlier entries and better risk-to-reward ratios.
---
## ⚡ What Makes This Strategy Unique
### 1. Momentum-Based Entry System
Most strategies rely on lagging indicators like moving average crossovers. This strategy captures momentum *acceleration* - entering when price movement is gaining strength, not after the move has already happened.
### 2. Programmable Risk-to-Reward
Set your exact R:R ratio (1:2, 1:2.5, 1:3, etc.) and the strategy automatically calculates stop loss and take profit levels. No more guessing or manual calculations.
### 3. Smart Partial Profit Taking
Lock in profits at multiple stages:
- **First TP**: Take 50% off at 2R
- **Second TP**: Take 40% off at 2.5R
- **Final TP**: Let 10% ride to maximum target
This approach locks in gains while letting winners run.
### 4. Dynamic Momentum Threshold
Uses ATR (Average True Range) multiplied by your threshold setting to adapt to market volatility. Volatile markets = higher threshold. Quiet markets = lower threshold.
### 5. Trade Cooldown System
Prevents overtrading and revenge trading by enforcing a cooldown period between trades. Configurable from 1-24 bars.
### 6. Optional Session & Weekend Filters
Filter trades by Tokyo, London, and New York sessions. Optional weekend-off toggle to avoid low-liquidity periods.
---
## 🎯 How It Works
### Signal Generation
**STEP 1: Calculate Momentum**
- Momentum = Current Price - Price
- Check if Momentum > ATR × Threshold Multiplier
- Momentum must be accelerating (positive change in momentum)
**STEP 2: Confirm with EMA Trend Filter**
- Long: Price must be above EMA
- Short: Price must be below EMA
**STEP 3: Check Filters**
- Not in cooldown period
- Valid session (if enabled)
- Not weekend (if enabled)
**STEP 4: ENTRY SIGNAL TRIGGERED**
### Risk Management Example
**Example Long Trade:**
- Entry: $100
- Stop Loss: $97.80 (2.2% risk)
- Risk Amount: $2.20
**Take Profit Levels:**
- TP1: $104.40 (2R = $4.40) → Close 50%
- TP2: $105.50 (2.5R = $5.50) → Close 40%
- Final: $105.50 (2.5R) → Close remaining 10%
---
## ⚙️ Settings Guide
### Core Strategy
**Momentum Length** (Default: 13)
Number of bars for momentum calculation. Higher = stronger but fewer signals.
**Momentum Threshold** (Default: 2.25)
ATR multiplier. Higher = only trade biggest moves.
**Use EMA Trend Filter** (Default: ON)
Only long above EMA, short below EMA.
**EMA Length** (Default: 28)
Period for trend-confirming EMA.
### Filters
**Use Trading Session Filter** (Default: OFF)
Restrict trading to specific sessions.
**Tokyo Session** (Default: OFF)
Trade during Asian hours (00:00-09:00 JST).
**London Session** (Default: OFF)
Trade during European hours (08:00-17:00 GMT).
**New York Session** (Default: OFF)
Trade during US hours (08:00-17:00 EST).
**Weekend Off** (Default: OFF)
Disable trading on Saturdays and Sundays.
### Risk Management
**Stop Loss %** (Default: 2.2)
Fixed percentage stop loss from entry.
**Risk:Reward Ratio** (Default: 2.5)
Your target reward as multiple of risk.
**Use Partial Profit Taking** (Default: ON)
Take profits in stages.
**First TP R:R** (Default: 2.0)
First target as multiple of risk.
**First TP Size %** (Default: 50)
Percentage of position to close at TP1.
**Second TP R:R** (Default: 2.5)
Second target as multiple of risk.
**Second TP Size %** (Default: 40)
Percentage of position to close at TP2.
### Trade Management
**Use Trade Cooldown** (Default: ON)
Prevent overtrading.
**Cooldown Bars** (Default: 6)
Bars to wait after closing a trade.
---
## 🎨 Visual Elements
### Chart Indicators
🟢 **Green Dot** (below bar) = Long entry signal
🔴 **Red Dot** (above bar) = Short entry signal
🔵 **Blue X** (above bar) = Long position closed
🟠 **Orange X** (below bar) = Short position closed
**EMA Line** = Trend direction (green when bullish, red when bearish)
**White Line** = Entry price
**Red Line** = Stop loss level
**Green Lines** = Take profit levels (TP1, TP2, Final)
### Dashboard
When not in real-time mode, a dashboard displays:
- Current position (LONG/SHORT/FLAT)
- Entry price
- Stop loss price
- Take profit price
- R:R ratio
- Current momentum strength
- Total trades
- Win rate
- Net profit %
---
## 📈 Recommended Settings by Timeframe
### 1-Hour Timeframe (Default)
- Momentum Length: 13
- Momentum Threshold: 2.25
- EMA Length: 28
- Stop Loss: 2.2%
- R:R Ratio: 2.5
- Cooldown: 6 bars
### 4-Hour Timeframe
- Momentum Length: 24-36
- Momentum Threshold: 2.5
- EMA Length: 50
- Stop Loss: 3-4%
- R:R Ratio: 2.0-2.5
- Cooldown: 6-8 bars
### 15-Minute Timeframe
- Momentum Length: 8-10
- Momentum Threshold: 2.0
- EMA Length: 20
- Stop Loss: 1.5-2%
- R:R Ratio: 2.0
- Cooldown: 4-6 bars
---
## 🔧 Optimization Tips
### Want More Trades?
- Decrease Momentum Threshold (2.0 instead of 2.25)
- Decrease Momentum Length (10 instead of 13)
- Decrease Cooldown Bars (4 instead of 6)
### Want Higher Quality Trades?
- Increase Momentum Threshold (2.5-3.0)
- Increase Momentum Length (18-24)
- Increase Cooldown Bars (8-10)
### Want Lower Drawdown?
- Increase Cooldown Bars
- Use tighter stop loss
- Enable session filters (trade only high-liquidity sessions)
- Enable Weekend Off
### Want Higher Win Rate?
- Increase R:R Ratio (may reduce total profit)
- Increase Momentum Threshold (fewer but stronger signals)
- Use longer EMA for trend confirmation
---
## 📊 Performance Expectations
Based on typical backtesting results:
- **Win Rate**: 35-45%
- **Profit Factor**: 1.5-2.0
- **Risk:Reward**: 1:2.5 (configurable)
- **Max Drawdown**: 10-20%
- **Trades/Month**: 8-15 (1H timeframe)
**Note:** Win rate may appear low, but with 2.5:1 R:R, you only need ~29% win rate to break even. The strategy aims for quality over quantity.
---
## 🎓 Strategy Logic Explained
### Why Momentum > EMA Crossover?
**EMA Crossover Problems:**
- Signals lag behind price
- Late entries = poor R:R
- Many false signals in ranging markets
**Momentum Advantages:**
- Catches moves as they start accelerating
- Earlier entries = better R:R
- Adapts to volatility via ATR
### Why Partial Profit Taking?
**Without Partial TPs:**
- All-or-nothing approach
- Winners often turn to losers
- High stress watching open positions
**With Partial TPs:**
- Lock in 50% at first target
- Reduce risk to breakeven
- Let remainder ride for bigger gains
- Lower psychological pressure
### Why Trade Cooldown?
**Without Cooldown:**
- Revenge trading after losses
- Overtrading in choppy markets
- Emotional decision-making
**With Cooldown:**
- Forces discipline
- Waits for new setup to develop
- Reduces transaction costs
- Better signal quality
---
## ⚠️ Important Notes
1. **This is a momentum strategy, not an EMA strategy**
The EMA only confirms trend direction. Momentum generates the actual signals.
2. **Backtest thoroughly before live trading**
Past performance ≠ future results. Test on your specific asset and timeframe.
3. **Use proper position sizing**
Risk 1-2% of account per trade maximum. The strategy uses 100% equity by default (adjust in Properties).
4. **Dashboard auto-hides in real-time**
Clean chart for live trading. Visible during backtesting.
5. **Customize for your trading style**
All settings are fully adjustable. No single "best" configuration.
---
## 🚀 Quick Start Guide
1. **Add to Chart**: Apply to your preferred asset and timeframe
2. **Keep Defaults**: Start with default settings
3. **Backtest**: Review historical performance
4. **Paper Trade**: Test with simulated money first
5. **Go Live**: Start small and scale up
---
## 💡 Pro Tips
**Tip 1: Combine Timeframes**
Use higher timeframe (4H) for trend direction, lower timeframe (1H) for entries.
**Tip 2: Avoid News Events**
Major news can cause whipsaws. Consider manual intervention during high-impact events.
**Tip 3: Monitor Momentum Strength**
Dashboard shows momentum in sigma (σ). Values >1.0σ indicate very strong momentum.
**Tip 4: Adjust for Volatility**
In high-volatility markets, increase threshold and stop loss. In quiet markets, decrease them.
**Tip 5: Review Losing Trades**
Check if losses are hitting stop loss or reversing. Adjust stop accordingly.
---
## 📝 Changelog
**v1.0** - Initial Release
- Momentum-based signal generation
- EMA trend filter
- Programmable R:R ratio
- Partial profit taking (3 stages)
- Trade cooldown system
- Session filters (Tokyo/London/New York)
- Weekend off toggle
- Smart dashboard (auto-hides in real-time)
- Clean visual design
---
## 🙏 Credits
Developed by **Hash Capital Research**
If you find this strategy useful, please give it a like and share with others!
---
## ⚖️ Disclaimer
This strategy is for educational purposes only. Trading involves substantial risk of loss and is not suitable for all investors. Past performance is not indicative of future results. Always do your own research and consult with a qualified financial advisor before trading.
---
## 📬 Feedback
Have suggestions or found a bug? Leave a comment below! I'm continuously improving this strategy based on community feedback.
---
**Happy Trading! 🚀📈**

ILM & IFVG StrategyPlease feel free to adjust in any way possible. Let me know if you can create something better from this initial coding.
//═══════════════════════════════════════════════════════════════════════
// Inverted Liquidity Model (ILM) – Strategy
//═══════════════════════════════════════════════════════════════════════
//
// The **Inverted Liquidity Model (ILM)** is a liquidity-based algorithm
// built to capture high-probability reversals after:
//
// • A liquidity sweep (SSL/BSL taken)
// • Rejection back inside the range
// • A Fair Value Gap (FVG) forms
// • That FVG becomes invalidated → becomes an IFVG entry zone
//
// ILM combines:
// • LTF BOS / CHOCH structure confirmation
// • HTF structure (expansion) filtering
// • Premium / Discount filter (17:00 CST session midline)
// • Optional ATR volatility filter
// • Optional trading session restrictions
// • Optional partial profit-taking + runners
//
// When all conditions align, the strategy enters:
// ✔ Long after sweep of SSL + valid long IFVG + trend confirmation
// ✔ Short after sweep of BSL + valid short IFVG + trend confirmation
//
// Stops are placed at the sweep wick.
// Full target is set at the next structural high/low.
// Optional partial TP sends a runner to full target.
//
// Visual tools (labels, sweep lines, IFVG boxes, midline) assist
// with review and forward testing.
//
//───────────────────────────────────────────────────────────────────────
// USER CONFIGURABLE FEATURES
//───────────────────────────────────────────────────────────────────────
//
// • **Liquidity & Structure**
// - pivotLen → swing length for pivots / liquidity
// - htfOn → toggle higher-timeframe pivots
// - htfTF → timeframe for HTF structure/liquidity
// - useStructureFilter → enforce LTF BOS/CHOCH trend
// - useHtfExpansionFilter → enforce HTF trend
// - showStructureLabels → show BOS/CHOCH labels
// - showHtfStructureLabels → show HTF BOS/CHOCH labels
//
// • **Premium / Discount Midline**
// - usePremiumDiscountFilter → only long in discount / short in premium
// - pdSession → session used for midline (default 17:00 CST)
// - showPdMidLine → show 50% midline
//
// • **FVG / IFVG Detection**
// - useBodyGapFVG → FVG uses candle bodies instead of wicks
// - useDisplacementFVG → require displacement bar
// - dispAtrMult → minimum ATR threshold for displacement
// - showIFVG → draw IFVG boxes
//
// • **ATR / Volatility / Sessions**
// - useRangeFilter → require minimum ATR%
// - atrLen → ATR period
// - minAtrPerc → minimum ATR% of price
// - useSessionFilter → restrict trading hours
// - sessionTimes → allowed trading session
//
// • **Sweep Visualization**
// - showSweepLines → draw sweep lines at SSL/BSL sweeps
// - sweepLineWidth → thickness of sweep lines
//
// • **Exits: Partial Targets & Runners**
// - usePartialTargets → enable partial TP logic
// - tp1QtyPercent → percent closed at TP1
// - tp1FractionOfPath → TP1 relative to path to full target
//
// • **Formatting / Visibility**
// - labelFontSizeInput → tiny / small / normal / large / huge
// - showEntries → entry markers
// - showTargets → target lines
//
//═══════════════════════════════════════════════════════════════════════
// END OF STRATEGY DESCRIPTION
//═══════════════════════════════════════════════════════════════════════

Rasta Long/Short — StrategyThe Rasta Long/Short Strategy is a visual and educational framework designed to help traders study momentum shifts that appear when a fast EMA interacts with a slower smoothed baseline.
It is not a signal service. Instead, it is a research tool that helps you observe transitions, structure, and behavior across different market conditions and smoothing contexts.
The script plots:
A primary EMA line (fast reaction wave).
A Smoothed line (your chosen smoothing method).
Color-coded fog regions showing directional bias.
Optional DNA rung connections between the two lines for structural comparison.
Together, these allow a deeper study of how momentum pushes, volatility compression, expansions, and drift emerge around fast/slow EMA interactions.
✦ Core Idea
The Rasta Long/Short mechanism studies how price behaves when the fast EMA crosses above or below a smoothed anchor.
Rather than predicting price, it reveals where transitions occur across different structures, timeframes, and smoothing techniques.
The Long/Short logic simply highlights flips in directional structure.
It is not intended for real-time signals or automated execution; it is intended for understanding market movement.
✦ Smoothing Types (Explained)
The strategy allows experimenting with several smoothing families to observe how they transform the fast EMA:
SMA (Simple Moving Average)
Averaged, slower response. Good for stability comparisons.
EMA (Exponential)
Faster reaction, more responsive, smoother behavior during momentum.
RMA (Wilder’s)
Used in RSI calculations; steady, well-balanced response.
WMA (Weighted)
More weight to recent bars; bridges SMA and EMA dynamics.
None
Raw EMA vs EMA interaction with no secondary smoothing.
Each smoothing type provides unique structural information and can lead to different interpretations.
✦ Modes of Study
Designed for multi-timeframe research:
1H / 4H — Momentum flow mapping and structural identification.
Daily / Weekly — Higher-timeframe rotations, macro structure transitions.
1–15m — Microstructure studies, noise vs trend emergence.
Use the built-in Strategy Tester to explore entry/exit context, but treat results as research, not predictive performance.
✦ Components (Visual Study Tools)
EMA Line (Fast)
Primary reactive wave. Shows fast directional shifts.
Smoothed Line (Slow)
Trend baseline / reference structure.
Fog Region
Highlights fast-vs-smoothed directional alignment.
DNA Rungs (Optional)
Structural “bridges” showing the exact relationship between waves on each bar.
Useful for studying separation, compression, and expansions.
✦ Educational Insights
This strategy helps illuminate:
How fast and slow EMAs interact dynamically.
How structure changes precede trend emergence.
Where volatility compresses before expansion.
How noise, drift, and clean reversals differ.
How different smoothers alter the interpretation of the same price data.
The goal is clarity — not prediction.
✦ How to Use
Apply to any timeframe or instrument.
Enable or disable fog depending on preferred visibility.
Use DNA rungs for close structural comparison.
Observe long/short flips as educational reference points — not signals.
Study transitions visually, then backtest using the Strategy Tester for pattern research.
✦ Disclaimer
This script is provided for educational and research purposes only.
It does not provide trading signals, financial advice, or recommendations.
Past behavior does not indicate future performance.
Always practice risk-aware study and consult qualified financial professionals when needed.
✦ Author
Michael Culpepper (mikeyc747)
Creator of the Rasta framework and related market structure studies.

Faraz Perfect Structure XL / XS (Trend-Filtered)Faraz’s Perfect Structure XL/XS identifies premium trend continuation and reversal setups using a three-filter system:
structural breakouts using dynamic swing-based support/resistance,
trend confirmation via 200-EMA slope,
momentum validation through RSI and MACD.
Signals only trigger when all factors align, eliminating noise, chop, and false signals.
Designed for traders who want clean, high-probability long (XL) and short (XS) entries.

EMA 50/200 Pullback + RSI (BTC/USDT 15m - 2 Bar Logic)I recognize that combining indicators requires clear justification on how the components interact Therefore the new scripts description will explicitly detail the strategys operational logic
Objective The strategy is a Trend Following Pullback System designed for high frequency time frames 15m
Synergy The EMA50 EMA200 defines the primary Trend Direction Trend Filter It then utilizes a 2 Bar Pullback Logic to find an entry point where the price has momentarily reversed against the trendline and the RSI 14 serves as a Momentum Filter RSI greater than 50 for Long RSI less than 50 for Short to minimize false signals

Alpha VWAP Regime🔥 Alpha VWAP Regime — Institutional VWAP Strategy (Closed Source)
Alpha VWAP Regime is a multi-layered VWAP trading system that identifies the active market regime and adapts its signals based on institutional liquidity behavior.
This strategy is closed-source because it uses a proprietary combination of VWAP structures, anchored pivot logic, band deviations, and regime detection filters that are not publicly available.
🧠 How the Strategy Works (Conceptual Explanation)
This strategy does not rely on a single VWAP line.
Instead, it builds a VWAP matrix consisting of:
1) Session VWAP
Defines fair value for the current session.
Used to detect intraday directional bias.
2) Anchored VWAP (AVWAP)
Automatically anchored to swing highs and lows (pivot-based).
Tracks where large players accumulated or distributed positions.
3) VWAP Bands (±1σ and ±2σ)
Used as dynamic volatility envelopes:
±1σ = fair-value zone / no-trade area
±2σ = mean-reversion extremes
4) Market Regime Classification (ADX-based)
The strategy determines which environment the market is in:
Trending Regime: ADX above threshold
Ranging Regime: ADX below threshold
Breakout Regime: Volume-based breakout of AVWAP
Each regime activates a different entry model.
📌 Entry Logic (High-Level Overview)
Trend Mode
Triggered only when ADX confirms a trend.
Entries occur near VWAP or −1σ using price-action confirmation.
Mean Reversion Mode
Activated when the market is ranging.
Entries target the ±2σ deviation bands.
Breakout Mode
Triggered by price crossing AVWAP with above-average volume.
Used to catch institutional continuation moves.
ALL Mode
Combines the three models for a full adaptive system.
📉 Exits & Risk Management
All stops and targets use ATR-based volatility sizing
Trend trades aim for larger targets
Mean-reversion trades aim for smaller snapback moves
Breakouts use wider stops but high R:R
🔍 How to Use the Strategy
Load the script on a clean chart
Choose your preferred regime mode (Trend / MR / Breakout / ALL)
Optionally hide VWAP indicators and display signals only
Use realistic position sizing and commissions
Evaluate performance across multiple assets and timeframes
🔒 Why It Is Closed-Source
The code uses:
A custom anchoring engine
Multi-layered regime filters
Dynamic VWAP matrix
Prop logic for bias scoring
These components were built from scratch and form a unique decision model, so the source is protected.
🇸🇦 الشرح العربي لاستراتيجية Alpha VWAP Regime
Alpha VWAP Regime هي استراتيجية تداول مؤسسية متقدمة تعتمد على تحليل السيولة، وتحديد حالة السوق (Market Regime)، ودمج عدة طبقات من VWAP داخل نموذج واحد متكيف.
الهدف من الاستراتيجية هو التداول في المناطق التي يتواجد فيها المال الذكي، وتجنب التداول في المناطق العشوائية أو منخفضة الجودة.
________________________________________
🧠 كيف تعمل الاستراتيجية؟
الاستراتيجية لا تعتمد على VWAP واحد، بل تستخدم “مصفوفة VWAP” كاملة تتكوّن من:
1) VWAP اليومي (Session VWAP)
يُستخدم لتحديد القيمة العادلة خلال الجلسة، وتحديد الاتجاه اللحظي (Intraday Bias).
________________________________________
2) VWAP المثبّت (Anchored VWAP)
يتم تثبيته تلقائيًا على:
• القمم المهمة (Swing Highs)
• القيعان المهمة (Swing Lows)
ويساعد في تحديد مناطق تمركز المؤسسات، ومناطق الانعكاس أو الاختراقات الحقيقية.
________________________________________
3) نطاقات VWAP (±1σ و ±2σ)
تُستخدم كأغلفة ديناميكية للسيولة والتقلب:
• ±1σ = منطقة القيمة العادلة (Fair-Value Zone)
→ غالبًا منطقة غير مناسبة للتداول (No-Trade Zone)
• ±2σ = مناطق التشبّع الحركي (Extremes)
→ مناسبة لاستراتيجيات الانعكاس (Mean Reversion)
________________________________________
4) تصنيف حالة السوق Market Regimes
الاستراتيجية تستخدم مؤشر ADX لتحديد حالة السوق الحالية:
حالة السوق الوصف
Trending اتجاه واضح وقوي
Ranging تذبذب بدون اتجاه
Breakout اختراق مدعوم بحجم تداول
كل Regime يفعّل نموذج دخول مختلف داخل الاستراتيجية.
________________________________________
🎯 نماذج الدخول داخل الاستراتيجية
1) نموذج الاتجاه (Trend Mode)
يعمل فقط عندما يكون السوق في اتجاه حقيقي.
يعتمد على دخول Pullbacks قرب VWAP أو نطاق −1σ مع تأكيد شموعي.
________________________________________
2) نموذج الانعكاس (Mean Reversion Mode)
يعمل فقط عندما يكون السوق متذبذبًا (Range).
الدخول عند لمس ±2σ بهدف العودة نحو VWAP.
________________________________________
3) نموذج الاختراق (Breakout Mode)
يستخدم اختراقات Anchored VWAP
ولكن بشرط وجود حجم تداول أعلى من المتوسط (Volume Confirmation).
________________________________________
4) وضع الدمج (ALL Mode)
يجمع بين النماذج الثلاثة ويجعل الاستراتيجية متكيفة تلقائيًا مع كل حالات السوق.
________________________________________
📉 الخروج وإدارة المخاطر
تستخدم الاستراتيجية نظامًا ديناميكيًا لإدارة المخاطر:
• وقف الخسارة مبني على ATR
• الأهداف مبنية على طبيعة النموذج
• الصفقات الاتجاهية تستهدف R:R أعلى
• صفقات MR أقصر وأسرع
• صفقات Breakout أوسع ولكن مدعومة بزخم قوي
________________________________________
🧩 كيفية استخدام الاستراتيجية
1. ضع الاستراتيجية على رسم بياني نظيف بدون مؤشرات إضافية
2. اختر نموذج الدخول المناسب من الإعدادات
3. فعّل أو أخفِ خطوط VWAP حسب الحاجة
4. استخدم إعدادات مخاطرة واقعية
5. اختبر الاستراتيجية على عدة أسواق وفريمات
________________________________________
🔒 سبب إغلاق الكود
تم إغلاق الكود لأنها تعتمد على:
• محرك تثبيت AVWAP خاص
• نظام Regime Detection متقدم
• مصفوفة VWAP متعددة الطبقات
• منطق دخول/خروج خاص تم تطويره بالكامل
كل ذلك يتطلب حماية الملكية الفكرية، لذا تم نشرها Closed-Source.
EMA Cross Strategy v5 (30 lots) (15 min candle only)- safe flip🚀 EMA Cross Strategy v5 (30 Lots) (15 min candle only)— Safe Flip Edition
Fully Automated | Fast | Reliable | Battle-tested
Welcome to a clean, powerful, and automation-friendly EMA crossover system.
This strategy is built for traders who want consistent trend-based entries without the risk of unwanted pyramiding or doubled positions.
🔥 How It Works
This strategy uses a fast EMA (10) crossing a slow EMA (20) to detect trend shifts:
Bullish Crossover → LONG (30 lots)
Bearish Crossover → SHORT (30 lots)
Every opposite signal safely flips the position by first closing the current trade, then opening a fresh position of exactly 30 lots.
No doubling.
No runaway position size.
No surprises.
Just clean, mechanical trend-following.
📈 Why This Strategy Stands Out
Unlike basic EMA crossbots, this version:
✔ Prevents unintended pyramiding
✔ Never over-allocates capital
✔ Works perfectly with webhook-based automation
✔ Produces stable, systematic entries
✔ Executes directional flips with precision
🔍 Backtest Highlights (1-Year)
(Backtests will vary by instrument/timeframe)
1,500+ trades executed
Profit factor above 1.27
Strong trend performance
Balanced long/short behavior
No margin calls
Consistent trade execution
This strategy thrives in trending markets and maintains strict discipline even in choppy conditions.
⚙️ Automation Ready
Designed for automated execution via webhook and API setups on supported platforms.
Just connect, run, and let the bot follow the rules without hesitation.
No emotions.
No overtrading.
No fear or greed.
Pure logic.

Golden Cross 50/200 EMATrend-following systems are characterized by having a low win rate, yet in the right circumstances (trending markets and higher timeframes) they can deliver returns that even surpass those of systems with a high win rate.
Below, I show you a simple bullish trend-following system with clear execution rules:
System Rules
-Long entries when the 50-period EMA crosses above the 200-period EMA.
-Stop Loss (SL) placed at the lowest low of the 15 candles prior to the entry candle.
-Take Profit (TP) triggered when the 50-period EMA crosses below the 200-period EMA.
Risk Management
-Initial capital: $10,000
-Position size: 10% of capital per trade
-Commissions: 0.1% per trade
Important Note:
In the code, the stop loss is defined using the swing low (15 candles), but the position size is not adjusted based on the distance to the stop loss. In other words, 10% of the equity is risked on each trade, but the actual loss on the trade is not controlled by a maximum fixed percentage of the account — it depends entirely on the stop loss level. This means the loss on a single trade could be significantly higher or lower than 10% of the account equity, depending on volatility.
Implementing leverage or reducing position size based on volatility is something I haven’t been able to include in the code, but it would dramatically improve the system’s performance. It would fix a consistent percentage loss per trade, preventing losses from fluctuating wildly with changes in volatility.
For example, we can maintain a fixed loss percentage when volatility is low by using the following formula:
Leverage = % of SL you’re willing to risk / % volatility from entry point to stop loss
And when volatility is high and would exceed the fixed percentage we want to expose per trade (if the SL is hit), we could reduce the position size accordingly.
Practical example:
Imagine we only want to risk 15% of the position value if the stop loss is triggered on Tesla (which has high volatility), but the distance to the SL represents a potential 23.57% drop. In this case, we subtract the desired risk (15%) from the actual volatility-based loss (23.57%):
23.57% − 15% = 8.57%
Now suppose we normally use $200 per trade.
To calculate 8.57% of $200:
200 × (8.57 / 100) = $17.14
Then subtract that amount from the original position size:
$200 − $17.14 = $182.86
In summary:
If we reduce the position size to $182.86 (instead of the usual $200), even if Tesla moves 23.57% against us and hits the stop loss, we would still only lose approximately 15% of the original $200 position — exactly the risk level we defined. This way, we strictly respect our risk management rules regardless of volatility swings.
I hope this clearly explains the importance of capping losses at a fixed percentage per trade. This keeps risk under control while maintaining a consistent percentage of capital invested per trade — preventing both statistical distortion of the system and the potential destruction of the account.
About the code:
Strategy declaration:
The strategy is named 'Golden Cross 50/200 EMA'.
overlay=true means it will be drawn directly on the price chart.
initial_capital=10000 sets the initial capital to $10,000.
default_qty_type=strategy.percent_of_equity and default_qty_value=10 means each trade uses 10% of available equity.
margin_long=0 indicates no margin is used for long positions (this is likely for simulation purposes only; in real trading, margin would be required).
commission_type=strategy.commission.percent and commission_value=0.1 sets a 0.1% commission per trade.
Indicators:
Calculates two EMAs: a 50-period EMA (ema50) and a 200-period EMA (ema200).
Crossover detection:
bullCross is triggered when the 50-period EMA crosses above the 200-period EMA (Golden Cross).
bearCross is triggered when the 50-period EMA crosses below the 200-period EMA (Death Cross).
Recent swing:
swingLow calculates the lowest low of the previous 15 periods.
Stop Loss:
entryStopLoss is a variable initialized as na (not available) and is updated to the current swingLow value whenever a bullCross occurs.
Entry and exit conditions:
Entry: When a bullCross occurs, the initial stop loss is set to the current swingLow and a long position is opened.
Exit on opposite signal: When a bearCross occurs, the long position is closed.
Exit on stop loss: If the price falls below entryStopLoss while a position is open, the position is closed.
Visualization:
Both EMAs are plotted (50-period in blue, 200-period in red).
Green triangles are plotted below the bar on a bullCross, and red triangles above the bar on a bearCross.
A horizontal orange line is drawn that shows the stop loss level whenever a position is open.
Alerts:
Alerts are created for:Long entry
Exit on bearish crossover (Death Cross)
Exit triggered by stop loss
Favorable Conditions:
Tesla (45-minute timeframe)
June 29, 2010 – November 17, 2025
Total net profit: $12,458.73 or +124.59%
Maximum drawdown: $1,210.40 or 8.29%
Total trades: 107
Winning trades: 27.10% (29/107)
Profit factor: 3.141
Tesla (1-hour timeframe)
June 29, 2010 – November 17, 2025
Total net profit: $7,681.83 or +76.82%
Maximum drawdown: $993.36 or 7.30%
Total trades: 75
Winning trades: 29.33% (22/75)
Profit factor: 3.157
Netflix (45-minute timeframe)
May 23, 2002 – November 17, 2025
Total net profit: $11,380.73 or +113.81%
Maximum drawdown: $699.45 or 5.98%
Total trades: 134
Winning trades: 36.57% (49/134)
Profit factor: 2.885
Netflix (1-hour timeframe)
May 23, 2002 – November 17, 2025
Total net profit: $11,689.05 or +116.89%
Maximum drawdown: $844.55 or 7.24%
Total trades: 107
Winning trades: 37.38% (40/107)
Profit factor: 2.915
Netflix (2-hour timeframe)
May 23, 2002 – November 17, 2025
Total net profit: $12,807.71 or +128.10%
Maximum drawdown: $866.52 or 6.03%
Total trades: 56
Winning trades: 41.07% (23/56)
Profit factor: 3.891
Meta (45-minute timeframe)
May 18, 2012 – November 17, 2025
Total net profit: $2,370.02 or +23.70%
Maximum drawdown: $365.27 or 3.50%
Total trades: 83
Winning trades: 31.33% (26/83)
Profit factor: 2.419
Apple (45-minute timeframe)
January 3, 2000 – November 17, 2025
Total net profit: $8,232.55 or +80.59%
Maximum drawdown: $581.11 or 3.16%
Total trades: 140
Winning trades: 34.29% (48/140)
Profit factor: 3.009
Apple (1-hour timeframe)
January 3, 2000 – November 17, 2025
Total net profit: $9,685.89 or +94.93%
Maximum drawdown: $374.69 or 2.26%
Total trades: 118
Winning trades: 35.59% (42/118)
Profit factor: 3.463
Apple (2-hour timeframe)
January 3, 2000 – November 17, 2025
Total net profit: $8,001.28 or +77.99%
Maximum drawdown: $755.84 or 7.56%
Total trades: 67
Winning trades: 41.79% (28/67)
Profit factor: 3.825
NVDA (15-minute timeframe)
January 3, 2000 – November 17, 2025
Total net profit: $11,828.56 or +118.29%
Maximum drawdown: $1,275.43 or 8.06%
Total trades: 466
Winning trades: 28.11% (131/466)
Profit factor: 2.033
NVDA (30-minute timeframe)
January 3, 2000 – November 17, 2025
Total net profit: $12,203.21 or +122.03%
Maximum drawdown: $1,661.86 or 10.35%
Total trades: 245
Winning trades: 28.98% (71/245)
Profit factor: 2.291
NVDA (45-minute timeframe)
January 3, 2000 – November 17, 2025
Total net profit: $16,793.48 or +167.93%
Maximum drawdown: $1,458.81 or 8.40%
Total trades: 172
Winning trades: 33.14% (57/172)
Profit factor: 2.927


ATR Trend + RSI Pullback Strategy [Profit-Focused]This strategy is designed to catch high-probability pullbacks during strong trends using a combination of ATR-based volatility filters, RSI exhaustion levels, and a trend-following entry model.
Strategy Logic
Rather than relying on lagging crossovers, this model waits for RSI to dip into oversold zones (below 40) while price remains above a long-term EMA (default: 200). This setup captures pullbacks in strong uptrends, allowing traders to enter early in a move while controlling risk dynamically.
To avoid entries during low-volatility conditions or sideways price action, it applies a minimum ATR filter. The ATR also defines both the stop-loss and take-profit levels, allowing the model to adapt to changing market conditions.
Exit logic includes:
A take-profit at 3× the ATR distance
A stop-loss at 1.5× the ATR distance
An optional early exit if RSI crosses above 70, signaling overbought conditions
Technical Details
Trend Filter: 200 EMA – must be rising and price must be above it
Entry Signal: RSI dips below 40 during an uptrend
Volatility Filter: ATR must be above a user-defined minimum threshold
Stop-Loss: 1.5× ATR below entry price
Take-Profit: 3.0× ATR above entry price
Exit on Overbought: RSI > 70 (optional early exit)
Backtest Settings
Initial Capital: $10,000
Position Sizing: 5% of equity per trade
Slippage: 1 tick
Commission: 0.075% per trade
Trade Direction: Long only
Timeframes Tested: 15m, 1H, and 30m on trending assets like BTCUSD, NAS100, ETHUSD
This model is tuned for positive P&L across trending environments and volatile markets.
Educational Use Only
This strategy is for educational purposes only and should not be considered financial advice. Past performance does not guarantee future results. Always validate performance on multiple markets and timeframes before using it in live trading.

Bitcoin & Ethereum Profitable Crypto Investor – FREE EditionBitcoin & Ethereum Profitable Crypto Investor – FREE Edition
by RustyTradingScripts
This is the free, simplified edition of my long-term crypto trend-following strategy designed for Bitcoin, Ethereum, and other major assets. It provides an accessible introduction to the core concepts behind the full version while remaining easy to use, transparent, and beginner-friendly.
This FREE edition focuses on a single technical component: a 102-period Simple Moving Average trend model. When price moves above the SMA, the script considers it a potential long trend environment. When the slope begins to turn down, the strategy exits the position. This creates a straightforward, rules-based framework for identifying trend shifts without emotional or discretionary decision-making.
The goal of this simplified version is to help users understand how a structured trend approach behaves during different market conditions. It demonstrates how using a slow, objective indicator can reduce noise and provide clearer long-term directional context on higher timeframes such as the 10-hour BTC chart shown in the backtest example.
What This FREE Version Includes
- Trend-based entries using a 102-period SMA
- Automatic exits when the SMA slope turns down
- Clean visual plot of the moving average
- No repainting — signals are based on confirmed bar data
- Works on BTC, ETH, and other major crypto assets
- User-adjustable SMA length for customization
What’s Not Included in This Version:
This edition intentionally focuses on the essential trend logic only.
It does NOT include the following components found in the full investor strategy:
- Linear regression smoothing
- Seasonal filters
- Price-extension filtering
- Volume-based protection
- Partial stop-loss and partial take-profit systems
- Cooldown logic after profitable trades
- RSI-based extended exits
- Multi-layered trade management modules
The purpose of this free version is to provide a clear, functional introduction to the underlying trend concept without the advanced filters and risk-management features that are part of the complete system.
How to Use It
Apply the script to your preferred asset and timeframe (commonly higher timeframes such as 4H, 8H, 10H, 12H, or 1D). The script will enter long positions when the market is trading above the SMA and exit when the slope of the average begins to point downward. Users may adjust the SMA length to match their preferred level of responsiveness.
Important Notes
This script is for educational and analytical purposes.
Historical results are not guarantees of future performance.
Always practice proper risk management and perform your own testing.
This script does not repaint.
This FREE version is meant as a helpful starting point for those exploring long-term crypto trend strategies. If you find it useful and wish to explore more advanced tools, feel free to reach out for additional information.

BTC EMA 5-9 Flip Strategy AutobotThis strategy is designed for fast and accurate trend-following trades on Bitcoin.
It uses a crossover between EMA 5 and EMA 9 to detect instant trend reversals and automatically flips between Long and Short positions.
How the strategy works
EMA 5 crossing above EMA 9 → Long
EMA 5 crossing below EMA 9 → Short
Automatically closes the opposite trade during a flip
Executes trades only on candle close
Prevents double entries with internal position-state logic
Fully compatible with automated trading via webhooks (Delta Exchange)
Why this strategy works
EMA 5–9 is extremely responsive for BTC’s volatility
Captures trend reversals early
Works best on 15-minute timeframe
Clean, simple logic without over-filtering reduces missed opportunities
Performs well in both uptrends and downtrends
Automation Ready
This strategy includes alert conditions and webhook-ready JSON for automated execution.
This is a fast-reacting BTC bot designed for intraday and swing crypto trend trading.

RubberBand Scalp NQ Strategy (V6 - High PF Focus)
================================================================================
RUBBERBAND SCALP NQ (V6 - HIGH PF FOCUS)
================================================================================
// STRATEGY OVERVIEW
// -----------------
// Instrument: NQ (Nasdaq 100 E-mini Futures)
// Style: Intraday mean-reversion scalping
// Core Idea: Price "stretches" away from VWAP, then "snaps back" → enter on strong reversal
// Session: 9:00 AM – 2:30 PM CST (America/Chicago)
// Timeframe: 1–5 min (ideal: 2–3 min)
// Position: 2 contracts, pyramiding = 0
// Commission: $2.00 per contract
// Goal: High Profit Factor via asymmetric exits (1R fixed + unlimited runner)
// KEY FILTERS
// -----------
// • Only trade when ATR(15) > 5.0 points (~$100 range) → avoids chop
// • Must be in session → forces flat at 2:30 PM
// • VWAP proximity: price must touch within 0.5 × ATR of VWAP
// ENTRY LOGIC (LONG)
// -----------------
// 1. In session & no position
// 2. Close > Open (bullish bar)
// 3. Close > highest high of last 4 bars → momentum confirmation
// 4. Close > VWAP
// 5. Low < VWAP + (0.5 × ATR) → pullback reached VWAP zone
// 6. ATR > 5.0
// 7. Bar confirmed
// → Plot green triangle below bar
// ENTRY LOGIC (SHORT) – Symmetric
// -----------------
// 1. Close < Open
// 2. Close < lowest low of last 4 bars
// 3. Close < VWAP
// 4. High > VWAP - (0.5 × ATR)
// 5. ATR > 5.0
// → Plot red triangle above bar
// STOP LOSS – DUAL SYSTEM (Widest Stop Wins)
// -----------------------------------------
// VWAP Stop (Long): VWAP - 0.20
// ATR Stop (Long): Close - min(ATR × 1.0, 15.0)
// Final Stop: MAX(VWAP Stop, ATR Stop) → then CAP at Close - 0.20
// Short: MIN of both → FLOOR at Close + 0.20
// → Max buffer: 0.20 pts = $20 (4 ticks)
// → Risk = |Entry – Final Stop|
// PROFIT TAKING – 2 CONTRACTS
// ---------------------------
// Contract #1: Fixed 1R → limit = entry + risk (long) / entry - risk (short)
// Contract #2: Trailing stop only → trail_points = risk, trail_offset = 0
// NO FIXED TAKE PROFIT ON RUNNER → lets 3R, 5R, 10R+ winners run
// BUG: Short runner uses trail_offset = 1.5 → CHANGE TO 0
// V6 IMPROVEMENTS
// ---------------
// 1. ATR_STOP_MULTIPLIER reduced from 1.5 → 1.0 → tighter average loss
// 2. Removed fixed 2R cap on runner → unlimited upside
// 3. Widest-stop logic → prevents premature stop-outs
// TRADE EXAMPLE (LONG)
// -------------------
// Entry: 18,125 (2 contracts)
// Stop: 18,110 → Risk = $300/contract
// 1R: 18,155 → Contract #1 exits (+$600)
// Runner trails by $300 → exits at 18,425 (+$6,000)
// Total P&L: +$6,600
// PERFORMANCE EXPECTATIONS
// ------------------------
// Win Rate: 40–50%
// Avg Winner: >3× avg loser
// Profit Factor: 2.0–3.5+
// Max Drawdown: <5% (with risk controls)
// DAILY CHECKLIST
// ---------------
// 2–3 min NQ chart
// Timezone: America/Chicago
// ATR > 5.0
// Price touched VWAP zone
// 4-bar breakout confirmed
// trail_offset = 0 (both sides)
// Alerts on
// Log R-multiple
// FINAL NOTES
// -----------
// This is a PROFIT FACTOR system — not a high win-rate system.
// Success = discipline + volatility + clean execution.
================================================================================

SP500 Session Gap Fade StrategySummary in one paragraph
SPX Session Gap Fade is an intraday gap fade strategy for index futures, designed around regular cash sessions on five minute charts. It helps you participate only when there is a full overnight or pre session gap and a valid intraday session window, instead of trading every open. The original part is the gap distance engine which anchors both stop and optional target to the previous session reference close at a configurable flat time, so every trade’s risk scales with the actual gap size rather than a fixed tick stop.
Scope and intent
• Markets. Primarily index futures such as ES, NQ, YM, and liquid index CFDs that exhibit overnight gaps and regular cash hours.
• Timeframes. Intraday timeframes from one minute to fifteen minutes. Default usage is five minute bars.
• Default demo used in the publication. Symbol CME:ES1! on a five minute chart.
• Purpose. Provide a simple, transparent way to trade opening gaps with a session anchored risk model and forced flat exit so you are not holding into the last part of the session.
• Limits. This is a strategy. Orders are simulated on standard candles only.
Originality and usefulness
• Unique concept or fusion. The core novelty is the combination of a strict “full gap” entry condition with a session anchored reference close and a gap distance based TP and SL engine. The stop and optional target are symmetric multiples of the actual gap distance from the previous session’s flat close, rather than fixed ticks.
• Failure mode it addresses. Fixed sized stops do not scale when gaps are unusually small or unusually large, which can either under risk or over risk the account. The session flat logic also reduces the chance of holding residual positions into late session liquidity and news.
• Testability. All key pieces are explicit in the Inputs: session window, minutes before session end, whether to use gap exits, whether TP or SL are active, and whether to allow candle based closes and forced flat. You can toggle each component and see how it changes entries and exits.
• Portable yardstick. The main unit is the absolute price gap between the entry bar open and the previous session reference close. tp_mult and sl_mult are multiples of that gap, which makes the risk model portable across contracts and volatility regimes.
Method overview in plain language
The strategy first defines a trading session using exchange time, for example 08:30 to 15:30 for ES day hours. It also defines a “flat” time a fixed number of minutes before session end. At the flat bar, any open position is closed and the bar’s close price is stored as the reference close for the next session. Inside the session, the strategy looks for a full gap bar relative to the prior bar: a gap down where today’s high is below yesterday’s low, or a gap up where today’s low is above yesterday’s high. A full gap down generates a long entry; a full gap up generates a short entry. If the gap risk engine is enabled and a valid reference close exists, the strategy measures the distance between the entry bar open and that reference close. It then sets a stop and optional target as configurable multiples of that gap distance and manages them with strategy.exit. Additional exits can be triggered by a candle color flip or by the forced flat time.
Base measures
• Range basis. The main unit is the absolute difference between the current entry bar open and the stored reference close from the previous session flat bar. That value is used as a “gap unit” and scaled by tp_mult and sl_mult to build the target and stop.
Components
• Component one: Gap Direction. Detects full gap up or full gap down by comparing the current high and low to the previous bar’s high and low. Gap down signals a long fade, gap up signals a short fade. There is no smoothing; it is a strict structural condition.
• Component two: Session Window. Only allows entries when the current time is within the configured session window. It also defines a flat time before the session end where positions are forced flat and the reference close is updated.
• Component three: Gap Distance Risk Engine. Computes the absolute distance between the entry open and the stored reference close. The stop and optional target are placed as entry ± gap_distance × multiplier so that risk scales with gap size.
• Optional component: Candle Exit. If enabled, a bullish bar closes short positions and a bearish bar closes long positions, which can shorten holding time when price reverses quickly inside the session.
• Session windows. Session logic uses the exchange time of the chart symbol. When changing symbols or venues, verify that the session time string still matches the new instrument’s cash hours.
Fusion rule
All gates are hard conditions rather than weighted scores. A trade can only open if the session window is active and the full gap condition is true. The gap distance engine only activates if a valid reference close exists and use_gap_risk is on. TP and SL are controlled by separate booleans so you can use SL only, TP only, or both. Long and short are symmetric by construction: long trades fade full gap downs, short trades fade full gap ups with mirrored TP and SL logic.
Signal rule
• Long entry. Inside the active session, when the current bar shows a full gap down relative to the previous bar (current high below prior low), the strategy opens a long position. If the gap risk engine is active, it places a gap based stop below the entry and an optional target above it.
• Short entry. Inside the active session, when the current bar shows a full gap up relative to the previous bar (current low above prior high), the strategy opens a short position. If the gap risk engine is active, it places a gap based stop above the entry and an optional target below it.
• Forced flat. At the configured flat time before session end, any open position is closed and the close price of that bar becomes the new reference close for the following session.
• Candle based exit. If enabled, a bearish bar closes longs, and a bullish bar closes shorts, regardless of where TP or SL sit, as long as a position is open.
What you will see on the chart
• Markers on entry bars. Standard strategy entry markers labeled “long” and “short” on the gap bars where trades open.
• Exit markers. Standard exit markers on bars where either the gap stop or target are hit, or where a candle exit or forced flat close occurs. Exit IDs “long_gap” and “short_gap” label gap based exits.
• Reference levels. Horizontal lines for the current long TP, long SL, short TP, and short SL while a position is open and the gap engine is enabled. They update when a new trade opens and disappear when flat.
• Session background. This version does not add background shading for the session; session logic runs internally based on time.
• No on chart table. All decisions are visible through orders and exit levels. Use the Strategy Tester for performance metrics.
Inputs with guidance
Session Settings
• Trading session (sess). Session window in exchange time. Typical value uses the regular cash session for each contract, for example “0830-1530” for ES. Adjust if your broker or symbol uses different hours.
• Minutes before session end to force exit (flat_before_min). Minutes before the session end where positions are forced flat and the reference close is stored. Typical range is 15 to 120. Raising it closes trades earlier in the day; lowering it allows trades later in the session.
Gap Risk
• Enable gap based TP/SL (use_gap_risk). Master switch for the gap distance exit engine. Turning it off keeps entries and forced flat logic but removes automatic TP and SL placement.
• Use TP limit from gap (use_gap_tp). Enables gap based profit targets. Typical values are true for structured exits or false if you want to manage exits manually and only keep a stop.
• Use SL stop from gap (use_gap_sl). Enables gap based stop losses. This should normally remain true so that each trade has a defined initial risk in ticks.
• TP multiplier of gap distance (tp_mult). Multiplier applied to the gap distance for the target. Typical range is 0.5 to 2.0. Raising it places the target further away and reduces hit frequency.
• SL multiplier of gap distance (sl_mult). Multiplier applied to the gap distance for the stop. Typical range is 0.5 to 2.0. Raising it widens the stop and increases risk per trade; lowering it tightens the stop and may increase the number of small losses.
Exit Controls
• Exit with candle logic (use_candle_exit). If true, closes shorts on bullish candles and longs on bearish candles. Useful when you want to react to intraday reversal bars even if TP or SL have not been reached.
• Force flat before session end (use_forced_flat). If true, guarantees you are flat by the configured flat time and updates the reference close. Turn this off only if you understand the impact on overnight risk.
Filters
There is no separate trend or volatility filter in this version. All trades depend on the presence of a full gap bar inside the session. If you need extra filtering such as ATR, volume, or higher timeframe bias, they should be added explicitly and documented in your own fork.
Usage recipes
Intraday conservative gap fade
• Timeframe. Five minute chart on ES regular session.
• Gap risk. use_gap_risk = true, use_gap_tp = true, use_gap_sl = true.
• Multipliers. tp_mult around 0.7 to 1.0 and sl_mult around 1.0.
• Exits. use_candle_exit = false, use_forced_flat = true. Focus on the structured TP and SL around the gap.
Intraday aggressive gap fade
• Timeframe. Five minute chart.
• Gap risk. use_gap_risk = true, use_gap_tp = false, use_gap_sl = true.
• Multipliers. sl_mult around 0.7 to 1.0.
• Exits. use_candle_exit = true, use_forced_flat = true. Entries fade full gaps, stops are tight, and candle color flips flatten trades early.
Higher timeframe gap tests
• Timeframe. Fifteen minute or sixty minute charts on instruments with regular gaps.
• Gap risk. Keep use_gap_risk = true. Consider slightly higher sl_mult if gaps are structurally wider on the higher timeframe.
• Note. Expect fewer trades and be careful with sample size; multi year data is recommended.
Properties visible in this publication
• On average our risk for each position over the last 200 trades is 0.4% with a max intraday loss of 1.5% of the total equity in this case of 100k $ with 1 contract ES. For other assets, recalculations and customizations has to be applied.
• Initial capital. 100 000.
• Base currency. USD.
• Default order size method. Fixed with size 1 contract.
• Pyramiding. 0.
• Commission. Flat 2 USD per order in the Strategy Tester Properties. (2$ buying + 2$selling)
• Slippage. One tick in the Strategy Tester Properties.
• Process orders on close. ON.
Realism and responsible publication
• No performance claims are made. Past results do not guarantee future outcomes.
• Costs use a realistic flat commission and one tick of slippage per trade for ES class futures.
• Default sizing with one contract on a 100 000 reference account targets modest per trade risk. In practice, extreme slippage or gap through events can exceed this, so treat the one and a half percent risk target as a design goal, not a guarantee.
• All orders are simulated on standard candles. Shapes can move while a bar is forming and settle on bar close.
Honest limitations and failure modes
• Economic releases, thin liquidity, and limit conditions can break the assumptions behind the simple gap model and lead to slippage or skipped fills.
• Symbols with very frequent or very large gaps may require adjusted multipliers or alternative risk handling, especially in high volatility regimes.
• Very quiet periods without clean gaps will produce few or no trades. This is expected behavior, not a bug.
• Session windows follow the exchange time of the chart. Always confirm that the configured session matches the symbol.
• When both the stop and target lie inside the same bar’s range, the TradingView engine decides which is hit first based on its internal intrabar assumptions. Without bar magnifier, tie handling is approximate.
Legal
Education and research only. This strategy is not investment advice. You remain responsible for all trading decisions. Always test on historical data and in simulation with realistic costs before considering any live use.

MSB Trend Breakout Strategy V7**MSB Trend Breakout Strategy V7**
This is the full, high-precision automated strategy designed for disciplined traders who understand directional price action. The script functions as a robust **entry and trade management tool** following two proprietary concepts:
**1. Trend Confirmation:** A customized Moving Average filter is utilized to ensure entries strictly align with the dominant market flow.
**2. Momentum Confirmation:** The system uses a specific short-term **multi-bar breakout range** to pinpoint high-probability entries at the start of a momentum shift, avoiding choppy market conditions.
**Key Features:**
* **Automated Risk Management:** Includes complete dynamic Stop Loss (SL) and Take Profit (TP) order management to ensure capital preservation.
* **Time Filter:** Optimizes performance by filtering signals to the most liquid Forex trading hours (01:00 to 19:00, broker time).
**PREREQUISITE FOR ACCESS:**
This is an advanced tool. To utilize the strategy effectively, the user should have a foundational understanding of directional bias and trade management principles.
---
**Important Note & Risk Disclosure:**
This strategy is published under **Invite-only** protection. The script does not provide financial advice or guarantee profits. Past performance is not indicative of future results.

Moving Average Band StrategyOverview
The Moving Average Band Strategy is a fully customizable breakout and trend-continuation system designed for traders who need both simplicity and control.
The strategy creates adaptive bands around a user-selected moving average and executes trades when price breaks out of these bands, with advanced risk-management settings including optional Risk:Reward targets.
This script is suitable for intraday, swing, and positional traders across all markets — equities, futures, crypto, and forex.
Key Features
✔ Six Moving Average Types
Choose the MA that best matches your trading style:
SMA
EMA
WMA
HMA
VWMA
RMA
✔ Dynamic Bands
Upper Band built from MA of highs
Lower Band built from MA of lows
Adjustable band offset (%)
Color-coded band fill indicating price position
✔ Configurable Strategy Preferences
Toggle Long and/or Short trades
Toggle Risk:Reward Take-Profit
Adjustable Risk:Reward Ratio
Default position sizing: % of equity (configurable via strategy settings)
Entry Conditions
Long Entry
A long trade triggers when:
Price crosses above the Upper Band
Long trades are enabled
No existing long position is active
Short Entry
A short trade triggers when:
Price crosses below the Lower Band
Short trades are enabled
No existing short position is active
Clear entry markers and price labels appear on the chart.
Risk Management
This strategy includes a complete set of risk-controls:
Stop-Loss (Fixed at Entry)
Long SL: Lower Band
Short SL: Upper Band
These levels remain constant for the entire trade.
Optional Risk:Reward Take-Profit
Enabled/disabled using a toggle switch.
When enabled:
Long TP = Entry + (Risk × Risk:Reward Ratio)
Short TP = Entry – (Risk × Risk:Reward Ratio)
When disabled:
Exits are handled by reverse crossover signals.
Exit Conditions
Long Exit
Stop-Loss Hit (touch-based)
Take-Profit Hit (if enabled)
Reverse Band Crossover (if TP disabled)
Short Exit
Stop-Loss Hit (touch-based)
Take-Profit Hit (if enabled)
Reverse Band Crossover (if TP disabled)
Exit markers and price labels are plotted automatically.
Visual Tools
To improve clarity:
Upper & Lower Band (blue, adjustable width)
Middle Line
Dynamic band fill (green/red/yellow)
SL & TP line plotting when in position
Entry/Exit markers
Price labels for all executed trades
These are built to help users visually follow the strategy logic.
Alerts Included
Every trading event is covered:
Long Entry
Short Entry
Long SL / TP / Cross Exit
Short SL / TP / Cross Exit
Combined Alert for webhook/automation (JSON-formatted)
Perfect for algo trading, Discord bots, or automation platforms.
Best For
This strategy performs best in:
Trending markets
Breakout environments
High-momentum instruments
Clean intraday swings
Works seamlessly on:
Stocks
Index futures
Commodities
Crypto
Forex
⚠️ Important Disclaimer
This script is for educational purposes only.
Trading involves risk. Backtest results are not indicative of future performance.
Always validate settings and use proper position sizing.
