Trend Signals with TP & SL [UAlgo] StrategyThe "Trend Signals with TP & SL Strategy" is a trading strategy designed to capture trend continuation signals while incorporating sophisticated risk management techniques. This strategy is tailored for traders who wish to capitalize on trending market conditions with precise entry and exit points, automatically calculating Take Profit (TP) and Stop Loss (SL) levels based on either Average True Range (ATR) or percentage values. The strategy aims to enhance trade management by preventing multiple simultaneous positions and dynamically adapting to changing market conditions.
This strategy is highly configurable, allowing traders to adjust sensitivity, the ATR calculation method, and the cloud moving average length. Additionally, the strategy can display buy and sell signals directly on the chart, along with visual representation of entry points, stop losses, and take profits. It also features a cloud-based trend analysis using a MACD-driven color fill that indicates the strength and direction of the trend.
🔶 Key Features
Configurable Trend Continuation Signals:
Source Selection: The strategy uses the midpoint of the high-low range as the default source, but it is adjustable.
Sensitivity: The sensitivity of the trend signals can be adjusted using a multiplier, ranging from 0.5 to 5.
ATR Calculation: The strategy allows users to choose between two ATR calculation methods for better adaptability to different market conditions.
Cloud Moving Average: Traders can adjust the cloud moving average length, which is used in conjunction with MACD to provide a visual trend indication.
Take Profit & Stop Loss Management:
ATR-Based or Percent-Based: The strategy offers flexibility in setting TP and SL levels, allowing traders to choose between ATR-based multipliers or fixed percentage values.
Dynamic Adjustment: TP and SL levels are dynamically adjusted according to the selected method, ensuring trades are managed based on real-time market conditions.
Prevention of Multiple Positions:
Single Position Control: To reduce risk and enhance strategy reliability, the strategy includes an option to prevent multiple positions from being opened simultaneously.
Visual Trade Indicators:
Buy/Sell Signals: Clearly displays buy and sell signals on the chart for easy interpretation.
Entry, SL, and TP Lines: Draws lines for entry price, stop loss, and take profit directly on the chart, helping traders to monitor trades visually.
Trend Cloud: A color-filled cloud based on MACD and the cloud moving average provides a visual cue of the trend’s direction and strength.
Performance Summary Table:
In-Chart Statistics: A table in the top right of the chart displays key performance metrics, including total trades, wins, losses, and win rate percentage, offering a quick overview of the strategy’s effectiveness.
🔶 Interpreting the Indicator
Trend Signals: The strategy identifies trend continuation signals based on price action relative to an ATR-based threshold. A buy signal is generated when the price crosses above a key level, indicating an uptrend. Conversely, a sell signal occurs when the price crosses below a level, signaling a downtrend.
Cloud Visualization: The cloud, derived from MACD and moving averages, changes color to reflect the current trend. A positive cloud in aqua suggests an uptrend, while a red cloud indicates a downtrend. The transparency of the cloud offers further nuance, with more solid colors denoting stronger trends.
Entry and Exit Management: Once a trend signal is generated, the strategy automatically sets TP and SL levels based on your chosen method (ATR or percentage). The stop loss and take profit lines will appear on the chart, showing where the strategy will exit the trade. If the price reaches either the SL or TP, the trade is closed, and the respective line is deleted from the chart.
Performance Metrics: The strategy’s performance is tracked in real-time with an in-chart table. This table provides essential information about the number of trades executed, the win/loss ratio, and the overall win rate. This information helps traders assess the strategy's effectiveness and make necessary adjustments.
This strategy is designed for those who seek to engage with trending markets, offering robust tools for entry, exit, and overall trade management. By understanding and leveraging these features, traders can potentially improve their trading outcomes and risk management.
🔷 Related Script
🔶 Disclaimer
Use with Caution: This indicator is provided for educational and informational purposes only and should not be considered as financial advice. Users should exercise caution and perform their own analysis before making trading decisions based on the indicator's signals.
Not Financial Advice: The information provided by this indicator does not constitute financial advice, and the creator (UAlgo) shall not be held responsible for any trading losses incurred as a result of using this indicator.
Backtesting Recommended: Traders are encouraged to backtest the indicator thoroughly on historical data before using it in live trading to assess its performance and suitability for their trading strategies.
Risk Management: Trading involves inherent risks, and users should implement proper risk management strategies, including but not limited to stop-loss orders and position sizing, to mitigate potential losses.
No Guarantees: The accuracy and reliability of the indicator's signals cannot be guaranteed, as they are based on historical price data and past performance may not be indicative of future results.
Trend Analizi

Vix Trading System (VTS)Introduction
The Vix Trading System (VTS) is an algorithm designed specifically for trading the VIX index CFD. The system combines price action and trend analysis to identify optimal entry and exit points for trades. The system is designed to maintain a single position at any given time, ensuring focused and controlled trading activity.
The VIX
The VIX, also known as the "Fear Index," is a popular measure of market volatility. It reflects the market's expectations for volatility over the coming 30 days and is often used as a gauge of investor sentiment. The VIX index is not directly tradable, but there are various financial vehicles, such as VIX futures, options, and CFDs, that allow traders to capitalise on its movements. This strategy is designed to trade the VIX index CFD, a derivative product available through brokers like Capital (used in this backtest). CFDs allow traders to speculate on the price movements of the VIX without owning the underlying asset, offering the potential for profit in both rising and falling markets. The VTS is tailored to leverage the unique characteristics of the VIX, providing traders with a structured approach to navigating the often volatile and unpredictable nature of this index.
Design
The Vix Trading System employs a balanced approach with six long strategies and one short strategy. The long strategies are designed to capitalise on price action patterns that indicate potential price increases, while the short strategy focuses on patterns where the VIX is likely to decline.
While I cannot give you the exact patterns I used to protect my IP, I can give you an example of a price pattern.
Long Entry: close > close and high < low and close >= sma200
These price patterns occur regularly to be traded but not too often to prevent overtrading. By using the price patterns to gauge price action, while using the moving averages to gauge the trend, the system is able to find entry and exit conditions for trading. This blend of price action and trend analysis ensures that the system is robust and adaptable, capable of responding to both short-term fluctuations and longer-term trends in the VIX.
How to Use It
The Vix Trading System is designed with notifications coded into all orders. Traders should set up alerts to notify them of long and short entries, as well as for take profit and stop loss orders for risk management and control. Since the strategy only holds one position at a time, traders can enter trades as soon as an alert is received. This system allows for efficient and timely execution, reducing the need for constant market monitoring.
Backtest
The backtest results for the Vix Trading System provide a valuable guide but should not be taken as a guarantee of future performance. To ensure realistic expectations, a starting capital of $200 was used, which produced a net profit of $18,000 over twelve years. The backtest included a commission of 1.05% of the order size and slippage of 3 ticks to model transaction costs. While these results are encouraging, traders should be aware that real-world trading conditions may differ, and ongoing risk management is essential.

Breadth Thrust Strategy with Volatility Stop-LossThe "Breadth Thrust Strategy with Volatility Stop-Loss" is a trading strategy designed to capitalize on market momentum while managing risk through volatility-based stop-losses. Here's a detailed breakdown of the strategy:
Strategy Overview:
Market Breadth Analysis: The strategy uses the "Breadth Thrust Indicator," which evaluates market momentum by calculating the ratio of advancing stocks to the total number of stocks on the New York Stock Exchange (NYSE). This indicator helps identify bullish market conditions. An optional feature allows for the inclusion of volume data in this calculation, enhancing the signal's robustness.
Signal Generation: A long position is triggered when the smoothed breadth ratio (or the combined breadth and volume ratio) crosses above a specified low threshold (e.g., 0.4). This crossover indicates a potential shift towards positive market momentum.
Key Parameters:
Smoothing Length (length): Defines the period over which the breadth or combined ratio is smoothed using a simple moving average (SMA) to reduce noise and highlight the underlying trend.
Low Threshold (threshold_low): The level below which the smoothed ratio must fall before crossing back above to trigger a long signal.
Hold Periods (hold_periods): The minimum number of periods for which the position will be held once entered, ensuring the strategy captures a meaningful move.
Volatility Multiplier (volatility_multiplier): A multiplier applied to the Average True Range (ATR) to determine the distance of the stop-loss from the entry price, which adjusts according to market volatility.
Trade Management:
Entry Signal: The strategy enters a long position when the smoothed combined ratio crosses above the low threshold, signaling a potential bullish reversal.
ATR-Based Stop-Loss: Upon entering a trade, the strategy calculates a stop-loss level based on the ATR, which measures market volatility. The stop-loss is set at a distance from the entry price, determined by multiplying the ATR by the specified volatility multiplier. This adaptive stop-loss mechanism helps protect the position from adverse market moves.
Stop-Loss Adjustment: While the position is open, the stop-loss level is dynamically updated, ensuring it never decreases (trailing stop-loss effect) but can be adjusted upwards to reflect the latest price action relative to volatility.
Position Closure: The position is closed if:
The market price falls to or below the stop-loss level.
The position has been held for the specified number of periods (hold_periods), after which it is automatically closed.
Additional Settings:
Initial Capital: The strategy starts with an initial capital of $10,000.
Commissions and Slippage: Each trade incurs a commission of $5 per order, and slippage is accounted for at $1 per trade.
Background Highlighting: The chart background turns green when a position is open, providing a clear visual indication of the active trade.
This strategy is designed to identify and capitalize on upward momentum in the market while employing a volatility-adjusted stop-loss to manage risk. By combining market breadth analysis with volatility-based stop-losses, the strategy aims to balance profit potential with protection against sudden market reversals.

Multi-Step FlexiSuperTrend - Strategy [presentTrading]At the heart of this endeavor is a passion for continuous improvement in the art of trading
█ Introduction and How it is Different
The "Multi-Step FlexiSuperTrend - Strategy " is an advanced trading strategy that integrates the well-known SuperTrend indicator with a nuanced and dynamic approach to market trend analysis. Unlike conventional SuperTrend strategies that rely on static thresholds and fixed parameters, this strategy introduces multi-step take profit mechanisms that allow traders to capitalize on varying market conditions in a more controlled and systematic manner.
What sets this strategy apart is its ability to dynamically adjust to market volatility through the use of an incremental factor applied to the SuperTrend calculation. This adjustment ensures that the strategy remains responsive to both minor and major market shifts, providing a more accurate signal for entries and exits. Additionally, the integration of multi-step take profit levels offers traders the flexibility to scale out of positions, locking in profits progressively as the market moves in their favor.
BTC 6hr Long/Short Performance
█ Strategy, How it Works: Detailed Explanation
The Multi-Step FlexiSuperTrend strategy operates on the foundation of the SuperTrend indicator, but with several enhancements that make it more adaptable to varying market conditions. The key components of this strategy include the SuperTrend Polyfactor Oscillator, a dynamic normalization process, and multi-step take profit levels.
🔶 SuperTrend Polyfactor Oscillator
The SuperTrend Polyfactor Oscillator is the heart of this strategy. It is calculated by applying a series of SuperTrend calculations with varying factors, starting from a defined "Starting Factor" and incrementing by a specified "Increment Factor." The indicator length and the chosen price source (e.g., HLC3, HL2) are inputs to the oscillator.
The SuperTrend formula typically calculates an upper and lower band based on the average true range (ATR) and a multiplier (the factor). These bands determine the trend direction. In the FlexiSuperTrend strategy, the oscillator is enhanced by iteratively applying the SuperTrend calculation across different factors. The iterative process allows the strategy to capture both minor and significant trend changes.
For each iteration (indexed by `i`), the following calculations are performed:
1. ATR Calculation: The Average True Range (ATR) is calculated over the specified `indicatorLength`:
ATR_i = ATR(indicatorLength)
2. Upper and Lower Bands Calculation: The upper and lower bands are calculated using the ATR and the current factor:
Upper Band_i = hl2 + (ATR_i * Factor_i)
Lower Band_i = hl2 - (ATR_i * Factor_i)
Here, `Factor_i` starts from `startingFactor` and is incremented by `incrementFactor` in each iteration.
3. Trend Determination: The trend is determined by comparing the indicator source with the upper and lower bands:
Trend_i = 1 (uptrend) if IndicatorSource > Upper Band_i
Trend_i = 0 (downtrend) if IndicatorSource < Lower Band_i
Otherwise, the trend remains unchanged from the previous value.
4. Output Calculation: The output of each iteration is determined based on the trend:
Output_i = Lower Band_i if Trend_i = 1
Output_i = Upper Band_i if Trend_i = 0
This process is repeated for each iteration (from 0 to 19), creating a series of outputs that reflect different levels of trend sensitivity.
Local
🔶 Normalization Process
To make the oscillator values comparable across different market conditions, the deviations between the indicator source and the SuperTrend outputs are normalized. The normalization method can be one of the following:
1. Max-Min Normalization: The deviations are normalized based on the range of the deviations:
Normalized Value_i = (Deviation_i - Min Deviation) / (Max Deviation - Min Deviation)
2. Absolute Sum Normalization: The deviations are normalized based on the sum of absolute deviations:
Normalized Value_i = Deviation_i / Sum of Absolute Deviations
This normalization ensures that the oscillator values are within a consistent range, facilitating more reliable trend analysis.
For more details:
🔶 Multi-Step Take Profit Mechanism
One of the unique features of this strategy is the multi-step take profit mechanism. This allows traders to lock in profits at multiple levels as the market moves in their favor. The strategy uses three take profit levels, each defined as a percentage increase (for long trades) or decrease (for short trades) from the entry price.
1. First Take Profit Level: Calculated as a percentage increase/decrease from the entry price:
TP_Level1 = Entry Price * (1 + tp_level1 / 100) for long trades
TP_Level1 = Entry Price * (1 - tp_level1 / 100) for short trades
The strategy exits a portion of the position (defined by `tp_percent1`) when this level is reached.
2. Second Take Profit Level: Similar to the first level, but with a higher percentage:
TP_Level2 = Entry Price * (1 + tp_level2 / 100) for long trades
TP_Level2 = Entry Price * (1 - tp_level2 / 100) for short trades
The strategy exits another portion of the position (`tp_percent2`) at this level.
3. Third Take Profit Level: The final take profit level:
TP_Level3 = Entry Price * (1 + tp_level3 / 100) for long trades
TP_Level3 = Entry Price * (1 - tp_level3 / 100) for short trades
The remaining portion of the position (`tp_percent3`) is exited at this level.
This multi-step approach provides a balance between securing profits and allowing the remaining position to benefit from continued favorable market movement.
█ Trade Direction
The strategy allows traders to specify the trade direction through the `tradeDirection` input. The options are:
1. Both: The strategy will take both long and short positions based on the entry signals.
2. Long: The strategy will only take long positions.
3. Short: The strategy will only take short positions.
This flexibility enables traders to tailor the strategy to their market outlook or current trend analysis.
█ Usage
To use the Multi-Step FlexiSuperTrend strategy, traders need to set the input parameters according to their trading style and market conditions. The strategy is designed for versatility, allowing for various market environments, including trending and ranging markets.
Traders can also adjust the multi-step take profit levels and percentages to match their risk management and profit-taking preferences. For example, in highly volatile markets, traders might set wider take profit levels with smaller percentages at each level to capture larger price movements.
The normalization method and the incremental factor can be fine-tuned to adjust the sensitivity of the SuperTrend Polyfactor Oscillator, making the strategy more responsive to minor market shifts or more focused on significant trends.
█ Default Settings
The default settings of the strategy are carefully chosen to provide a balanced approach between risk management and profit potential. Here is a breakdown of the default settings and their effects on performance:
1. Indicator Length (10): This parameter controls the lookback period for the ATR calculation. A shorter length makes the strategy more sensitive to recent price movements, potentially generating more signals. A longer length smooths out the ATR, reducing sensitivity but filtering out noise.
2. Starting Factor (0.618): This is the initial multiplier used in the SuperTrend calculation. A lower starting factor makes the SuperTrend bands closer to the price, generating more frequent trend changes. A higher starting factor places the bands further away, filtering out minor fluctuations.
3. Increment Factor (0.382): This parameter controls how much the factor increases with each iteration of the SuperTrend calculation. A smaller increment factor results in more gradual changes in sensitivity, while a larger increment factor creates a wider range of sensitivity across the iterations.
4. Normalization Method (None): The default is no normalization, meaning the raw deviations are used. Normalization methods like Max-Min or Absolute Sum can make the deviations more consistent across different market conditions, improving the reliability of the oscillator.
5. Take Profit Levels (2%, 8%, 18%): These levels define the thresholds for exiting portions of the position. Lower levels (e.g., 2%) capture smaller profits quickly, while higher levels (e.g., 18%) allow positions to run longer for more significant gains.
6. Take Profit Percentages (30%, 20%, 15%): These percentages determine how much of the position is exited at each take profit level. A higher percentage at the first level locks in more profit early, reducing exposure to market reversals. Lower percentages at higher levels allow for a portion of the position to benefit from extended trends.

Fibonacci-Only StrategyFibonacci-Only Strategy
This script is a custom trading strategy designed for traders who leverage Fibonacci retracement levels to identify potential trade entries and exits. The strategy is versatile, allowing users to trade across multiple timeframes, with built-in options for dynamic stop loss, trailing stops, and take profit levels.
Key Features:
Custom Fibonacci Levels:
This strategy calculates three specific Fibonacci retracement levels: 19%, 82.56%, and the reverse 19% level. These levels are used to identify potential areas of support and resistance where price reversals or breaks might occur.
The Fibonacci levels are calculated based on the highest and lowest prices within a 100-bar period, making them dynamic and responsive to recent market conditions.
Dynamic Entry Conditions:
Touch Entry: The script enters long or short positions when the price touches specific Fibonacci levels and confirms the move with a bullish (for long) or bearish (for short) candle.
Break Entry (Optional): If the "Use Break Strategy" option is enabled, the script can also enter positions when the price breaks through Fibonacci levels, providing more aggressive entry opportunities.
Stop Loss Management:
The script offers flexible stop loss settings. Users can choose between a fixed percentage stop loss or an ATR-based stop loss, which adjusts based on market volatility.
The ATR (Average True Range) stop loss is multiplied by a user-defined factor, allowing for tailored risk management based on market conditions.
Trailing Stop Mechanism:
The script includes an optional trailing stop feature, which adjusts the stop loss level as the market moves in favor of the trade. This helps lock in profits while allowing the trade to run if the trend continues.
The trailing stop is calculated as a percentage of the difference between the entry price and the current market price.
Multiple Take Profit Levels:
The strategy calculates seven take profit levels, each at incremental percentages above (for long trades) or below (for short trades) the entry price. This allows for gradual profit-taking as the market moves in the trade's favor.
Each take profit level can be customized in terms of the percentage of the position to be closed, providing precise control over exit strategies.
Strategy Backtesting and Results:
Realistic Backtesting:
The script has been backtested with realistic account sizes, commission rates, and slippage settings to ensure that the results are applicable to actual trading scenarios.
The backtesting covers various timeframes and markets to ensure the strategy's robustness across different trading environments.
Default Settings:
The script is published with default settings that have been optimized for general use. These settings include a 15-minute timeframe, a 1.0% stop loss, a 2.0 ATR multiplier for stop loss, and a 1.5% trailing stop.
Users can adjust these settings to better fit their specific trading style or the market they are trading.
How It Works:
Long Entry Conditions:
The strategy enters a long position when the price touches the 19% Fibonacci level (from high to low) or the reverse 19% level (from low to high) and confirms the move with a bullish candle.
If the "Use Break Strategy" option is enabled, the script will also enter a long position when the price breaks below the 19% Fibonacci level and then moves back up, confirming the break with a bullish candle.
Short Entry Conditions:
The strategy enters a short position when the price touches the 82.56% Fibonacci level and confirms the move with a bearish candle.
If the "Use Break Strategy" option is enabled, the script will also enter a short position when the price breaks above the 82.56% Fibonacci level and then moves back down, confirming the break with a bearish candle.
Stop Loss and Take Profit Logic:
The stop loss for each trade is calculated based on the selected method (fixed percentage or ATR-based). The strategy then manages the trade by either trailing the stop or taking profit at predefined levels.
The take profit levels are set at increments of 0.5% above or below the entry price, depending on whether the position is long or short. The script gradually exits the trade as these levels are hit, securing profits while minimizing risk.
Usage:
For Fibonacci Traders:
This script is ideal for traders who rely on Fibonacci retracement levels to find potential trade entries and exits. The script automates the process, allowing traders to focus on market analysis and decision-making.
For Trend and Swing Traders:
The strategy's flexibility in handling both touch and break entries makes it suitable for trend-following and swing trading strategies. The multiple take profit levels allow traders to capture profits in trending markets while managing risk.
Important Notes:
Originality: This script uniquely combines Fibonacci retracement levels with dynamic stop loss management and multiple take profit levels. It is not just a combination of existing indicators but a thoughtful integration designed to enhance trading performance.
Disclaimer: Trading involves risk, and it is crucial to test this script in a demo account or through backtesting before applying it to live trading. Users should ensure that the settings align with their individual risk tolerance and trading strategy.

Gann + Laplace Smoothed Hybrid Volume Spread AnalysisThe Gann + Laplace Smoothed Hybrid Volume Spread Analysis ( GannLSHVSA ) Strategy/Indicator is an trading tool designed to fuse volume analysis with trend detection, offering traders a view of market dynamics.
This Strategy/Indicator stands apart by integrating the principles of the upgraded Discrete Fourier Transform (DFT), the Laplace Stieltjes Transform and volume spread analysis, enhanced with a layer of Fourier smoothing to distill market noise and highlight trend directions with unprecedented clarity.
The length of EMA and Strategy Entries are modified with the Gann swings .
This smoothing process allows traders to discern the true underlying patterns in volume and price action, stripped of the distractions of short-term fluctuations and noise.
The core functionality of the GannLSHVSA revolves around the innovative combination of volume change analysis, spread determination (calculated from the open and close price difference), and the strategic use of the EMA (default 10) to fine-tune the analysis of spread by incorporating volume changes.
Trend direction is validated through a moving average (MA) of the histogram, which acts analogously to the Volume MA found in traditional volume indicators. This MA serves as a pivotal reference point, enabling traders to confidently engage with the market when the histogram's movement concurs with the trend direction, particularly when it crosses the Trend MA line, signalling optimal entry points.
It returns 0 when MA of the histogram and EMA of the Price Spread are not align.
WHAT IS GannLSHVSA INDICATOR:
The GannLSHVSA plots a positive trend when a positive Volume smoothed Spread and EMA of Volume smoothed price is above 0, and a negative when negative Volume smoothed Spread and EMA of Volume smoothed price is below 0. When this conditions are not met it plots 0.
HOW TO USE THE STRATEGY:
Here you fine-tune the inputs until you find a combination that works well on all Timeframes you will use when creating your Automated Trade Algorithmic Strategy. I suggest 4h, 12h, 1D, 2D, 3D, 4D, 5D, 6D, W and M.
ORIGINALITY & USEFULNESS:
The GannLSHVSA Strategy is unique because it applies upgraded DFT, the Laplace Stieltjes Transform for data smoothing, effectively filtering out the minor fluctuations and leaving traders with a clear picture of the market's true movements. The DFT's ability to break down market signals into constituent frequencies offers a granular view of market dynamics, highlighting the amplitude and phase of each frequency component. This, combined with the strategic application of Ehler's Universal Oscillator principles via a histogram, furnishes traders with a nuanced understanding of market volatility and noise levels, thereby facilitating more informed trading decisions. The Gann swing strategy is developed by meomeo105, this Gann high and low algorithm forms the basis of the EMA modification.
DETAILED DESCRIPTION:
My detailed description of the indicator and use cases which I find very valuable.
What is the meaning of price spread?
In finance, a spread refers to the difference between two prices, rates, or yields. One of the most common types is the bid-ask spread, which refers to the gap between the bid (from buyers) and the ask (from sellers) prices of a security or asset.
We are going to use Open-Close spread.
What is Volume spread analysis?
Volume spread analysis (VSA) is a method of technical analysis that compares the volume per candle, range spread, and closing price to determine price direction.
What does this mean?
We need to have a positive Volume Price Spread and a positive Moving average of Volume price spread for a positive trend. OR via versa a negative Volume Price Spread and a negative Moving average of Volume price spread for a negative trend.
What if we have a positive Volume Price Spread and a negative Moving average of Volume Price Spread?
It results in a neutral, not trending price action.
Thus the Indicator/Strategy returns 0 and Closes all long and short positions.
I suggest using "Close all" input False when fine-tuning Inputs for 1 TimeFrame. When you export data to Excel/Numbers/GSheets I suggest using "Close all" input as True, except for the lowest TimeFrame. I suggest using 100% equity as your default quantity for fine-tune purposes. I have to mention that 100% equity may lead to unrealistic backtesting results. Be avare. When backtesting for trading purposes use Contracts or USDT.

Fine-tune Inputs: Gann + Laplace Smooth Volume Zone OscillatorUse this Strategy to Fine-tune inputs for the GannLSVZ0 Indicator.
Strategy allows you to fine-tune the indicator for 1 TimeFrame at a time; cross Timeframe Input fine-tuning is done manually after exporting the chart data.
I suggest using "Close all" input False when fine-tuning Inputs for 1 TimeFrame. When you export data to Excel/Numbers/GSheets I suggest using "Close all" input as True, except for the lowest TimeFrame.
MEANINGFUL DESCRIPTION:
The Volume Zone oscillator breaks up volume activity into positive and negative categories. It is positive when the current closing price is greater than the prior closing price and negative when it's lower than the prior closing price. The resulting curve plots through relative percentage levels that yield a series of buy and sell signals, depending on level and indicator direction.
The Gann Laplace Smoothed Volume Zone Oscillator GannLSVZO is a refined version of the Volume Zone Oscillator, enhanced by the implementation of the upgraded Discrete Fourier Transform, the Laplace Stieltjes Transform. Its primary function is to streamline price data and diminish market noise, thus offering a clearer and more precise reflection of price trends.
By combining the Laplace with Gann Swing Entries and with Ehler's white noise histogram, users gain a comprehensive perspective on volume-related market conditions.
HOW TO USE THE INDICATOR:
The default period is 2 but can be adjusted after backtesting. (I suggest 5 VZO length and NoiceR max length 8 as-well)
The VZO points to a positive trend when it is rising above the 0% level, and a negative trend when it is falling below the 0% level. 0% level can be adjusted in setting by adjusting VzoDifference. Oscillations rising below 0% level or falling above 0% level result in a natural trend.
HOW TO USE THE STRATEGY:
Here you fine-tune the inputs until you find a combination that works well on all Timeframes you will use when creating your Automated Trade Algorithmic Strategy. I suggest 4h, 12h, 1D, 2D, 3D, 4D, 5D, 6D, W and M.
When Indicator/Strategy returns 0 or natural trend, Strategy Closes All it's positions.
ORIGINALITY & USFULLNESS:
Personal combination of Gann swings and Laplace Stieltjes Transform of a price which results in less noise Volume Zone Oscillator.
The Laplace Stieltjes Transform is a mathematical technique that transforms discrete data from the time domain into its corresponding representation in the frequency domain. This process involves breaking down a signal into its individual frequency components, thereby exposing the amplitude and phase characteristics inherent in each frequency element.
This indicator utilizes the concept of Ehler's Universal Oscillator and displays a histogram, offering critical insights into the prevailing levels of market noise. The Ehler's Universal Oscillator is grounded in a statistical model that captures the erratic and unpredictable nature of market movements. Through the application of this principle, the histogram aids traders in pinpointing times when market volatility is either rising or subsiding.
The Gann swing strategy is developed by meomeo105, this Gann high and low algorithm forms the basis of the EMA modification.
DETAILED DESCRIPTION:
My detailed description of the indicator and use cases which I find very valuable.
What is oscillator?
Oscillators are chart indicators that can assist a trader in determining overbought or oversold conditions in ranging (non-trending) markets.
What is volume zone oscillator?
Price Zone Oscillator measures if the most recent closing price is above or below the preceding closing price.
Volume Zone Oscillator is Volume multiplied by the 1 or -1 depending on the difference of the preceding 2 close prices and smoothed with Exponential moving Average.
What does this mean?
If the VZO is above 0 and VZO is rising. We have a bullish trend. Most likely.
If the VZO is below 0 and VZO is falling. We have a bearish trend. Most likely.
Rising means that VZO on close is higher than the previous day.
Falling means that VZO on close is lower than the previous day.
What if VZO is falling above 0 line?
It means we have a high probability of a bearish trend.
Thus the indicator returns 0 and Strategy closes all it's positions when falling above 0 (or rising bellow 0) and we combine higher and lower timeframes to gauge the trend.
What is approximation and smoothing?
They are mathematical concepts for making a discrete set of numbers a
continuous curved line.
Laplace Stieltjes Transform approximation of a close price are taken from aprox library.
Key Features:
You can tailor the Indicator/Strategy to your preferences with adjustable parameters such as VZO length, noise reduction settings, and smoothing length.
Volume Zone Oscillator (VZO) shows market sentiment with the VZO, enhanced with Exponential Moving Average (EMA) smoothing for clearer trend identification.
Noise Reduction leverages Euler's White noise capabilities for effective noise reduction in the VZO, providing a cleaner and more accurate representation of market dynamics.
Choose between the traditional Fast Laplace Stieltjes Transform (FLT) and the innovative Double Discrete Fourier Transform (DTF32) soothed price series to suit your analytical needs.
Use dynamic calculation of Laplace coefficient or the static one. You may modify those inputs and Strategy entries with Gann swings.
I suggest using "Close all" input False when fine-tuning Inputs for 1 TimeFrame. When you export data to Excel/Numbers/GSheets I suggest using "Close all" input as True, except for the lowest TimeFrame. I suggest using 100% equity as your default quantity for fine-tune purposes. I have to mention that 100% equity may lead to unrealistic backtesting results. Be avare. When backtesting for trading purposes use Contracts or USDT.

Multi-Step Vegas SuperTrend - strategy [presentTrading]Long time no see! I am back : ) Please allow me to gain some warm-up.
█ Introduction and How it is Different
The "Vegas SuperTrend Strategy" is an enhanced trading strategy that leverages both the Vegas Channel and SuperTrend indicators to generate buy and sell signals.
What sets this strategy apart from others is its dynamic adjustment to market volatility and its multi-step take profit mechanism. Unlike traditional single-step profit-taking approaches, this strategy allows traders to systematically scale out of positions at predefined profit levels, thereby optimizing their risk-reward ratio and maximizing potential gains.
BTCUSD 6hr performance
█ Strategy, How it Works: Detailed Explanation
The Vegas SuperTrend Strategy combines the strengths of the Vegas Channel and SuperTrend indicators to identify market trends and generate trade signals. The following subsections delve into the details of how each component works and how they are integrated.
🔶 Vegas Channel Calculation
The Vegas Channel is based on a simple moving average (SMA) and the standard deviation (STD) of the closing prices over a specified period. The channel is defined by upper and lower bounds that are dynamically adjusted based on market volatility.
Simple Moving Average (SMA):
SMA_vegas = (1/N) * Σ(Close_i) for i = 0 to N-1
where N is the length of the Vegas Window.
Standard Deviation (STD):
STD_vegas = sqrt((1/N) * Σ(Close_i - SMA_vegas)^2) for i = 0 to N-1
Vegas Channel Upper and Lower Bounds:
VegasChannelUpper = SMA_vegas + STD_vegas
VegasChannelLower = SMA_vegas - STD_vegas
The details are here:
🔶 Trend Detection and Trade Signals
The strategy determines the current market trend based on the closing price relative to the SuperTrend bounds:
Market Trend:
MarketTrend = 1 if Close > SuperTrendPrevLower
-1 if Close < SuperTrendPrevUpper
Previous Trend otherwise
Trade signals are generated when there is a shift in the market trend:
Bullish Signal: When the market trend shifts from -1 to 1.
Bearish Signal: When the market trend shifts from 1 to -1.
🔶 Multi-Step Take Profit Mechanism
The strategy incorporates a multi-step take profit mechanism that allows for partial exits at predefined profit levels. This helps in locking in profits gradually and reducing exposure to market reversals.
Take Profit Levels:
The take profit levels are calculated as percentages of the entry price:
TakeProfitLevel_i = EntryPrice * (1 + TakeProfitPercent_i/100) for long positions
TakeProfitLevel_i = EntryPrice * (1 - TakeProfitPercent_i/100) for short positions
Multi-steps take profit local picture:
█ Trade Direction
The trade direction can be customized based on the user's preference:
Long: The strategy only takes long positions.
Short: The strategy only takes short positions.
Both: The strategy can take both long and short positions based on the market trend.
█ Usage
To use the Vegas SuperTrend Strategy, follow these steps:
Configure Input Settings:
- Set the ATR period, Vegas Window length, SuperTrend Multiplier, and Volatility Adjustment Factor.
- Choose the desired trade direction (Long, Short, Both).
- Enable or disable the take profit mechanism and set the take profit percentages and amounts for each step.
█ Default Settings
The default settings of the strategy are designed to provide a balanced approach to trading. Below is an explanation of each setting and its effect on the strategy's performance:
ATR Period (10): This setting determines the length of the ATR used in the SuperTrend calculation. A longer period smoothens the ATR, making the SuperTrend less sensitive to short-term volatility. A shorter period makes the SuperTrend more responsive to recent price movements.
Vegas Window Length (100): This setting defines the period for the Vegas Channel's moving average. A longer window provides a broader view of the market trend, while a shorter window makes the channel more responsive to recent price changes.
SuperTrend Multiplier (5): This base multiplier adjusts the sensitivity of the SuperTrend to the ATR. A higher multiplier makes the SuperTrend less sensitive, reducing the frequency of trade signals. A lower multiplier increases sensitivity, generating more signals.
Volatility Adjustment Factor (5): This factor dynamically adjusts the SuperTrend multiplier based on the width of the Vegas Channel. A higher factor increases the sensitivity of the SuperTrend to changes in market volatility, while a lower factor reduces it.
Take Profit Percentages (3.0%, 6.0%, 12.0%, 21.0%): These settings define the profit levels at which portions of the trade are exited. They help in locking in profits progressively as the trade moves in favor.
Take Profit Amounts (25%, 20%, 10%, 15%): These settings determine the percentage of the position to exit at each take profit level. They are distributed to ensure that significant portions of the trade are closed as the price reaches the set levels, reducing exposure to reversals.
Adjusting these settings can significantly impact the strategy's performance. For instance, increasing the ATR period or the SuperTrend multiplier can reduce the number of trades, potentially improving the win rate but also missing out on some profitable opportunities. Conversely, lowering these values can increase trade frequency, capturing more short-term movements but also increasing the risk of false signals.

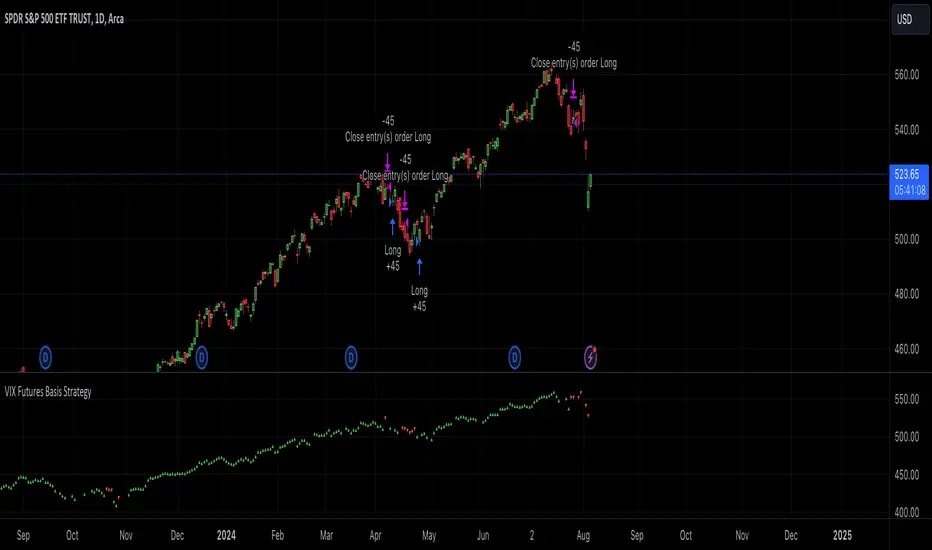
VIX Futures Basis StrategyVIX Futures Basis Strategy
The VIX Futures Basis Strategy is a trading approach that takes advantage of the unique characteristics of the VIX index and its futures market. The VIX, often referred to as the "fear index," measures market expectations of near-term volatility. This strategy focuses on how the VIX futures contracts behave in relation to the spot VIX index and seeks to capitalize on the market's contango and backwardation phases.
Key Concepts:
VIX Index and VIX Futures:
The VIX index reflects the market's expectation of volatility over the next 30 days.
VIX futures allow traders to speculate on the future value of the VIX index.
Contango and Backwardation:
Contango occurs when the futures price is higher than the spot price, often indicating that the market expects volatility to rise in the future.
Backwardation is when the futures price is lower than the spot price, suggesting that the market expects a decrease in volatility.
Basis:
The basis is the difference between the futures price and the spot price. This strategy examines the basis for two consecutive VIX futures contracts.
Strategy Overview:
The VIX Futures Basis Strategy uses the relationship between the VIX index and its futures contracts to generate trading signals:
Long Position on Contango:
When both the front month and the second month VIX futures contracts are in contango (their prices are above the spot VIX index by a specified threshold), the strategy takes a long position.
This implies an expectation that the market will move from a state of expected higher future volatility to a more stable state, allowing profits to be made as the futures prices converge toward the spot price.
Closing Position on Backwardation:
If the basis for both futures contracts indicates backwardation (their prices are below the spot VIX index by a threshold), the strategy closes any long positions.
This condition suggests that the market anticipates decreasing volatility, and closing positions helps to avoid potential losses.
Gann Swing Strategy [1 Bar - Multi Layer]Use this Strategy to Fine-tune inputs for your Gann swing strategy.
Strategy allows you to fine-tune the indicator for 1 TimeFrame at a time; cross Timeframe Input fine-tuning is done manually after exporting the chart data.
MEANINGFUL DESCRIPTION:
The Gann Swing Chart using the One-Bar type, also known as the Minor Trend Chart, is designed to follow single-bar movements in the market. It helps identify trends by tracking price movements. When the market makes a higher high than the previous bar from a low price, the One-Bar trend line moves up, indicating a new high and establishing the previous low as a One-Bar bottom. Conversely, when the market makes a lower low than the previous bar from a high price, the One-Bar swing line moves down, marking a new low and setting the previous high as a One-Bar top. The crossing of these swing tops and bottoms indicates a change in trend direction.
HOW TO USE THE INDICATOR / Gann-swing Strategy:
The indicator shows 1, 2, and 3-bar swings. The strategy triggers a buy when the price crosses the previously determined high.
HOW TO USE THE STRATEGY:
Strategy to Fine-Tune Inputs for Your Gann Swing Strategy
This strategy allows for the fine-tuning of indicators for one timeframe at a time. Cross-timeframe input fine-tuning is done manually after exporting the chart data.
Meaningful Description:
The Gann Swing Chart using the One-Bar type, also known as the Minor Trend Chart, is designed to follow single-bar movements in the market. It helps identify trends by tracking price movements. When the market makes a higher high than the previous bar from a low price, the One-Bar trend line moves up, indicating a new high and establishing the previous low as a One-Bar bottom. Conversely, when the market makes a lower low than the previous bar from a high price, the One-Bar swing line moves down, marking a new low and setting the previous high as a One-Bar top. The crossing of these swing tops and bottoms indicates a change in trend direction.
How to Use the Indicator / Gann-Swing Strategy:
The indicator shows 1, 2, and 3-bar swings. The strategy triggers a buy when the price crosses the previously determined high.
How to Use the Strategy:
The strategy initiates a buy if the price breaks 1, 2, or 3-bar highs, or any combination thereof. Use the inputs to determine which highs or lows need to be crossed for the strategy to go long or short.
ORIGINALITY & USEFULNESS:
The One-Bar Swing Chart stands out for its simplicity and effectiveness in capturing minor market trends. Developed by meomeo105, this Gann high and low algorithm forms the basis of the strategy. I used my approach to creating strategy out of Gann swing indicator.
DETAILED DESCRIPTION:
What is a Swing Chart?
Swing charts help traders visualize price movements and identify trends by focusing on price highs and lows. They are instrumental in spotting trend reversals and continuations.
What is the One-Bar Swing Chart?
The One-Bar Swing Chart, also known as the Minor Trend Chart, follows single-bar price movements. It plots upward swings from a low price when a higher high is made, and downward swings from a high price when a lower low is made.
Key Features:
Trend Identification : Highlights minor trends by plotting swing highs and lows based on one-bar movements.
Simple Interpretation : Crossing a swing top indicates an uptrend, while crossing a swing bottom signals a downtrend.
Customizable Periods : Users can adjust the period to fine-tune the sensitivity of the swing chart to market movements.
Practical Application:
Bullish Trend : When the One-Bar Swing line moves above a previous swing top, it indicates a bullish trend.
Bearish Trend : When the One-Bar Swing line moves below a previous swing bottom, it signals a bearish trend.
Trend Reversal : Watch for crossings of swing tops and bottoms to detect potential trend reversals.
The One-Bar Swing Chart is a powerful tool for traders looking to capture and understand market trends. By following the simple rules of swing highs and lows, it provides clear and actionable insights into market direction.
Why the Strategy Uses 100% Allocation of a Portfolio:
This strategy allocates 100% of the portfolio to trading this specific pair, which does not mean 100% of all capital but 100% of the allocated trading capital for this pair. The strategy is swing-based and does not use take profit (TP) or stop losses.

WODIsMA Strategy 3 MA Crossover & Bull-Bear Trend ConfirmationWODIsMA Strategy is a versatile trading strategy designed to leverage the strength of moving averages and volatility indicators to provide clear trading signals for both long and short positions. This strategy is suitable for traders looking for a systematic approach to trading with adjustable parameters to fit various market conditions and personal trading styles.
Key Features
Customizable Moving Averages:
The strategy allows users to select different types of moving averages (SMA, EMA, SMMA, WMA, VWMA) for short-term, mid-term, long-term, and bull-bear trend identification.
Each moving average can be customized with different lengths, sources (e.g., close, high, low), timeframes, and colors.
Position Management:
Users can specify the percentage of capital to use per trade and the percentage to close per partial exit.
The strategy supports both long and short positions with the ability to enable or disable each direction.
Volatility Filter:
Incorporates a volatility filter to ensure trades are only taken when market volatility is above a user-defined threshold, enhancing the strategy's effectiveness in dynamic market conditions.
Bull-Bear Trend Line:
Option to enable a bull-bear trend line that helps identify the overall market trend. Trades are taken based on the relationship between the long-term moving average and the bull-bear trend line.
Partial Exits and Full Close Logic:
The strategy includes logic for partial exits based on the crossing of mid-term and long-term moving averages.
Ensures that positions are fully closed when adverse conditions are detected, such as the price crossing below the bull-bear trend line.
Stop Loss Management:
Implements user-defined stop loss levels to manage risk effectively. The stop loss is dynamically adjusted based on the entry price and user input.
Detailed Description
Moving Average Calculation: The strategy calculates up to six different moving averages, each with customizable parameters. These moving averages help identify the short-term, mid-term, long-term trends, and overall market direction.
Trading Signals:
Long Signal: A long position is opened when the short-term moving average is above the long-term moving average, and the mid-term moving average crosses above the long-term moving average.
Short Signal: A short position is opened when the short-term moving average is below the long-term moving average, and the mid-term moving average crosses below the long-term moving average.
Volatility Condition: The strategy includes a volatility filter that activates trades only when volatility exceeds a specified threshold, ensuring trades are made in favorable market conditions.
Bull-Bear Trend Confirmation: When enabled, trades are filtered based on the relationship between the long-term moving average and the bull-bear trend line, adding another layer of confirmation.
Stop Loss and Exits:
The strategy manages risk by placing stop loss orders based on user-defined percentages.
Positions are partially or fully closed based on the crossing of moving averages and the relationship with the bull-bear trend line.
Originality and Usefulness
This strategy is original as it combines multiple moving averages and volatility indicators in a structured manner to provide reliable trading signals. Its versatility allows traders to adjust the parameters to match their trading preferences and market conditions. The inclusion of a volatility filter and bull-bear trend line adds significant value by reducing false signals and ensuring trades are taken in the direction of the overall market trend. The detailed descriptions and customizable settings make this strategy accessible and understandable for traders, even those unfamiliar with the underlying Pine Script code.
By providing clear entry, exit, and risk management rules, the WODIsMA Strategy enhances the trader's ability to navigate different market environments, making it a valuable addition to the TradingView community scripts.

Project Monday Strategy [AlgoAI System]Overview
Project Monday is a sophisticated trading strategy designed for active market participants. This strategy can be used alongside other forms of technical analysis, providing traders with additional tools to enhance their market insights. While it offers a flexible approach for identifying and exploiting market inefficiencies, Project Monday does not fit every market condition and requires adjustments. Its core principles include technical analysis and risk management, all aimed at making informed trading decisions and managing risk effectively.
Features
Project Monday Strategy works in any market and includes many features:
Efficient Trading Presets: Offers ready-to-use presets that allow traders to start efficient trading with one click.
Confirmation Signals: Provides signals to help traders validate trends, emphasizing informed decision-making (not to be followed blindly).
Reversal Signals: Identifies signals to alert traders to potential reversals, encouraging careful analysis (not to be followed blindly).
Adaptability: Can be adjusted to fit different market conditions, ensuring ongoing effectiveness.
Multi-Market Application: Suitable for use across various asset classes including stocks, forex, commodities, and cryptocurrencies.
Integration: Can be used alongside other technical analysis tools for enhanced decision-making.
Position Sizing: Allows traders to determine optimal trade size using backtesting and trading performance dashboard.
Backtesting: Supports historical testing to refine and validate the strategy.
Continuous Monitoring: Includes features for ongoing performance evaluation and strategy adjustments.
Unique Project Monday Strategy Features on TradingView:
Adaptive Position Sizing: Dynamically adjusts the size of each position based on market conditions and predefined risk management criteria, ensuring optimal trade sizing and risk exposure.
Preliminary Position Opening: Allows traders to enter a position in anticipation of a signal confirmation, enabling them to capture early market movements and improve entry points.
Preliminary Position Closing: Enables traders to exit a position before a signal reversal, helping to lock in profits and minimize potential losses during volatile market conditions.
Adjusting Strategy Parameters:
Price Band Inputs:
Project Monday Strategy uses a set of configurable inputs to tailor its behavior according to the trader's preferences. The following are the key inputs for the price band calculations. Signals are not generated when the price remains within these bands.
“Length of Calculation” determines how many historical data points are used in the trend calculation. A shorter “Length of Calculation” will make the Price Band more responsive to recent price changes but may also increase the noise and the likelihood of false signals. A longer “Length of Calculation” will make the Price Band smoother, with less noise, but may cause more lag in reacting to price changes.
“Offset” determines the position of the Gaussian filter, which is used to weight the data points in the trend calculation. The offset is expressed as a fraction of the “Length of Calculation”, with a value between 0 and 1. A higher “Offset” will shift the Gaussian filter closer to the more recent data points, making the Price Band more responsive to recent price changes but potentially increasing noise. A lower “Offset” will shift the Gaussian filter closer to the centre of the window, resulting in a smoother Price Band but potentially introducing more lag.
“Sigma” refers to the standard deviation used in the Gaussian distribution function. This parameter determines the smoothness of the curve and the degree to which data points close to the centre of the “Length of Calculation” are weighted more heavily than those further away. A smaller “Sigma” will result in a narrower Gaussian filter, leading to a more responsive Price Band but with a higher chance of noise and false signals. A larger “Sigma” will result in a wider Gaussian filter, creating a smoother Price Band but with more lag.
Adjust the “Source” inputs to specify which type of price data should be used for strategy calculations and signal generation.
“Width of Band” input determines the multiplier for the band width. A higher value of “Width of Band” makes the price band wider, which generates fewer signals due to the lower probability of the price moving outside the band. Conversely, a lower multiplier makes the band narrower, generating more signals but also increasing the likelihood of false signals.
Direction input:
The Project Monday strategy includes an input to specify the direction of trades, allowing traders to control whether the strategy should consider long positions, short positions, or both. The following input parameter is used for this purpose:
This input parameter allows traders to define the type of positions the strategy will take. It has three options:
Only Long: The strategy will generate signals exclusively for buying or closing short positions, focusing on potential uptrends.
Only Short: The strategy will generate signals exclusively for selling or closing long positions, focusing on potential downtrends.
Both: The strategy will generate signals for both buying (long positions) and selling (short positions), allowing for a more comprehensive trading approach that captures opportunities in both rising and falling markets.
Signals Filter:
The Project Monday strategy includes inputs to filter signals based on higher timeframes and the length of the data used for filtering. These inputs help traders refine the strategy's performance by considering broader market trends and smoothing out short-term fluctuations.
Filter Timeframe input specifies the timeframe used for filtering signals. By choosing a higher timeframe, traders can filter out noise from shorter timeframes and focus on more significant trends. The options range from intraday minutes (e.g., 1, 5, 15 minutes) to daily (1D, 2D, etc.), weekly (1W, 2W, etc.), and monthly (1M) timeframes. This allows traders to align their strategy with their preferred trading horizon and market perspective.
Filter Length input defines the number of data points used for filtering signals on the selected timeframe. A longer filter length will smooth out the data more, helping to identify sustained trends and reduce the impact of short-term fluctuations. Conversely, a shorter filter length will make the filter more responsive to recent price changes, potentially generating more signals but also increasing sensitivity to market noise.
Adaptive Position Size:
The Project Monday strategy incorporates inputs for unique feature Adaptive Position Sizing (APS), which dynamically adjusts the size of trades based on market conditions and specified parameters. This feature helps optimize risk management and trading performance.
Enable Adaptive Position Size: Users can check or uncheck this box to enable or disable the Adaptive Position Size feature. When checked, the strategy dynamically adjusts position sizes based on the defined parameters. This allows traders to scale their positions according to market volatility and other factors, enhancing risk management and potentially improving returns. When unchecked, the strategy will not adjust position sizes adaptively, and positions will remain fixed as per other settings.
“Timeframe for Adaptive Position Size “input specifies the timeframe used for calculating the position size. Options range from intraday minutes (e.g., 30, 60 minutes) to daily (1D, 3D), weekly (1W), and monthly (1M) timeframes. Selecting an appropriate timeframe helps align position sizing calculations with the trader’s overall strategy and market perspective, ensuring that position sizes are adjusted based on relevant market data.
“APS Length” input defines the number of data points used to calculate the adaptive position size. A longer APS length will result in higher position sizes. Conversely, a shorter APS length will result in smaller position sizes.
Anticipatory Trading:
Project Monday Strategy includes inputs for unique feature Anticipatory Trading, allowing traders to open and close positions preliminarily based on certain conditions. This feature aims to provide an edge by taking action before traditional signals confirm.
Enable Preliminary Position Opening: Users can check or uncheck this box to enable or disable Preliminary Position Opening. When enabled, the strategy will open positions based on preliminary conditions before the standard signals are confirmed. This can help traders capitalize on early trend movements and potentially gain a better entry point.
Enable Preliminary Position Closing: Users can check or uncheck this box to enable or disable Preliminary Position Closing. When enabled, the strategy will close positions based on preliminary conditions before the standard exit signals are confirmed. This can help traders lock in profits or limit losses by exiting positions at the early signs of trend reversals.
“Position Size in %” input specifies the position size as a percentage of the trading capital. By setting this value, traders can control the amount of capital allocated to each trade. For example, a risk value of 40% means that 40% of the available trading capital will be used for each anticipatory trade. This helps in managing risk and ensuring that the position size aligns with the trader's risk tolerance and overall strategy.
Usage:
Signal Generation
Long signal indicates a potential uptrend, suggesting either buying or closing a short position. Short signal indicates a potential downtrend, suggesting either selling or closing a long position. Signals are generated on your chart when the price moves beyond a calculated price band based on the current trend.
Signal Filtering
The strategy includes a filtering mechanism based on the current or another timeframe. Filtering works best with higher timeframes. This component calculates the trend on a higher timeframe and predicts the trend, ensuring trades on the current timeframe are only opened if they align with the higher timeframe trend. Setting the right filter timeframe is crucial for obtaining the best signals.
Position Direction
Users can choose the direction of positions to open via the settings box. Options include only long positions, only short positions, or both.
Adaptive Position Size (APS)
Users can enable the Adaptive Position Size feature to adjust position sizes based on trend strength. The strategy evaluates the strength of the current trend based on a higher timeframe. The stronger the trend, the larger the position size for opening a position.
Anticipatory Trading
Users can activate this unique feature to enhance trading decisions. The strategy assesses the likelihood of receiving a main signal. If the opportunity appears strong, it opens a partial position, as specified in the settings box. As the probability of the signal strengthens, the strategy gradually increases the position size.
Exit Strategy
The strategy exits positions based on receiving a reverse signal. Positions opened through “Anticipatory trading” are exited incrementally as each preliminary signal reverses.
By following these steps, traders can implement the strategy to navigate various market scenarios, manage risk, and adjust trading performance over time. Adjusting parameters and monitoring signals diligently are key to adapting the strategy to individual trading styles and market conditions.
You will get
By purchasing the Project Monday strategy, you not only gain access to a cutting-edge system but also receive ready-to-use presets designed to help you start trading immediately and achieve optimal results. Additionally, you benefit from comprehensive support and the option to request custom presets for your desired financial instruments through our dedicated support team, ensuring you have the tools and assistance needed for successful trading.
Risk Disclaimer
This information is not a personalized investment recommendation, and the financial instruments or transactions mentioned in it may not be appropriate for your financial situation, investment objective(s), risk tolerance, and/or expected return. AlgoAI shall not be liable for any losses incurred in the event of transactions or investments in financial instruments mentioned in this information.

Multi-Regression StrategyIntroducing the "Multi-Regression Strategy" (MRS) , an advanced technical analysis tool designed to provide flexible and robust market analysis across various financial instruments.
This strategy offers users the ability to select from multiple regression techniques and risk management measures, allowing for customized analysis tailored to specific market conditions and trading styles.
Core Components:
Regression Techniques:
Users can choose one of three regression methods:
1 - Linear Regression: Provides a straightforward trend line, suitable for steady markets.
2 - Ridge Regression: Offers a more stable trend estimation in volatile markets by introducing a regularization parameter (lambda).
3 - LOESS (Locally Estimated Scatterplot Smoothing): Adapts to non-linear trends, useful for complex market behaviors.
Each regression method calculates a trend line that serves as the basis for trading decisions.
Risk Management Measures:
The strategy includes nine different volatility and trend strength measures. Users select one to define the trading bands:
1 - ATR (Average True Range)
2 - Standard Deviation
3 - Bollinger Bands Width
4 - Keltner Channel Width
5 - Chaikin Volatility
6 - Historical Volatility
7 - Ulcer Index
8 - ATRP (ATR Percentage)
9 - KAMA Efficiency Ratio
The chosen measure determines the width of the bands around the regression line, adapting to market volatility.
How It Works:
Regression Calculation:
The selected regression method (Linear, Ridge, or LOESS) calculates the main trend line.
For Ridge Regression, users can adjust the lambda parameter for regularization.
LOESS allows customization of the point span, adaptiveness, and exponent for local weighting.
Risk Band Calculation:
The chosen risk measure is calculated and normalized.
A user-defined risk multiplier is applied to adjust the sensitivity.
Upper and lower bounds are created around the regression line based on this risk measure.
Trading Signals:
Long entries are triggered when the price crosses above the regression line.
Short entries occur when the price crosses below the regression line.
Optional stop-loss and take-profit mechanisms use the calculated risk bands.
Customization and Flexibility:
Users can switch between regression methods to adapt to different market trends (linear, regularized, or non-linear).
The choice of risk measure allows adaptation to various market volatility conditions.
Adjustable parameters (e.g., regression length, risk multiplier) enable fine-tuning of the strategy.
Unique Aspects:
Comprehensive Regression Options:
Unlike many indicators that rely on a single regression method, MRS offers three distinct techniques, each suitable for different market conditions.
Diverse Risk Measures: The strategy incorporates a wide range of volatility and trend strength measures, going beyond traditional indicators to provide a more nuanced view of market dynamics.
Unified Framework:
By combining advanced regression techniques with various risk measures, MRS offers a cohesive approach to trend identification and risk management.
Adaptability:
The strategy can be easily adjusted to suit different trading styles, timeframes, and market conditions through its various input options.
How to Use:
Select a regression method based on your analysis of the current market trend (linear, need for regularization, or non-linear).
Choose a risk measure that aligns with your trading style and the market's current volatility characteristics.
Adjust the length parameter to match your preferred timeframe for analysis.
Fine-tune the risk multiplier to set the desired sensitivity of the trading bands.
Optionally enable stop-loss and take-profit mechanisms using the calculated risk bands.
Monitor the regression line for potential trend changes and the risk bands for entry/exit signals.
By offering this level of customization within a unified framework, the Multi-Regression Strategy provides traders with a powerful tool for market analysis and trading decision support. It combines the robustness of regression analysis with the adaptability of various risk measures, allowing for a more comprehensive and flexible approach to technical trading.

TASC 2024.08 Volume Confirmation For A Trend System█ OVERVIEW
This script demonstrates the use of volume data to validate price movements based on the techniques Buff Pelz Dormeier discusses in his "Volume Confirmation For A Trend System" article from the August 2024 edition of TASC's Traders' Tips . It presents a trend-following system implementation that utilizes a combination of three indicators: the Average Directional Index (ADX), the Trend Thrust Indicator (TTI), and the Volume Price Confirmation Indicator (VPCI).
█ CONCEPTS
In his article, Buff Pelz Dormeier recounts his search for an optimal trend-following strategy enhanced with volume data, starting with a simple system combining the ADX , MACD , and OBV indicators. Even in these early tests, the author observed that the volume confirmation from OBV notably improved trading performance. Subsequently, the author replaced OBV with his VPCI, which considers the proportional weights of volume and price, to enhance the validation of trend momentum. Lastly, the author explored the inclusion of his TTI, a modified MACD that features volume-based enhancements, as a strategy component for improved trend-following performance.
According to the author's research, the ADX+TTI+VPCI system outperformed similar strategies he tested in the article, yielding significantly higher returns and enhanced perceived reliability. Because the system's design revolves around catching pronounced trends, it performs best with a portfolio of individual stocks. The author applies the system in the article by allocating 5% of the equity to long positions in S&P 500 components that meet the ADX+TTI+VPCI entry criteria (see the Calculations section below for details). He uses the proceeds from closing positions to enter new positions in other stocks meeting the screening criteria, holding any excess proceeds in cash.
█ CALCULATIONS
The TTI is similar to the MACD. Its calculation entails the following steps:
Calculate fast (short-term) and slow (long-term) volume-weighted moving averages (VWMAs).
Compute the volume multiple (VM) as the square of the ratio of the fast VWMA to the slow VWMA.
Adjust these averages by multiplying the fast VWMA by the VM and dividing the slow VWMA by the VM.
Calculate the difference between the adjusted VWMAs to determine the TTI value, and take the average of that series to determine the signal line value.
The VPCI utilizes differences and ratios between VWMAs and corresponding simple moving averages (SMAs) to provide an alternative volume-price confirmation tool. Its calculation is as follows:
Subtract the slow SMA from the VWMA of the same length to calculate the volume-price confirmation/contradiction (VPC) value.
Divide the fast VWMA by the corresponding fast SMA to determine the volume-price ratio (VPR).
Divide the short-term VWMA by the long-term VWMA to calculate the VM.
Compute the VPCI as the product of the VPC, VPR, and VM values.
The long entry criteria of the ADX+TTI+VPCI system are as follows:
The ADX is above 30.
The TTI crosses above its signal line.
The VPCI is above 0, confirming the trend.
Signals to close positions occur when the VPCI is below 0, indicating a contradiction .
NOTE: Unlike in the article, this script applies the ADX+TTI+VPCI system to one stock at a time , not a portfolio of S&P 500 constituents.
█ DISCLAIMER
This strategy script educates users on the trading system outlined by the TASC article. By default, it uses 10% of equity as the order size and a slippage amount of 5 ticks. Traders should adjust these settings and the commission amount when using this script.

AlgoBuilder [Mean-Reversion] | FractalystWhat's the strategy's purpose and functionality?
This strategy is designed for both traders and investors looking to rely and trade based on historical and backtested data using automation.
The main goal is to build profitable mean-reversion strategies that outperform the underlying asset in terms of returns while minimizing drawdown.
For example, as for a benchmark, if the S&P 500 (SPX) has achieved an estimated 10% annual return with a maximum drawdown of -57% over the past 20 years, using this strategy with different entry and exit techniques, users can potentially seek ways to achieve a higher Compound Annual Growth Rate (CAGR) while maintaining a lower maximum drawdown.
Although the strategy can be applied to all markets and timeframes, it is most effective on stocks, indices, future markets, cryptocurrencies, and commodities and JPY currency pairs given their trending behaviors.
In trending market conditions, the strategy employs a combination of moving averages and diverse entry models to identify and capitalize on upward market movements. It integrates market structure-based moving averages and bands mechanisms across different timeframes and provides exit techniques, including percentage-based and risk-reward (RR) based take profit levels.
Additionally, the strategy has also a feature that includes a built-in probability function for traders who want to implement probabilities right into their trading strategies.
Performance summary, weekly, and monthly tables enable quick visualization of performance metrics like net profit, maximum drawdown, profit factor, average trade, average risk-reward ratio (RR), and more.
This aids optimization to meet specific goals and risk tolerance levels effectively.
-----
How does the strategy perform for both investors and traders?
The strategy has two main modes, tailored for different market participants: Traders and Investors.
Trading:
1. Trading:
- Designed for traders looking to capitalize on bullish trending markets.
- Utilizes a percentage risk per trade to manage risk and optimize returns.
- Suitable for active trading with a focus on mean-reversion and risk per trade approach.
◓: Mode | %: Risk percentage per trade
3. Investing:
- Geared towards investors who aim to capitalize on bullish trending markets without using leverage while mitigating the asset's maximum drawdown.
- Utilizes pre-define percentage of the equity to buy, hold, and manage the asset.
- Focuses on long-term growth and capital appreciation by fully investing in the asset during bullish conditions.
- ◓: Mode | %: Risk not applied (In investing mode, the strategy uses 10% of equity to buy the asset)
-----
What's is FRMA? How does the triple bands work? What are the underlying calculations?
Middle Band (FRMA):
The middle band is the core of the FRMA system. It represents the Fractalyst Moving Average, calculated by identifying the most recent external swing highs and lows in the market structure.
By determining these external swing pivot points, which act as significant highs and lows within the market range, the FRMA provides a unique moving average that adapts to market structure changes.
Upper Band:
The upper band shows the average price of the most recent external swing highs.
External swing highs are identified as the highest points between pivot points in the market structure.
This band helps traders identify potential overbought conditions when prices approach or exceed this upper band.
Lower Band:
The lower band shows the average price of the most recent external swing lows.
External swing lows are identified as the lowest points between pivot points in the market structure.
The script utilizes this band to identify potential oversold conditions, triggering entry signals as prices approach or drop below the lower band.
Adjustments Based on User Inputs:
Users can adjust how the upper and lower bands are calculated based on their preferences:
Upper/Lower: This method calculates the average bands using the prices of external swing highs and lows identified in the market.
Percentage Deviation from FRMA: Alternatively, users can opt to calculate the bands based on a percentage deviation from the middle FRMA. This approach provides flexibility to adjust the width of the bands relative to market conditions and volatility.
-----
What's the purpose of using moving averages in this strategy? What are the underlying calculations?
Using moving averages is a widely-used technique to trade with the trend.
The main purpose of using moving averages in this strategy is to filter out bearish price action and to only take trades when the price is trading ABOVE specified moving averages.
The script uses different types of moving averages with user-adjustable timeframes and periods/lengths, allowing traders to try out different variations to maximize strategy performance and minimize drawdowns.
By applying these calculations, the strategy effectively identifies bullish trends and avoids market conditions that are not conducive to profitable trades.
The MA filter allows traders to choose whether they want a specific moving average above or below another one as their entry condition.
This comparison filter can be turned on (>) or off.
For example, you can set the filter so that MA#1 > MA#2, meaning the first moving average must be above the second one before the script looks for entry conditions. This adds an extra layer of trend confirmation, ensuring that trades are only taken in more favorable market conditions.
⍺: MA Period | Σ: MA Timeframe
-----
What entry modes are used in this strategy? What are the underlying calculations?
The strategy by default uses two different techniques for the entry criteria with user-adjustable left and right bars: Breakout and Fractal.
1. Breakout Entries :
- The strategy looks for pivot high points with a default period of 3.
- It stores the most recent high level in a variable.
- When the price crosses above this most recent level, the strategy checks if all conditions are met and the bar is closed before taking the buy entry.
◧: Pivot high left bars period | ◨: Pivot high right bars period
2. Fractal Entries :
- The strategy looks for pivot low points with a default period of 3.
- When a pivot low is detected, the strategy checks if all conditions are met and the bar is closed before taking the buy entry.
◧: Pivot low left bars period | ◨: Pivot low right bars period
2. Hunt Entries :
- The strategy identifies a candle that wicks through the lower FRMA band.
- It waits for the next candle to close above the low of the wick candle.
- When this condition is met and the bar is closed, the strategy takes the buy entry.
By utilizing these entry modes, the strategy aims to capitalize on bullish price movements while ensuring that the necessary conditions are met to validate the entry points.
-----
What type of stop-loss identification method are used in this strategy? What are the underlying calculations?
Initial Stop-Loss:
1. ATR Based:
The Average True Range (ATR) is a method used in technical analysis to measure volatility. It is not used to indicate the direction of price but to measure volatility, especially volatility caused by price gaps or limit moves.
Calculation:
- To calculate the ATR, the True Range (TR) first needs to be identified. The TR takes into account the most current period high/low range as well as the previous period close.
The True Range is the largest of the following:
- Current Period High minus Current Period Low
- Absolute Value of Current Period High minus Previous Period Close
- Absolute Value of Current Period Low minus Previous Period Close
- The ATR is then calculated as the moving average of the TR over a specified period. (The default period is 14).
Example - ATR (14) * 2
⍺: ATR period | Σ: ATR Multiplier
2. ADR Based:
The Average Day Range (ADR) is an indicator that measures the volatility of an asset by showing the average movement of the price between the high and the low over the last several days.
Calculation:
- To calculate the ADR for a particular day:
- Calculate the average of the high prices over a specified number of days.
- Calculate the average of the low prices over the same number of days.
- Find the difference between these average values.
- The default period for calculating the ADR is 14 days. A shorter period may introduce more noise, while a longer period may be slower to react to new market movements.
Example - ADR (20) * 2
⍺: ADR period | Σ: ADR Multiplier
3. PL Based:
This method places the stop-loss at the low of the previous candle.
If the current entry is based on the hunt entry strategy, the stop-loss will be placed at the low of the candle that wicks through the lower FRMA band.
Example:
If the previous candle's low is 100, then the stop-loss will be set at 100.
This method ensures the stop-loss is placed just below the most recent significant low, providing a logical and immediate level for risk management.
Application in Strategy (ATR/ADR):
- The strategy calculates the current bar's ADR/ATR with a user-defined period.
- It then multiplies the ADR/ATR by a user-defined multiplier to determine the initial stop-loss level.
By using these methods, the strategy dynamically adjusts the initial stop-loss based on market volatility, helping to protect against adverse price movements while allowing for enough room for trades to develop.
Each market behaves differently across various timeframes, and it is essential to test different parameters and optimizations to find out which trailing stop-loss method gives you the desired results and performance.
-----
What type of break-even and take profit identification methods are used in this strategy? What are the underlying calculations?
For Break-Even:
Percentage (%) Based:
Moves the initial stop-loss to the entry price when the price reaches a certain percentage above the entry.
Calculation:
Break-even level = Entry Price * (1 + Percentage / 100)
Example:
If the entry price is $100 and the break-even percentage is 5%, the break-even level is $100 * 1.05 = $105.
Risk-to-Reward (RR) Based:
Moves the initial stop-loss to the entry price when the price reaches a certain RR ratio.
Calculation:
Break-even level = Entry Price + (Initial Risk * RR Ratio)
Example:
If the entry price is $100, the initial risk is $10, and the RR ratio is 2, the break-even level is $100 + ($10 * 2) = $120.
FRMA Based:
Moves the stop-loss to break-even when the price hits the FRMA level at which the entry was taken.
Calculation:
Break-even level = FRMA level at the entry
Example:
If the FRMA level at entry is $102, the break-even level is set to $102 when the price reaches $102.
For TP1 (Take Profit 1):
- You can choose to set a take profit level at which your position gets fully closed or 50% if the TP2 boolean is enabled.
- Similar to break-even, you can select either a percentage (%) or risk-to-reward (RR) based take profit level, allowing you to set your TP1 level as a percentage amount above the entry price or based on RR.
For TP2 (Take Profit 2):
- You can choose to set a take profit level at which your position gets fully closed.
- As with break-even and TP1, you can select either a percentage (%) or risk-to-reward (RR) based take profit level, allowing you to set your TP2 level as a percentage amount above the entry price or based on RR.
When Both Percentage (%) Based and RR Based Take Profit Levels Are Off:
The script will adjust the take profit level to the higher FRMA band set within user inputs.
Calculation:
Take profit level = Higher FRMA band length/timeframe specified by the user.
This ensures that when neither percentage-based nor risk-to-reward-based take profit methods are enabled, the strategy defaults to using the higher FRMA band as the take profit level, providing a consistent and structured approach to profit-taking.
For TP1 and TP2, it's specifying the price levels at which the position is partially or fully closed based on the chosen method (percentage or RR) above the entry price.
These calculations are crucial for managing risk and optimizing profitability in the strategy.
⍺: BE/TP type (%/RR) | Σ: how many RR/% above the current price
-----
What's the ADR filter? What does it do? What are the underlying calculations?
The Average Day Range (ADR) measures the volatility of an asset by showing the average movement of the price between the high and the low over the last several days.
The period of the ADR filter used in this strategy is tied to the same period you've used for your initial stop-loss.
Users can define the minimum ADR they want to be met before the script looks for entry conditions.
ADR Bias Filter:
- Compares the current bar ADR with the ADR (Defined by user):
- If the current ADR is higher, it indicates that volatility has increased compared to ADR (DbU).(⬆)
- If the current ADR is lower, it indicates that volatility has decreased compared to ADR (DbU).(⬇)
Calculations:
1. Calculate ADR:
- Average the high prices over the specified period.
- Average the low prices over the same period.
- Find the difference between these average values in %.
2. Current ADR vs. ADR (DbU):
- Calculate the ADR for the current bar.
- Calculate the ADR (DbU).
- Compare the two values to determine if volatility has increased or decreased.
By using the ADR filter, the strategy ensures that trades are only taken in favorable market conditions where volatility meets the user's defined threshold, thus optimizing entry conditions and potentially improving the overall performance of the strategy.
>: Minimum required ADR for entry | %: Current ADR comparison to ADR of 14 days ago.
-----
What's the probability filter? What are the underlying calculations?
The probability filter is designed to enhance trade entries by using buyside liquidity and probability analysis to filter out unfavorable conditions.
This filter helps in identifying optimal entry points where the likelihood of a profitable trade is higher.
Calculations:
1. Understanding Swing highs and Swing Lows
Swing High: A Swing High is formed when there is a high with 2 lower highs to the left and right.
Swing Low: A Swing Low is formed when there is a low with 2 higher lows to the left and right.
2. Understanding the purpose and the underlying calculations behind Buyside, Sellside and Equilibrium levels.
3. Understanding probability calculations
1. Upon the formation of a new range, the script waits for the price to reach and tap into equilibrium or the 50% level. Status: "⏸" - Inactive
2. Once equilibrium is tapped into, the equilibrium status becomes activated and it waits for either liquidity side to be hit. Status: "▶" - Active
3. If the buyside liquidity is hit, the script adds to the count of successful buyside liquidity occurrences. Similarly, if the sellside is tapped, it records successful sellside liquidity occurrences.
5. Finally, the number of successful occurrences for each side is divided by the overall count individually to calculate the range probabilities.
Note: The calculations are performed independently for each directional range. A range is considered bearish if the previous breakout was through a sellside liquidity. Conversely, a range is considered bullish if the most recent breakout was through a buyside liquidity.
Example - BSL > 55%
-----
What's the range length Filter? What are the underlying calculations?
The range length filter identifies the price distance between buyside and sellside liquidity levels in percentage terms. When enabled, the script only looks for entries when the minimum range length is met. This helps ensure that trades are taken in markets with sufficient price movement.
Calculations:
Range Length (%) = ( ( Buyside Level − Sellside Level ) / Current Price ) ×100
Range Bias Identification:
Bullish Bias: The current range price has broken above the previous external swing high.
Bearish Bias: The current range price has broken below the previous external swing low.
Example - Range length filter is enabled | Range must be above 1%
>: Minimum required range length for entry | %: Current range length percentage in a (Bullish/Bearish) range
-----
What's the day filter Filter, what does it do?
The day filter allows users to customize the session time and choose the specific days they want to include in the strategy session. This helps traders tailor their strategies to particular trading sessions or days of the week when they believe the market conditions are more favorable for their trading style.
Customize Session Time:
Users can define the start and end times for the trading session.
This allows the strategy to only consider trades within the specified time window, focusing on periods of higher market activity or preferred trading hours.
Select Days:
Users can select which days of the week to include in the strategy.
This feature is useful for excluding days with historically lower volatility or unfavorable trading conditions (e.g., Mondays or Fridays).
Benefits:
Focus on Optimal Trading Periods:
By customizing session times and days, traders can focus on periods when the market is more likely to present profitable opportunities.
Avoid Unfavorable Conditions:
Excluding specific days or times can help avoid trading during periods of low liquidity or high unpredictability, such as major news events or holidays.
Increased Flexibility: The filter provides increased flexibility, allowing traders to adapt the strategy to their specific needs and preferences.
Example - Day filter | Session Filter
θ: Session time | Exchange time-zone
-----
What tables are available in this script?
Table Type:
- Summary: Provides a general overview, displaying key performance parameters such as Net Profit, Profit Factor, Max Drawdown, Average Trade, Closed Trades and more.
Avg Trade: The sum of money gained or lost by the average trade generated by a strategy. Calculated by dividing the Net Profit by the overall number of closed trades. An important value since it must be large enough to cover the commission and slippage costs of trading the strategy and still bring a profit.
MaxDD: Displays the largest drawdown of losses, i.e., the maximum possible loss that the strategy could have incurred among all of the trades it has made. This value is calculated separately for every bar that the strategy spends with an open position.
Profit Factor: The amount of money a trading strategy made for every unit of money it lost (in the selected currency). This value is calculated by dividing gross profits by gross losses.
Avg RR: This is calculated by dividing the average winning trade by the average losing trade. This field is not a very meaningful value by itself because it does not take into account the ratio of the number of winning vs losing trades, and strategies can have different approaches to profitability. A strategy may trade at every possibility in order to capture many small profits, yet have an average losing trade greater than the average winning trade. The higher this value is, the better, but it should be considered together with the percentage of winning trades and the net profit.
Winrate: The percentage of winning trades generated by a strategy. Calculated by dividing the number of winning trades by the total number of closed trades generated by a strategy. Percent profitable is not a very reliable measure by itself. A strategy could have many small winning trades, making the percent profitable high with a small average winning trade, or a few big winning trades accounting for a low percent profitable and a big average winning trade. Most mean-reversion successful strategies have a percent profitability of 40-80% but are profitable due to risk management control.
BE Trades: Number of break-even trades, excluding commission/slippage.
Losing Trades: The total number of losing trades generated by the strategy.
Winning Trades: The total number of winning trades generated by the strategy.
Total Trades: Total number of taken traders visible your charts.
Net Profit: The overall profit or loss (in the selected currency) achieved by the trading strategy in the test period. The value is the sum of all values from the Profit column (on the List of Trades tab), taking into account the sign.
- Monthly: Displays performance data on a month-by-month basis, allowing users to analyze performance trends over each month.
- Weekly: Displays performance data on a week-by-week basis, helping users to understand weekly performance variations.
- OFF: Hides the performance table.
Profit Color:
- Allows users to set the color for representing profit in the performance table, helping to quickly distinguish profitable periods.
Loss Color:
- Allows users to set the color for representing loss in the performance table, helping to quickly identify loss-making periods.
These customizable tables provide traders with flexible and detailed performance analysis, aiding in better strategy evaluation and optimization.
-----
User-input styles and customizations:
To facilitate studying historical data, all conditions and rules can be applied to your charts. By plotting background colors on your charts, you'll be able to identify what worked and what didn't in certain market conditions.
Please note that all background colors in the style are disabled by default to enhance visualization.
-----
How to Use This Algobuilder to Create a Profitable Edge and System:
Choose Your Strategy mode:
- Decide whether you are creating an investing strategy or a trading strategy.
Select a Market:
- Choose a one-sided market such as stocks, indices, or cryptocurrencies.
Historical Data:
- Ensure the historical data covers at least 10 years of price action for robust backtesting.
Timeframe Selection:
- Choose the timeframe you are comfortable trading with. It is strongly recommended to use a timeframe above 15 minutes to minimize the impact of commissions/slippage on your profits.
Set Commission and Slippage:
- Properly set the commission and slippage in the strategy properties according to your broker or prop firm specifications.
Parameter Optimization:
- Use trial and error to test different parameters until you find the performance results you are looking for in the summary table or, preferably, through deep backtesting using the strategy tester.
Trade Count:
- Ensure the number of trades is 100 or more; the higher, the better for statistical significance.
Positive Average Trade:
- Make sure the average trade value is above zero.
(An important value since it must be large enough to cover the commission and slippage costs of trading the strategy and still bring a profit.)
Performance Metrics:
- Look for a high profit factor, and net profit with minimum drawdown.
- Ideally, aim for a drawdown under 20-30%, depending on your risk tolerance.
Refinement and Optimization:
- Try out different markets and timeframes.
- Continue working on refining your edge using the available filters and components to further optimize your strategy.
Automation:
- Once you’re confident in your strategy, you can use the automation section to connect the algorithm to your broker or prop firm.
- Trade a fully automated and backtested trading strategy, allowing for hands-free execution and management.
-----
What makes this strategy original?
1. Incorporating direct integration of probabilities into the strategy.
2. Utilizing built-in market structure-based moving averages across various timeframes.
4. Offering both investing and trading strategies, facilitating optimization from different perspectives.
5. Automation for efficient execution.
6. Providing a summary table for instant access to key parameters of the strategy.
-----
How to use automation?
For Traders:
1. Ensure the strategy parameters are properly set based on your optimized parameters.
2. Enter your PineConnector License ID in the designated field.
3. Specify the desired risk level.
4. Provide the Metatrader symbol.
5. Check for chart updates to ensure the automation table appears on the top right corner, displaying your License ID, risk, and symbol.
6. Set up an alert with the strategy selected as Condition and the Message as {{strategy.order.alert_message}}.
7. Activate the Webhook URL in the Notifications section, setting it as the official PineConnector webhook address.
8. Double-check all settings on PineConnector to ensure the connection is successful.
9. Create the alert for entry/exit automation.
For Investors:
1. Ensure the strategy parameters are properly set based on your optimized parameters.
2. Choose "Investing" in the user-input settings.
3. Create an alert with a specified name.
4. Customize the notifications tab to receive alerts via email.
5. Buying/selling alerts will be triggered instantly upon entry or exit order execution.
-----
Terms and Conditions | Disclaimer
Our charting tools are provided for informational and educational purposes only and should not be construed as financial, investment, or trading advice. They are not intended to forecast market movements or offer specific recommendations. Users should understand that past performance does not guarantee future results and should not base financial decisions solely on historical data.
Built-in components, features, and functionalities of our charting tools are the intellectual property of @Fractalyst Unauthorized use, reproduction, or distribution of these proprietary elements is prohibited.
By continuing to use our charting tools, the user acknowledges and accepts the Terms and Conditions outlined in this legal disclaimer and agrees to respect our intellectual property rights and comply with all applicable laws and regulations.

FVG Positioning Average with 200EMA Auto Trading [Pakun]Description
Strategy Name and Purpose
FVG Positioning Average with 200EMA Auto Trading
This strategy uses Fair Value Gaps (FVG) combined with a 200-period Exponential Moving Average (EMA) and Average True Range (ATR) to generate trend-based trading signals. It is designed to help traders identify high-probability entry points by leveraging the gaps between fair value prices and current market prices.
Originality and Usefulness
This script combines multiple indicators to create a cohesive trading strategy that is greater than the sum of its parts. While FVG is a powerful tool on its own, combining it with the EMA and ATR adds layers of confirmation and risk management, enhancing its effectiveness. Here’s how the components work together:
Fair Value Gap (FVG): Identifies gaps in the market where price action has not fully filled, indicating potential reversal or continuation points.
200-period Exponential Moving Average (EMA): Acts as a trend filter to ensure trades are taken in the direction of the overall trend, improving the probability of success.
Average True Range (ATR): Used to filter out insignificant gaps and set dynamic stop-loss levels based on market volatility, enhancing risk management.
Entry Conditions
Long Entry
The close price crosses above the downtrend FVG.
The close price, FVG up average, and down average are all above the 200 EMA, indicating a strong bullish trend.
Short Entry
The close price crosses below the uptrend FVG.
The close price, FVG up average, and down average are all below the 200 EMA, indicating a strong bearish trend.
Exit Conditions
For long positions, the stop loss is set at the recent low, and the take profit is set at a point with a risk-reward ratio of 1:1.5.
For short positions, the stop loss is set at the recent high, and the take profit is set at a point with a risk-reward ratio of 1:1.5.
Risk Management
Account Size: 1,000,000 yen
Commission and Slippage: 2 pips commission and 1 pip slippage per trade
Risk per Trade: 10% of account equity
The stop loss is based on the recent low or recent high, ensuring trades are exited when the market moves against the position.
Settings Options
FVG Lookback: Set the lookback period for calculating FVGs.
Lookback Type: Choose the type of lookback (Bar Count or FVG Count).
ATR Multiplier: Set the multiplier for ATR to filter significant gaps.
EMA Period: Set the period for the EMA to adjust the trend filter sensitivity.
Show FVGs on Chart: Choose whether to display FVGs on the chart for visual confirmation.
Bullish/Bearish Color: Set the color for bullish and bearish FVGs to distinguish them easily.
Show Gradient Areas: Choose whether to display gradient areas to highlight the zones of interest.
Sufficient Sample Size
The strategy has been backtested with 113 trades, providing a sufficient sample size to evaluate its performance.
Notes
This strategy is based on historical data and does not guarantee future results.
Thoroughly backtest and validate results before using in live trading.
Market volatility and other external factors can affect performance and may not yield expected results.
Acknowledgment
This strategy uses the FVG Positioning Average Strategy indicator. Thanks to for their contribution.
Clean Chart Explanation
The script is published with a clean chart to ensure that its output is readily identifiable and easy to understand. No other scripts are included on the chart, and any drawings or images used are specifically to illustrate how the script works.

Power Hour Money StrategyDescription of the Pine Script Code: "Power Hour Money Strategy"
This Pine Script strategy, "Power Hour Money Strategy," is designed to trade based on the alignment of multiple time frames (month, week, day, and hour). The strategy aims to enter long or short positions depending on whether all selected time frames are in sync (all green for long positions, all red for short positions). Additionally, the script includes configurations for trading during specific sessions and automatically closing positions at the end of the trading day.
Core Features:
1. Time Frame Sync Check:
- The strategy evaluates whether the current price is higher than the opening price for the month, week, day, and hour to determine if each time frame is "green" (bullish) or "red" (bearish).
2. Session Control:
- The user can select between different trading sessions:
- "NY Session 9:30-11:30"
- "Extended NY Session 8-4"
- "All Sessions"
- Trades are only executed if the current time falls within the selected session.
3. Trailing Stop Mechanism:
- The strategy includes an optional trailing stop mechanism for both long and short positions.
- The trailing stop is configured with a percentage loss from the current price to protect gains.
4. End-of-Day Position Management:
- An option is provided to automatically close all positions at the end of the trading day (5:45 PM Eastern Time).
Detailed Code Breakdown:
1. Input Settings:
- **Session Selection**: Allows the user to choose the trading session.
- **End-of-Day Close**: Option to automatically close positions at the end of the day.
- **Trailing Stop Loss**: Enables or disables the trailing stop loss feature and sets the percentage for long and short positions.
2. Time Frame Calculations:
- The script uses `request.security` to get the opening prices for higher time frames (monthly, weekly, daily, and hourly).
- It compares the current close price to these opening prices to determine if each time frame is green or red.
3. Session Time Definitions:
- Defines the start and end times for the NY session (9:30-11:30 AM) and the extended session (8:00 AM - 4:00 PM).
4. Trade Execution:
- The strategy checks if all selected time frames are in sync and if the current time falls within the trading session.
- If all conditions are met, it enters a long or short position.
5. Trailing Stop Loss Implementation:
- Adjusts the stop price based on the trailing percentage and the current position's size.
- Automatically exits positions if the trailing stop condition is met.
6. End-of-Day Close Implementation:
- Uses a timestamp to check if the current time is 5:45 PM Eastern Time.
- Closes all positions if the end-of-day condition is met.
7. Plotting and Logging:
- Plots indicators to visualize the green/red status of each time frame.
- Logs information about the status of each time frame for debugging and analysis.
Example Usage:
Entering a Long Position: If the month, week, day, and hour are all green and the current time is within the selected session, a long position is entered.
Entering a Short Position: If the month, week, day, and hour are all red and the current time is within the selected session, a short position is entered.
Trailing Stop: Protects gains by exiting the position if the price moves against the set trailing stop percentage.
End-of-Day Close: Automatically closes all open positions at 5:45 PM Eastern Time if enabled.
This strategy is particularly useful for traders who want to ensure that multiple time frames are in alignment before entering a trade and who wish to manage positions effectively throughout the trading day with specific session controls and trailing stops.

TSI w SuperTrend decision - Strategy [presentTrading]This strategy aims to improve upon the performance of Traidngview's newly published "Trend Strength Index" indicator by incorporating the SuperTrend for better trade execution and risk management. Enjoy :)
█ Introduction and How it is Different
The "TSI with SuperTrend Decision - Strategy" combines the Trend Strength Index (TSI) with SuperTrend indicators to determine entry and exit points. Unlike traditional strategies that rely solely on one indicator, this method leverages the strengths of both TSI and SuperTrend to provide a more nuanced and adaptive trading strategy.
This dual approach allows for capturing trends more effectively, especially in volatile markets.
BTCUSD 8h LS Performance
█ Strategy, How it Works: Detailed Explanation
🔶 Trend Strength Index (TSI)
The TSI is a momentum oscillator that shows both the direction and strength of a trend. It is calculated by comparing the price movement with the bar index over a specified period. The formula for TSI is as follows:
```
TSI = (PC / |PC|)
where:
PC = Change in price over the period
```
In this strategy, TSI is calculated using the closing prices and a default period of 64 bars. The TSI values help identify overbought and oversold conditions, providing signals for potential market reversals.
🔶 SuperTrend Indicator
The SuperTrend is a trend-following indicator based on the average true range (ATR). It helps in identifying the direction of the market trend. The SuperTrend calculation involves:
```
SuperTrend = HLC3 ± (Factor * ATR)
where:
HLC3 = (High + Low + Close) / 3
Factor = User-defined multiplier
ATR = Average True Range over a period
```
The SuperTrend settings in this strategy include a length of 10 bars and a factor of 3.0.
Last Bull Cycle of BTC
🔶 Entry and Exit Conditions
The strategy uses the TSI and SuperTrend together to determine entry and exit points:
- Long Entry: When the SuperTrend indicates a downward trend (st.d < 0) and the TSI is above the oversold level (-0.241).
- Long Exit: When the SuperTrend indicates an upward trend (st.d > 0) and the TSI is below the overbought level (0.241).
- Short Entry: When the SuperTrend indicates an upward trend (st.d > 0) and the TSI is below the overbought level (0.241).
- Short Exit: When the SuperTrend indicates a downward trend (st.d < 0) and the TSI is above the oversold level (-0.241).
█ Trade Direction
The strategy allows users to select the trade direction through the `tradeDirection` input. The options are:
- Both: Enables both long and short trades.
- Long: Enables only long trades.
- Short: Enables only short trades.
█ Default Settings
- TSI Length: 64
- SuperTrend Length: 10
- SuperTrend Factor: 3.0
- Trade Direction: Both
- Take Profit (%): 30.0
- Stop Loss (%): 20.0
Impact of Default Settings
- TSI Length: A longer TSI period smooths out noise but may lag in identifying trends. A shorter period is more responsive but can generate false signals.
- SuperTrend Length: A shorter length provides quicker signals but can be prone to whipsaws. A longer length is more reliable but may delay entries and exits.
- SuperTrend Factor: A higher factor increases the distance of the SuperTrend from the price, reducing sensitivity to minor price fluctuations.
- Trade Direction: Allows flexibility in trading strategies by enabling both long and short trades based on market conditions.
- Take Profit and Stop Loss: These settings manage risk by automatically closing trades at predefined profit or loss levels. Higher percentages provide larger potential gains but also higher risk.

IsAlgo - Manual TrendLine► Overview:
Manual TrendLine is a strategy that allows traders to manually insert a trendline and opens trades when the trendline is retested or when the price hits a new highest high or lowest low. It provides flexibility in trendline configuration and trading behavior, enabling responsive and adaptable trading strategies.
► Description:
The Manual TrendLine strategy revolves around using manually defined trendlines as the primary tool for making trading decisions. Traders start by specifying two key points on the chart to establish the trendline. Each point is defined by a specific time and price, enabling precise placement according to the trader’s analysis and insights. Additionally, the strategy allows for the adjustment of the trendline’s width, which acts as a buffer zone around the trendline, providing flexibility in how closely price movements must align with the trendline to trigger trades.
Once the trendline is established, the strategy continuously monitors price movements relative to this line. One of its core functions is to execute trades when the price retests the trendline. A retest occurs when the price approaches the trendline after initially diverging from it, indicating potential continuation of the prevailing trend. This behavior is often seen as a confirmation of the trend’s strength, and the strategy takes advantage of these moments to enter trades in the direction of the trend.
Beyond retests, the strategy also tracks the formation of new highest highs and lowest lows in relation to the trendline. When the price reaches a new highest high or lowest low, it signifies strong momentum in the trend’s direction. The strategy can be configured to open trades at these critical points.
Another key feature of the strategy is its response to trendline breaks. A break occurs when the price moves through the trendline, potentially signaling a reversal or a significant shift in market sentiment. The strategy can be set to open reverse trades upon such breaks, enabling traders to quickly adapt to changing market conditions. Additionally, traders have the option to stop opening new trades after a trendline break, helping to avoid trades during periods of uncertainty or increased volatility.
↑ Up Trend Example:
↓ Down Trend Example:
► Features and Settings:
⚙︎ TrendLine: Define the time and price of the two main points of the trendline, and set the trendline width.
⚙︎ Entry Candle: Specify the minimum and maximum body size and the body-to-candle size ratio for entry candles.
⚙︎ Trading Session: Define specific trading hours during which the strategy operates, restricting trades to preferred market periods.
⚙︎ Trading Days: Specify active trading days to avoid certain days of the week.
⚙︎ Backtesting: backtesting for a selected period to evaluate strategy performance. This feature can be deactivated if not needed.
⚙︎ Trades: Configure trade direction (long, short, or both), position sizing (fixed or percentage-based), maximum number of open trades, and daily trade limits.
⚙︎ Trades Exit: Set profit/loss limits, specify trade duration, or exit based on band reversal signals.
⚙︎ Stop Loss: Choose from various stop-loss methods, including fixed pips, ATR-based, or highest/lowest price points within a specified number of candles. Trades can also be closed after a certain number of adverse candle movements.
⚙︎ Break Even: Adjust stop loss to break even once predefined profit levels are reached, protecting gains.
⚙︎ Trailing Stop: Implement a trailing stop to adjust the stop loss as the trade becomes profitable, securing gains and potentially capturing further upside.
⚙︎ Take Profit: Set up to three take-profit levels using methods such as fixed pips, ATR, or risk-to-reward ratios. Alternatively, specify a set number of candles moving in the trade’s direction.
⚙︎ Alerts: Comprehensive alert system to notify users of significant actions, including trade openings and closings. Supports dynamic placeholders for take-profit levels and stop-loss prices.
⚙︎ Dashboard: Visual display on the chart providing detailed information about ongoing and past trades, aiding users in monitoring strategy performance and making informed decisions.
► Backtesting Details:
Timeframe: 30-minute EURUSD chart
Initial Balance: $10,000
Order Size: 500 units
Commission: 0.05%
Slippage: 5 ticks
This strategy opens trades around a manually drawn trendline, which results in a smaller number of closed trades.

BTC outperform atrategy### Code Description
This Pine Script™ code implements a simple trading strategy based on the relative prices of Bitcoin (BTC) on a weekly and a three-month basis. The script plots the weekly and three-month closing prices of Bitcoin on the chart and generates trading signals based on the comparison of these prices. The code can also be applied to Ethereum (ETH) with similar effectiveness.
### Explanation
1. **Inputs and Variables**:
- The user selects the trading symbol (default is "BINANCE:BTCUSDT").
- `weeklyPrice` retrieves the closing price of the selected symbol on a weekly interval.
- `monthlyPrice` retrieves the closing price of the selected symbol on a three-month interval.
2. **Plotting Data**:
- The weekly price is plotted in blue.
- The three-month price is plotted in red.
3. **Trading Conditions**:
- A long position is suggested if the weekly price is greater than the three-month price.
- A short position is suggested if the three-month price is greater than the weekly price.
4. **Strategy Execution**:
- If the long condition is met, the strategy enters a long position.
- If the short condition is met, the strategy enters a short position.
This script works equally well for Ethereum (ETH) by changing the symbol input to "BINANCE:ETHUSDT" or any other desired Ethereum trading pair.

Universal Algo [Coff3eG]Universal Algo By G
Overview:
Universal Algo By G is a comprehensive LONG-ONLY trading strategy specifically designed for medium to long-term use in cryptocurrency markets, particularly Bitcoin. This algorithm can be manually adjusted to fit the volatility of specific coins, ensuring the best possible results. While it does not generate a large number of trades due to the nature of bull and bear market cycles, it has been rigorously backtested and forward-tested to ensure the strategy is not overfitted.
Core Features:
Integrated Systems: Universal Algo is built around five core systems, each contributing unique analytical perspectives to enhance trade signal reliability. These systems are designed to identify clear trend opportunities for significant gains while also employing logic to navigate through ranging markets effectively.
Optional Ranging Market Filter: Helps filter out noise, potentially enhancing signal clarity.
Market State Detection: Identifies four distinct market states:
Trending
Ranging
Danger (Possible top)
Possible Bottom
Global Liquidity Indicator (GLI) Integration: Leverages GLI values to identify positive liquidity trends.
Volatility Bands: Provides insights into market volatility.
Top and Bottom Detection: Shows possible bottoms with green backgrounds and red backgrounds for possible top detection.
The Market State Detection, GLI, Volatility Bands, and Top and Bottom Detection feature all serve as an expectation management feature.
Additional Features:
Optional Metrics Table: Displays strategy metrics and statistics, providing detailed insights into performance.
Customization Options: The script offers a range of user inputs, allowing for customization of the backtesting starting date, the decision to display the strategy equity curve, among other settings. These inputs cater to diverse trading needs and preferences, offering users control over their strategy implementation.
Operational Parameters:
Customizable Inputs: Users can adjust thresholds to match the coin's volatility, enhancing strategy performance.
Transparency and Logic Insight: While specific calculation details and proprietary indicators are integral to maintaining the uniqueness of Universal Algo, the strategy is grounded on well-established financial analysis techniques. These include momentum analysis, volatility assessments, and adaptive thresholding, among others, to formulate its trade signals. Notably, no single indicator is used in isolation; each indicator is combined with another to enhance signal accuracy and robustness. Some of the indicators include customized versions of the TEMA, Supertrend, Augmented Dickey-Fuller (ADF), and Weekly Positive Directional Movement Index (WPDM), all integrated together to create a cohesive and effective trading strategy.
System Operation:
Universal Algo works by taking the average score of the five core systems used for the signals. Three of these systems have been lengthened out to function as longer-term systems, while the remaining two operate at a slightly faster speed. This combination and averaging of systems help to balance the overall strategy, ensuring it maintains the right amount of speed to remain effective for medium to long-term use with minimal noise. The average score is then compared against customizable thresholds. The strategy will go long if the average score is above the threshold and short if it is below the threshold. This averaging mechanism helps to smooth out individual system anomalies and provides a more robust signal for trading decisions.
Originality and Usefulness:
Universal Algo is an original strategy that combines multiple proprietary and customized indicators to deliver robust trading signals. The strategy integrates various advanced indicators and methodologies, including:
System Indicator: Calculates a cumulative score based on recent price movements, aiding in trend detection.
Median For Loop: Utilizes percentile rank calculations of price data to gauge market direction.
Volatility Stop: A modified volatility-based stop-loss indicator that adjusts based on market conditions.
Supertrend: A customized supertrend indicator that uses percentile ranks and ATR for trend detection.
RSI and DEMA: Combines a modified RSI and DEMA for overbought/oversold conditions.
TEMA: Uses 3 different types of MA for trend detection and standard deviation bands for additional confirmation.
Detailed Explanation of Components and Their Interaction:
RSI (Relative Strength Index): Used to identify overbought and oversold conditions. In Universal Algo, RSI is combined with DEMA (Double Exponential Moving Average) to smooth the price data and provide clearer signals.
ATR (Average True Range): Used to measure market volatility. ATR is incorporated into the Volatility Stop and Supertrend indicators to adjust stop-loss levels and trend detection based on current market conditions.
DEMA (Double Exponential Moving Average): Provides a smoother price trend compared to traditional moving averages, reducing lag and making it easier to identify trend changes.
Modified TEMA (Triple Exponential Moving Average): Similar to DEMA but provides even greater smoothing, reducing lag further and enhancing trend detection accuracy.
Volatility Stop: Utilizes ATR to dynamically set stop-loss levels that adapt to changing market volatility. This helps in protecting profits and minimizing losses.
Customized Supertrend: Uses ATR and percentile ranks to determine trend direction and strength. This indicator helps in capturing major trends while filtering out market noise.
Median For Loop: Calculates percentile ranks of price data over a specified period to assess market direction. This helps in identifying potential reversals and trend continuations.
HMA (Hull Moving Average): A fast-acting moving average that reduces lag while maintaining smoothness. It helps in quickly identifying trend changes.
SMA (Simple Moving Average): A traditional moving average that provides baseline trend information. Combined with HMA and other indicators, it forms a comprehensive trend detection system.
Universal Algo offers a sophisticated blend of advanced indicators and proprietary logic that is not available in free or open-source scripts. Here are some reasons why it is worth paying for:
Customization and Flexibility: The strategy provides a high degree of customization, allowing users to adjust various parameters to suit their trading style and market conditions. This flexibility is often not available in free scripts.
Proprietary Indicators: The use of proprietary and customized indicators such as the TEMA, Supertrend, ADF, and WPDM ensures that the strategy is unique and not replicable by free or open-source scripts.
Integrated Systems: The strategy combines multiple systems and indicators to provide a more comprehensive and reliable trading signal. This integration helps to smooth out anomalies and reduces noise, providing clearer trading opportunities.
Rigorous Testing: Universal Algo has undergone extensive backtesting and forward-testing to ensure its robustness and reliability. The results demonstrate its ability to perform well under various market conditions, offering users confidence in its effectiveness.
Detailed Metrics and Analysis: The optional metrics table provides users with detailed insights into the strategy's performance, including metrics like equity, drawdown, Sharpe ratio, and more. This level of detail helps traders make informed decisions.
Value Addition: By providing a strategy that combines advanced indicators, customization options, and thorough testing, Universal Algo adds significant value to traders looking for a reliable and adaptable trading tool.
Realistic Trading Conditions:
Backtesting and Forward-Testing: Rigorous testing ensures performance and reliability, with a focus on prudent risk management. Default properties include an initial capital of $1000, 0 pyramiding, 20 slippage, 0.05% commission, and using 5% of equity for trades.
The strategy is designed and tested with a focus on achieving a balance between risk and reward, striving for robustness and reliability rather than unrealistic profitability promises. Realistic trading conditions are considered, including appropriate account size, commission, slippage, and sustainable risk levels per trade.
Concluding Thoughts:
Universal Algo By G is offered to the TradingView community as a robust tool for enhancing market analysis and trading strategies. It is designed with a commitment to quality, innovation, and adaptability, aiming to provide valuable insights and decision support across various market conditions. Potential users are encouraged to evaluate Universal Algo within the context of their overall trading approach and objectives.

Strategic Multi-Step Supertrend - Strategy [presentTrading]The code is mainly developed for me to stimulate the multi-step taking profit function for strategies. The result shows the drawdown can be reduced but at the same time reduced the profit as well. It can be a heuristic for futures leverage traders.
█ Introduction and How it is Different
The "Strategic Multi-Step Supertrend" is a trading strategy designed to leverage the power of multiple steps to optimize trade entries and exits across the Supertrend indicator. Unlike traditional strategies that rely on single entry and exit points, this strategy employs a multi-step approach to take profit, allowing traders to lock in gains incrementally. Additionally, the strategy is adaptable to both long and short trades, providing a comprehensive solution for dynamic market conditions.
This template strategy lies in its dual Supertrend calculation, which enhances the accuracy of trend detection and provides more reliable signals for trade entries and exits. This approach minimizes false signals and increases the overall profitability of trades by ensuring that positions are entered and exited at optimal points.
BTC 6h L/S Performance
█ Strategy, How It Works: Detailed Explanation
The "Strategic Multi-Step Supertrend Trader" strategy utilizes two Supertrend indicators calculated with different parameters to determine the direction and strength of the market trend. This dual approach increases the robustness of the signals, reducing the likelihood of entering trades based on false signals. Here is a detailed breakdown of how the strategy operates:
🔶 Supertrend Indicator Calculation
The Supertrend indicator is a trend-following overlay on the price chart, typically used to identify the direction of the trend. It is calculated using the Average True Range (ATR) to ensure that the indicator adapts to market volatility. The formula for the Supertrend indicator is:
Upper Band = (High + Low) / 2 + (Factor * ATR)
Lower Band = (High + Low) / 2 - (Factor * ATR)
Where:
- High and Low are the highest and lowest prices of the period.
- Factor is a user-defined multiplier.
- ATR is the Average True Range over a specified period.
The Supertrend changes its direction based on the closing price in relation to these bands.
🔶 Entry-Exit Conditions
The strategy enters long positions when both Supertrend indicators signal an uptrend, and short positions when both indicate a downtrend. Specifically:
- Long Condition: Supertrend1 < 0 and Supertrend2 < 0
- Short Condition: Supertrend1 > 0 and Supertrend2 > 0
- Long Exit Condition: Supertrend1 > 0 and Supertrend2 > 0
- Short Exit Condition: Supertrend1 < 0 and Supertrend2 < 0
🔶 Multi-Step Take Profit Mechanism
The strategy features a multi-step take profit mechanism, which allows traders to lock in profits incrementally. This is achieved through four user-configurable take profit levels. For each level, the strategy specifies a percentage increase (for long trades) or decrease (for short trades) in the entry price at which a portion of the position is exited:
- Step 1: Exit a portion of the trade at Entry Price * (1 + Take Profit Percent1 / 100)
- Step 2: Exit a portion of the trade at Entry Price * (1 + Take Profit Percent2 / 100)
- Step 3: Exit a portion of the trade at Entry Price * (1 + Take Profit Percent3 / 100)
- Step 4: Exit a portion of the trade at Entry Price * (1 + Take Profit Percent4 / 100)
This staggered exit strategy helps in locking profits at multiple levels, thereby reducing risk and increasing the likelihood of capturing the maximum possible profit from a trend.
BTC Local
█ Trade Direction
The strategy is highly flexible, allowing users to specify the trade direction. There are three options available:
- Long Only: The strategy will only enter long trades.
- Short Only: The strategy will only enter short trades.
- Both: The strategy will enter both long and short trades based on the Supertrend signals.
This flexibility allows traders to adapt the strategy to various market conditions and their own trading preferences.
█ Usage
1. Add the strategy to your trading platform and apply it to the desired chart.
2. Configure the take profit settings under the "Take Profit Settings" group.
3. Set the trade direction under the "Trade Direction" group.
4. Adjust the Supertrend settings in the "Supertrend Settings" group to fine-tune the indicator calculations.
5. Monitor the chart for entry and exit signals as indicated by the strategy.
█ Default Settings
- Use Take Profit: True
- Take Profit Percentages: Step 1 - 6%, Step 2 - 12%, Step 3 - 18%, Step 4 - 50%
- Take Profit Amounts: Step 1 - 12%, Step 2 - 8%, Step 3 - 4%, Step 4 - 0%
- Number of Take Profit Steps: 3
- Trade Direction: Both
- Supertrend Settings: ATR Length 1 - 10, Factor 1 - 3.0, ATR Length 2 - 11, Factor 2 - 4.0
These settings provide a balanced starting point, which can be customized further based on individual trading preferences and market conditions.

IsAlgo - Reverse Candle Strategy► Overview:
The Reverse Candle Strategy leverages a customizable moving average to identify the start of a trend. It utilizes the highest and lowest prices to define the trend and its corrections, executing trades based on custom candlestick patterns to capitalize on the main trend's continuation.
► Description:
The Reverse Candle Strategy is designed to effectively identify and trade market trends by combining moving averages and custom candlestick patterns. The core of the strategy is a single, customizable moving average, which helps determine the trend direction. When the market price crosses above the moving average, this signifies the beginning of an uptrend. The strategy then tracks the highest price reached during the uptrend and waits for a correction. A specific custom candlestick pattern signals the end of the correction, at which point the strategy executes a long trade.
In the case of a downtrend, the market price crossing below the moving average marks the trend’s start. The strategy monitors the lowest price during the downtrend and awaits a correction. The end of this correction is identified by another custom candlestick pattern, prompting the strategy to execute a short trade. This combination of a moving average with precise candlestick patterns ensures that trades are made at optimal moments, improving the likelihood of successful trades.
The integration of the moving average and candlestick patterns is critical. The moving average smooths out price data to highlight the trend direction, while the custom candlestick patterns provide specific entry signals after a correction, ensuring the trend’s resumption is genuine. This synergy enhances the strategy’s ability to filter out false signals and improve trade accuracy.
↑ Long Entry Example:
When the price is moving above the moving average and the highest price has been detected, the strategy will wait for the entry candle to execute the long trade.
↓ Short Entry Example:
When the price is moving below the moving average and the lowest price has been detected, the strategy will wait for the entry candle to execute the short trade.
✕ Exit Conditions:
To manage risk effectively, the strategy provides multiple stop-loss options. Traders can set stop-loss levels using fixed pips, ATR-based calculations, or the higher/lower price of past candles. Additionally, trades can be closed if a candle moves against the trade direction. Up to three take-profit levels can be set using fixed pips, ATR, or risk-to-reward ratios, allowing traders to secure profits at different stages. The trailing stop feature adjusts the stop loss as the trade moves into profit, locking in gains while allowing for continued potential upside. Furthermore, a break-even feature moves the stop loss to the entry price once a certain profit level is reached, protecting against losses. Trades can also be closed when the price crosses the moving average.
► Features & Settings:
⚙︎ Moving Average: Users can choose between various types of moving averages (e.g., SMA, EMA) to confirm the trend direction.
⚙︎ Trend & Corrections: Set minimum and maximum pips for trends and corrections, with an option to define correction percentages relative to the trend.
⚙︎ Entry Candle: Define the entry candle by specifying the minimum and maximum size of the candle's body and the ratio of the body to the entire candle size, ensuring significant breakouts trigger trades.
⚙︎ Trading Session: This feature allows users to define specific trading hours during which the strategy should operate, ensuring trades are executed only during preferred market periods.
⚙︎ Trading Days: Users can specify which days the strategy should be active, offering the flexibility to avoid trading on specific days of the week.
⚙︎ Backtesting: Enables a backtesting period during which the strategy can be tested over a selected start and end date. This feature can be deactivated if not needed.
⚙︎ Trades: Configure trade direction (long, short, or both), position sizing (fixed or percentage-based), maximum number of open trades, and daily trade limits.
⚙︎ Trades Exit: Various exit methods, such as setting profit or loss limits, trade duration, or closing trades on moving average crossings.
⚙︎ Stop Loss: Various stop-loss methods are available, including a fixed number of pips, ATR-based, or using the highest or lowest price points within a specified number of previous candles. Additionally, trades can be closed after a specific number of candles move in the opposite direction of the trade.
⚙︎ Break Even: This feature adjusts the stop loss to a break-even point once certain conditions are met, such as reaching predefined profit levels, to protect gains.
⚙︎ Trailing Stop: The trailing stop feature adjusts the stop loss as the trade moves into profit, securing gains while potentially capturing further upside.
⚙︎ Take Profit: up to three take-profit levels using fixed pips, ATR, or risk-to-reward ratios based on the stop loss. Alternatively, specify a set number of candles moving in the trade direction.
⚙︎ Alerts: The strategy includes a comprehensive alert system that informs the user of all significant actions, such as trade openings and closings. It supports placeholders for dynamic values like take-profit levels and stop-loss prices.
⚙︎ Dashboard: Visual display providing detailed information about ongoing and past trades on the chart, helping users monitor performance and make informed decisions.
► Backtesting Details:
Timeframe: 30-minute NAS100 chart
Initial Balance: $10,000
Order Size: 5 Units
Commission: $0.5 per contract
Slippage: 5 ticks
Stop Loss: MA Crossing or by break even
