Hull Suite by MRS**Hull Suite by MRS Strategy Indicator**
The Hull Suite by MRS Strategy is a technical analysis tool designed to provide insights into market trends using variations of the Hull Moving Average (HMA). This strategy aims to help traders identify optimal entry points for both long and short positions by utilizing multiple types of Hull-based indicators.
### Key Features:
1. **Hull Moving Average Variations**: The indicator offers three different Hull Moving Average variants:
- **HMA (Hull Moving Average)**: A fast-moving average that minimizes lag and reacts quickly to price changes.
- **EHMA (Enhanced Hull Moving Average)**: A smoother version of HMA with reduced noise, offering a clearer view of market trends.
- **THMA (Triple Hull Moving Average)**: A more complex Hull average that aims to provide a stronger confirmation of trend direction.
2. **Customizable Parameters**:
- **Source Selection**: Allows traders to choose the source for calculation (e.g., closing prices).
- **Length**: A configurable parameter to adjust the period over which the moving average is calculated (e.g., 55-period for swing entries).
- **Trend Coloring**: Users can enable automatic color-coding of the Hull moving average to reflect whether the market is in an uptrend (green) or downtrend (red).
- **Candle Color**: Option to color candles based on Hull's trend, further improving the visual clarity of trend direction.
3. **Entry and Exit Signals**:
- **Buy Signal**: Generated when the Hull moving average crosses above its historical value, indicating a potential upward price movement.
- **Sell Signal**: Triggered when the Hull moving average crosses below its historical value, signaling a potential downward price movement.
- The strategy can be customized to work with long, short, or both directions, making it adaptable for various market conditions.
4. **Visual Representation**:
- **Hull Bands**: The indicator can plot the Hull moving average as bands, with customizable transparency to suit individual preferences.
- **Band Filler**: The area between the two Hull moving averages is filled, making it easier to identify trends at a glance.
5. **Backtesting and Strategy Execution**: This strategy can be tested on historical data with adjustable backtest start and stop dates, providing traders with a better understanding of its performance before live trading.
### Purpose:
The Hull Suite by MRS Strategy is designed to assist traders in determining the optimal time to enter and exit the market based on robust Hull moving averages. With its flexibility, it can be used for trend-following, swing trading, or other strategic applications.
Trend Analizi

4Vietnamese 3x SupertrendThis strategy attempts to capture long positions in the Vietnamese stock market using a combination of three Supertrend indicators and additional filters. It utilizes pyramiding to enter up to three long positions with a 33.33% allocation each.
Key Elements:
Supertrend Indicators: Three Supertrend indicators are used with different lengths and multipliers to identify potential trend changes.
Entry Conditions:
The strategy looks for a downtrend on the slowest Supertrend (Supertrend3) followed by uptrends on the medium (Supertrend2) and fast (Supertrend1) Supertrends.
Alternatively, if Supertrend3 is still downtrending, but Supertrend1 is downtrending and a significant previous high (highestGreen) exists, an entry signal is generated.
An optional filter allows using the highest of the last two red candles for highestGreen calculation.
Entry Stop Loss:
An optional stop loss can be set based on the entry price of previous long positions, preventing further losses if the price falls below entry prices.
Exit Conditions:
Three exit options are available:
- All Downtrend Exit: Close all positions if all Supertrends turn uptrend and a bearish candlestick pattern (close price lower than open price) is formed.
- Average Price in Loss Exit: Close all positions if the average entry price of open positions is higher than the current closing price (indicating a loss).
- All Positions in Loss Exit: Close all positions if any of the following conditions are met:
A single open position exists, and its entry price is higher than the current close price.
Two open positions exist, and their entry prices are both higher than the current close price.
Three open positions exist, and their entry prices are all higher than the current close price.
Pyramiding: The strategy allows entering up to three long positions with a fixed allocation of 33.33% each.
Customization Options:
The strategy provides various input parameters to customize its behavior:
Supertrend lengths and multipliers for each indicator.
Option to use the highest of the last two red candles for highestGreen calculation.
Enabling/disabling Entry Stop Loss and different exit conditions.
Further Enhancements:
Explore additional entry and exit filters to refine trade signals.
Consider incorporating risk management techniques like position sizing and trailing stops.
Backtest the strategy with historical data to evaluate its effectiveness and identify potential areas for improvement.

Adaptive Trend Flow Strategy with Filters for SPXThe Adaptive Trend Flow Strategy with Filters for SPX is a complete trading algorithm designed to identify traits and offer actionable alerts for the SPX index. This Pine Script approach leverages superior technical signs and user-described parameters to evolve to marketplace conditions and optimize performance.
Key Features and Functionality
Dynamic Trend Detection: Utilizes a dual EMA-based totally adaptive method for fashion calculation.
The script smooths volatility the usage of an EMA filter and adjusts sensitivity through the sensitivity enter. This allows for real-time adaptability to market fluctuations.
Trend Filters for Precision:
SMA Filter: A Simple Moving Average (SMA) guarantees that trades are achieved best while the rate aligns with the shifting average trend, minimizing false indicators.
MACD Filter: The Moving Average Convergence Divergence (MACD) adds some other layer of confirmation with the aid of requiring alignment among the MACD line and its sign line.
Signal Generation:
Long Signals: Triggered when the fashion transitions from bearish to bullish, with all filters confirming the pass.
Short Signals: Triggered while the trend shifts from bullish to bearish, imparting opportunities for final positions.
User Customization:
Adjustable parameters for EMAs, smoothing duration, and sensitivity make certain the strategy can adapt to numerous buying and selling patterns.
Enable or disable filters (SMA or MACD) based totally on particular market conditions or consumer possibilities.
Leverage and Position Sizing: Incorporates a leverage aspect for dynamic position sizing.
Automatically calculates the exchange length based on account fairness and the leverage element, making sure hazard control is in area.
Visual Enhancements: Plots adaptive fashion ranges (foundation, top, decrease) for actual-time insights into marketplace conditions.
Color-coded bars and heritage to visually represent bullish or bearish developments.
Custom labels indicating crossover and crossunder occasions for clean sign visualization.
Alerts and Automation: Configurable alerts for each lengthy and quick indicators, well matched with automated buying and selling structures like plugpine.Com.
JSON-based alert messages consist of account credentials, motion type, and calculated position length for seamless integration.
Backtesting and Realistic Assumptions: Includes practical slippage, commissions, and preliminary capital settings for backtesting accuracy.
Leverages excessive-frequency trade sampling to make certain strong strategy assessment.
How It Works
Trend Calculation: The method derives a principal trend basis with the aid of combining fast and gradual EMAs. It then uses marketplace volatility to calculate adaptive upper and decrease obstacles, creating a dynamic channel.
Filter Integration: SMA and MACD filters work in tandem with the fashion calculation to ensure that handiest excessive-probability signals are accomplished.
Signal Execution: Signals are generated whilst the charge breaches those dynamic tiers and aligns with the fashion and filters, ensuring sturdy change access situations.
How to Use
Setup: Apply the approach to SPX or other well suited indices.
Adjust person inputs, together with ATR length, EMA smoothing, and sensitivity, to align together with your buying and selling possibilities.
Enable or disable the SMA and MACD filters to test unique setups.
Alerts: Configure signals for computerized notifications or direct buying and selling execution through third-celebration systems.
Use the supplied JSON payload to integrate with broking APIs or automation tools.
Optimization:
Experiment with leverage, filter out settings, and sensitivity to find most effective configurations to your hazard tolerance and marketplace situations.
Considerations and Best Practices
Risk Management: Always backtest the method with realistic parameters, together with conservative leverage and commissions.
Market Suitability: While designed for SPX, this method can adapt to other gadgets by means of adjusting key parameters.
Limitations: The method is trend-following and can underperform in enormously risky or ranging markets. Regularly evaluate and modify parameters primarily based on recent market conduct.
If you have any questions please let me know - I'm here to help!

BullBear with Volume-Percentile TP - Strategy [presentTrading] Happy New Year, everyone! I hope we have a fantastic year ahead.
It's been a while since I published an open script, but it's time to return.
This strategy introduces an indicator called Bull Bear Power, combined with an advanced take-profit system, which is the main innovative and educational aspect of this script. I hope all of you find some useful insights here. Welcome to engage in meaningful exchanges. This is a versatile tool suitable for both novice and experienced traders.
█ Introduction and How it is Different
Unlike traditional strategies that rely solely on price or volume indicators, this approach combines Bull Bear Power (BBP) with volume percentile analysis to identify optimal entry and exit points. It features a dynamic take-profit mechanism based on ATR (Average True Range) multipliers adjusted by volume and percentile factors, ensuring adaptability to diverse market conditions. This multifaceted strategy not only improves signal accuracy but also optimizes risk management, distinguishing it from conventional trading methods.
BTCUSD 6hr performance
Disable the visualization of Bull Bear Power (BBP) to clearly view the Z-Score.
█ Strategy, How it Works: Detailed Explanation
The BBP Strategy with Volume-Percentile TP utilizes several interconnected components to analyze market data and generate trading signals. Here's an overview with essential equations:
🔶 Core Indicators and Calculations
1. Exponential Moving Average (EMA):
- **Purpose:** Smoothens price data to identify trends.
- **Formula:**
EMA_t = (Close_t * (2 / (lengthInput + 1))) + (EMA_(t-1) * (1 - (2 / (lengthInput + 1))))
- Usage: Baseline for Bull and Bear Power.
2. Bull and Bear Power:
- Bull Power: `BullPower = High_t - EMA_t`
- Bear Power: `BearPower = Low_t - EMA_t`
- BBP:** `BBP = BullPower + BearPower`
- Interpretation: Positive BBP indicates bullish strength, negative indicates bearish.
3. Z-Score Calculation:
- Purpose: Normalizes BBP to assess deviation from the mean.
- Formula:
Z-Score = (BBP_t - bbp_mean) / bbp_std
- Components:
- `bbp_mean` = SMA of BBP over `zLength` periods.
- `bbp_std` = Standard deviation of BBP over `zLength` periods.
- Usage: Identifies overbought or oversold conditions based on thresholds.
🔶 Volume Analysis
1. Volume Moving Average (`vol_sma`):
vol_sma = (Volume_1 + Volume_2 + ... + Volume_vol_period) / vol_period
2. Volume Multiplier (`vol_mult`):
vol_mult = Current Volume / vol_sma
- Thresholds:
- High Volume: `vol_mult > 2.0`
- Medium Volume: `1.5 < vol_mult ≤ 2.0`
- Low Volume: `1.0 < vol_mult ≤ 1.5`
🔶 Percentile Analysis
1. Percentile Calculation (`calcPercentile`):
Percentile = (Number of values ≤ Current Value / perc_period) * 100
2. Thresholds:
- High Percentile: >90%
- Medium Percentile: >80%
- Low Percentile: >70%
🔶 Dynamic Take-Profit Mechanism
1. ATR-Based Targets:
TP1 Price = Entry Price ± (ATR * atrMult1 * TP_Factor)
TP2 Price = Entry Price ± (ATR * atrMult2 * TP_Factor)
TP3 Price = Entry Price ± (ATR * atrMult3 * TP_Factor)
- ATR Calculation:
ATR_t = (True Range_1 + True Range_2 + ... + True Range_baseAtrLength) / baseAtrLength
2. Adjustment Factors:
TP_Factor = (vol_score + price_score) / 2
- **vol_score** and **price_score** are based on current volume and price percentiles.
Local performance
🔶 Entry and Exit Logic
1. Long Entry: If Z-Score crosses above 1.618, then Enter Long.
2. Short Entry: If Z-Score crosses below -1.618, then Enter Short.
3. Exiting Positions:
If Long and Z-Score crosses below 0:
Exit Long
If Short and Z-Score crosses above 0:
Exit Short
4. Take-Profit Execution:
- Set multiple exit orders at dynamically calculated TP levels based on ATR and adjusted by `TP_Factor`.
█ Trade Direction
The strategy determines trade direction using the Z-Score from the BBP indicator:
- Long Positions:
- Condition: Z-Score crosses above 1.618.
- Short Positions:
- Condition: Z-Score crosses below -1.618.
- Exiting Trades:
- Long Exit: Z-Score drops below 0.
- Short Exit: Z-Score rises above 0.
This approach aligns trades with prevailing market trends, increasing the likelihood of successful outcomes.
█ Usage
Implementing the BBP Strategy with Volume-Percentile TP in TradingView involves:
1. Adding the Strategy:
- Copy the Pine Script code.
- Paste it into TradingView's Pine Editor.
- Save and apply the strategy to your chart.
2. Configuring Settings:
- Adjust parameters like EMA length, Z-Score thresholds, ATR multipliers, volume periods, and percentile settings to match your trading preferences and asset behavior.
3. Backtesting:
- Use TradingView’s backtesting tools to evaluate historical performance.
- Analyze metrics such as profit factor, drawdown, and win rate.
4. Optimization:
- Fine-tune parameters based on backtesting results.
- Test across different assets and timeframes to enhance adaptability.
5. Deployment:
- Apply the strategy in a live trading environment.
- Continuously monitor and adjust settings as market conditions change.
█ Default Settings
The BBP Strategy with Volume-Percentile TP includes default parameters designed for balanced performance across various markets. Understanding these settings and their impact is essential for optimizing strategy performance:
Bull Bear Power Settings:
- EMA Length (`lengthInput`): 21
- **Effect:** Balances sensitivity and trend identification; shorter lengths respond quicker but may generate false signals.
- Z-Score Length (`zLength`): 252
- **Effect:** Long period for stable mean and standard deviation, reducing false signals but less responsive to recent changes.
- Z-Score Threshold (`zThreshold`): 1.618
- **Effect:** Higher threshold filters out weaker signals, focusing on significant market moves.
Take Profit Settings:
- Use Take Profit (`useTP`): Enabled (`true`)
- **Effect:** Activates dynamic profit-taking, enhancing profitability and risk management.
- ATR Period (`baseAtrLength`): 20
- **Effect:** Shorter period for sensitive volatility measurement, allowing tighter profit targets.
- ATR Multipliers:
- **Effect:** Define conservative to aggressive profit targets based on volatility.
- Position Sizes:
- **Effect:** Diversifies profit-taking across multiple levels, balancing risk and reward.
Volume Analysis Settings:
- Volume MA Period (`vol_period`): 100
- **Effect:** Longer period for stable volume average, reducing the impact of short-term spikes.
- Volume Multipliers:
- **Effect:** Determines volume conditions affecting take-profit adjustments.
- Volume Factors:
- **Effect:** Adjusts ATR multipliers based on volume strength.
Percentile Analysis Settings:
- Percentile Period (`perc_period`): 100
- **Effect:** Balances historical context with responsiveness to recent data.
- Percentile Thresholds:
- **Effect:** Defines price and volume percentile levels influencing take-profit adjustments.
- Percentile Factors:
- **Effect:** Modulates ATR multipliers based on price percentile strength.
Impact on Performance:
- EMA Length: Shorter EMAs increase sensitivity but may cause more false signals; longer EMAs provide stability but react slower to market changes.
- Z-Score Parameters:*Longer Z-Score periods create more stable signals, while higher thresholds reduce trade frequency but increase signal reliability.
- ATR Multipliers and Position Sizes: Higher multipliers allow for larger profit targets with increased risk, while diversified position sizes help in securing profits at multiple levels.
- Volume and Percentile Settings: These adjustments ensure that take-profit targets adapt to current market conditions, enhancing flexibility and performance across different volatility environments.
- Commission and Slippage: Accurate settings prevent overestimation of profitability and ensure the strategy remains viable after accounting for trading costs.
Conclusion
The BBP Strategy with Volume-Percentile TP offers a robust framework by combining BBP indicators with volume and percentile analyses. Its dynamic take-profit mechanism, tailored through ATR adjustments, ensures that traders can effectively capture profits while managing risks in varying market conditions.

Fibonacci Retracement Strategy for CryptoThe Enhanced Fibonacci Retracement Strategy is designed to help traders capitalize on key Fibonacci levels for both long and short trades. This script automatically identifies significant swing highs and lows within a customizable lookback period and dynamically plots Fibonacci retracement levels (0%, 23.6%, 38.2%, 50%, 61.8%, 78.6%, and 100%) as support and resistance levels.
Key Features:
Automatic Fibonacci Levels:
The script identifies the highest high and lowest low over a user-defined lookback period to calculate Fibonacci retracement levels.
Dual-Directional Trading:
Long Trades: Triggered when the price crosses above the 61.8% retracement level, anticipating a reversal.
Short Trades: Triggered when the price crosses below the 38.2% retracement level, capturing potential downward movement.
Compact Line Option:
Users can toggle "Compact Fibonacci Lines" to reduce visual clutter on the chart, making the lines shorter and easier to interpret.
Dynamic Alerts:
Alerts are embedded directly into the strategy logic for entry and exit points.
Long Entry: Triggered when the price bounces above the 61.8% level.
Long Exit: Triggered when the price reaches the 23.6% level.
Short Entry: Triggered when the price crosses below the 38.2% level.
Short Exit: Triggered when the price reaches the 78.6% level.
Clear Visualization:
Fibonacci levels are plotted with distinct colors and dashed lines (optional compact view),
providing traders with clear and actionable levels to make decisions.
Inputs:
Lookback Period: Number of candles to calculate swing highs and lows.
Plot Fibonacci Levels: Toggle to enable/disable plotting levels.
Compact Fibonacci Lines: Reduce the length of Fibonacci lines for a cleaner chart.
How It Works:
The strategy identifies a high-low range within the lookback period.
Fibonacci levels are calculated based on the range and plotted on the chart.
Long Trade Example:
Enter when the price crosses above the 61.8% level.
Exit when the price reaches the 23.6% level.
Short Trade Example:
Enter when the price crosses below the 38.2% level.
Exit when the price reaches the 78.6% level.
Best Use Cases:
Trending Markets: Use retracements to time entries in the direction of the trend.
Range-Bound Markets: Identify and trade reversals near key Fibonacci levels.
Important Notes:
This strategy is not financial advice and should be backtested thoroughly before live trading.
Risk management is crucial! Consider using stop-loss orders for protection.
Customize inputs to suit your preferred timeframe and trading style.

Enhanced Gold Scalping Strategy (Backtest with Time Filter)Enhanced Gold Scalping Strategy (Backtest with Time Filter)
This script is a scalping strategy designed specifically for trading gold on lower timeframes, incorporating popular technical indicators and a session filter for optimal performance. The strategy aims to achieve consistency by combining trend-following and volatility-based conditions.
Key Features:
Indicators Used:
Exponential Moving Average (EMA): Filters trades based on the trend direction using a 50-period EMA.
Relative Strength Index (RSI): Ensures trades are taken in favorable momentum conditions (above 30 for longs and below 70 for shorts).
MACD Crossover: Identifies potential trade entries based on MACD line crossing above/below the signal line.
Average True Range (ATR): Used to dynamically calculate Stop Loss and Take Profit levels and ensure trades occur in high-volatility conditions.
Risk-Reward Optimization:
The strategy uses a customizable Risk-Reward Ratio (default is 2:1) for setting Stop Loss (SL) and Take Profit (TP) levels, ensuring that winning trades outweigh losses.
Volatility Filter:
Trades are only executed when the current ATR exceeds the 14-period ATR moving average by a defined threshold, filtering out low-volatility periods.
Session Filter:
The strategy only trades during active market hours (8:00 AM to 8:00 PM Amsterdam Time) on weekdays. This ensures trades align with periods of high liquidity and market activity.
Dynamic Entry and Exit Levels:
SL and TP levels are plotted dynamically on the chart to provide a clear visual of potential risk and reward for each trade.
Buy and Sell Signals:
Visual markers (green triangles for buy, red triangles for sell) on the chart to highlight entry points for better trade visibility.
How It Works:
Long Conditions:
MACD crossover (MACD line above the signal line).
RSI above 30.
Price is above the 50-period EMA.
ATR-based volatility condition is met.
Trade must occur within the defined session hours.
Short Conditions:
MACD crossunder (MACD line below the signal line).
RSI below 70.
Price is below the 50-period EMA.
ATR-based volatility condition is met.
Trade must occur within the defined session hours.
The strategy calculates dynamic SL and TP levels based on the ATR, ensuring flexibility to market conditions.
Customization Options:
EMA length, RSI length, and MACD parameters.
Risk-Reward Ratio for SL/TP calculations.
Volatility threshold for filtering trades.
Session start and end times for active trading hours.
Recommended Use:
Best suited for scalping gold on lower timeframes (15-min charts).
Disclaimer:
This strategy is intended for educational and backtesting purposes. Past performance is not indicative of future results. Use appropriate risk management and test thoroughly before applying to live trading.

EMA SHIFT & PARALLEL [n_dot]BINANCE:ETHUSDT.P
This strategy was developed for CRYPTO FUTURES, (the settings for ETHUSDT.P) . I aimed for the strategy to function in a live environment, so I focused on making its operation realistic:
When determining the position, only 80% (adjustable) of the available cash is invested to reduce the risk of position liquidation.
I account for a 0.05% commission, typical on the futures market, for each entry and exit.
Concept:
I modified a simple, well-known method: the crossover of two exponential moving averages (FAST, SLOW) generates the entry and exit signals.
I enhanced the base idea as follows:
For the fast EMA, I incorporated a multiplier (offset) to filter out market noise and focus only on strong signals.
I use different EMAs for long and short entry points; both have their own FAST and SLOW EMAs and their own offset. For longs, the FAST EMA is adjusted downward (<1), while for shorts, it is adjusted upward (>1). Consequently, the signal is generated when the modified FAST EMA crosses the SLOW EMA.
Risk Management:
The position includes the following components:
Separate stop-losses for long and short positions.
Separate trailers for long and short positions.
The strategy operates so that the entry point is determined by the EMA crossover, while the exit is governed only by the Stop Loss or Trailer. Optionally, it can be set to close the position at the EMA recrossing ("Close at Signal").
Trailer Operation:
An entry percentage and offset are defined. The trailer activates when the price surpasses the entry price, calculated automatically by the system.
The trailer closes the position when the price drops by the offset percentage from the highest reached price.
Example for trailer:
Purchase Price = 100
Trailer Enter = 5% → Activation Price = 105 (triggers trailer if market price crosses it).
Trailer Offset = 2%
If the price rises to 110, the exit price becomes 107.8.
If the price goes to 120, the exit price becomes 117.6.
If the price falls below 117.6, the trailer closes the position.
Settings:
Source: Determines the market price reference.
End Close: Closes positions at the end of the simulation to avoid "shadow positions" and provide an objective result.
Lot proportional to free cash (%): Only a portion of free cash is invested to meet margin requirements.
Plot Short, Plot Long: Simplifies displayed information by toggling indicator lines on/off.
Long Position (toggleable):
EMA Fast ws: Window size for FAST EMA.
EMA Slow ws: Window size for SLOW EMA.
EMA Fast down shift: Adjustment factor for FAST EMA.
Stop Loss long (%): Percent drop to close the position.
Trailer enter (%): Percent above the purchase price to activate the trailer.
Trailer offset (%): Percent drop to close the position.
Short Position (toggleable):
EMA Fast ws: Window size for FAST EMA.
EMA Slow ws: Window size for SLOW EMA.
EMA Fast up shift: Adjustment factor for FAST EMA.
Stop Loss short (%): Percent rise to close the position.
Trailer enter (%): Percent below the purchase price to activate the trailer.
Trailer offset (%): Percent rise to close the position.
Operational Framework:
If in a long position and a short EMA crossover occurs, the strategy closes the long and opens a short (flip).
If in a short position and a long EMA crossover occurs, the strategy closes the short and opens a long (flip).
A position can close in three ways:
Stop Loss
Trailer
Signal Recrossing
If none are active, the position remains open until the end of the simulation.
Observations:
Shifts significantly deviating from 1 increase overfitting risk. Recommended ranges: 0.96–0.99 (long) and 1.01–1.05 (short).
The strategy's advantage lies in risk management, crucial in leveraged futures markets. It operates with relatively low DrawDown.
Recommendations:
Bullish Market: Higher entry threshold (e.g., 6%) and larger offset (e.g., 3%).
Volatile/Sideways Market: Tighter parameters (e.g., 3%, 1%).
The method is stable, and minor parameter adjustments do not significantly impact results, helping assess overfitting: if small changes lead to drastic differences, the strategy is over-optimized.
EMA Settings: Adjust FAST and SLOW EMAs based on the asset's volatility and cyclicality.
On the crypto market, especially in the Futures market, short time periods (1–15 minutes) often show significant noise, making patterns/repetitions hard to identify. I recommend setting the interval to at least 1 hour.
I hope this contributes to your success!

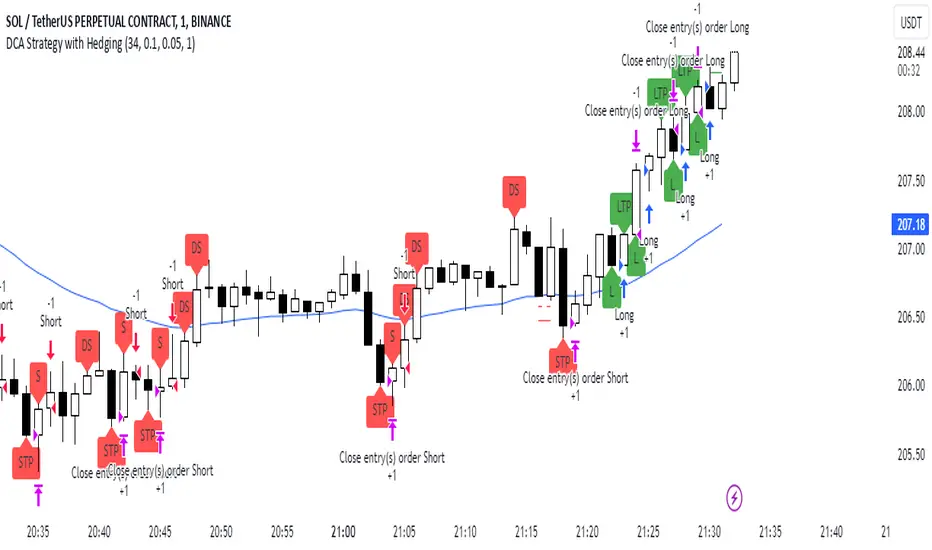
DCA Strategy with HedgingThis strategy implements a dynamic hedging system with Dollar-Cost Averaging (DCA) based on the 34 EMA. It can hold simultaneous long and short positions, making it suitable for ranging and trending markets.
Key Features:
Uses 34 EMA as baseline indicator
Implements hedging with simultaneous long/short positions
Dynamic DCA for position management
Automatic take-profit adjustments
Entry confirmation using 3-candle rule
How it Works
Long Entries:
Opens when price closes above 34 EMA for 3 candles
Adds positions every 0.1% price drop
Takes profit at 0.05% above average entry
Short Entries:
Opens when price closes below 34 EMA for 3 candles
Adds positions every 0.1% price rise
Takes profit at 0.05% below average entry
Settings
EMA Length: Controls the EMA period (default: 34)
DCA Interval: Price movement needed for additional entries (default: 0.1%)
Take Profit: Profit target from average entry (default: 0.05%)
Initial Position: Starting position size (default: 1.0)
Indicators
L: Long Entry
DL: Long DCA
S: Short Entry
DS: Short DCA
LTP: Long Take Profit
STP: Short Take Profit
Alerts
Compatible with all standard TradingView alerts:
Position Opens (Long/Short)
DCA Entries
Take Profit Hits
Note: This strategy works best on lower timeframes with high liquidity pairs. Adjust parameters based on asset volatility.
[3Commas] DCA Bot TesterDCA Bot Tester
🔷What it does: A tool designed to simulate the behavior of a Dollar Cost Averaging (DCA) strategy based on input signals from a source indicator. Additionally, it enables you to send activation signals to 3Commas Bots via TradingView webhooks.
🔷Who is it for: This tool is ideal for those who want a visual representation and strategy report of how a DCA Bot would perform under specific conditions. By adjusting the parameters, you can assess whether the strategy aligns with your risk/reward expectations before implementation, helping you save time and protect your capital.
🔷How does it work: The tool leverages a pyramiding function to simulate price averaging, mimicking how a DCA Bot operates. It calculates volume-based averaging and, upon reaching the target, closes the positions. Conversely, if the target isn't reached, a Stop Loss is triggered, potentially resulting in significant losses if improperly configured.
🔷Why It’s Unique
Easy visualization of DCA Bot entry and exit points according to user preferences.
DCA Bot Summary table same as the one shown in the new 3Commas interface.
Use plots from other indicators as Entry Trigger Source, with a small modification of the code.
Option to Review message format before sending Signals to 3Commas. Compatibility with Multi-Pair, and futures contract pairs.
Option to filter signals by session and day according to the user’s timezone.
👉 Before continuing with the explanation of the tool, please take a few minutes to read this information, paying special attention to the risks of using DCA strategies.
DCA Bot: What is it, how does it work, and what are its advantages and risks?
A DCA Bot is an automated tool designed to simplify and optimize your trading operations, particularly in cryptocurrencies. Based on the concept of Dollar Cost Averaging (DCA) , this bot implements scaled strategies that allow you to distribute your investments intelligently. The key lies in dividing your capital into multiple orders, known as base orders and safety orders, which are executed at different price levels depending on market conditions.
These bots are highly customizable, meaning you can adapt them to your goals and trading style, whether you're operating Long (expecting a price increase) or Short (expecting a price decrease). Their primary purpose is to reduce the impact of entries that move against the estimated direction and ensure you achieve a more favorable average price.
🔸 Key Features of DCA Bots
Customizable configuration: DCA bots allow you to adjust the size of your initial investment, the number of safety orders, and the price levels at which these orders execute. These orders can be equal or incremental, depending on your risk tolerance.
Scaled safety orders: If the asset's price moves against your position, the bot executes safety orders at strategic levels to average your entry price and increase your chances of closing in profit.
Automatic Take Profit: When the predefined profit level is reached, the bot closes the position, ensuring net gains by averaging all entries made using the DCA strategy.
Stop Loss option: To protect your capital, you can set a stop loss level that limits losses if the market moves drastically against your position.
Flexibility: Bots can integrate with 3Commas technical indicators or external signals from TradingView, allowing you to trade in any trend, whether bullish or bearish.
Support for multiple assets: You can trade cryptocurrency pairs and exchanges compatible with 3Commas, offering a wide range of possibilities to diversify your strategies.
✅ Advantages of DCA Bots
Time-saving automation: DCA bots eliminate the need for constant market monitoring, executing your trades automatically and efficiently based on predefined settings.
Favorable averages in volatile markets: By averaging your entries, the bot can offer more competitive prices even under adverse market conditions. This increases your chances of recovering a position and closing it profitably.
Advanced capital management: With customizable settings, you can adjust the size of base and safety orders to optimize capital usage and reduce risk.
Additional protection: The ability to set a stop loss ensures your losses are limited, safeguarding your capital in extreme scenarios.
⚠️ Risks of Using a DCA Bot
Requires significant capital: Safety orders can accumulate quickly if the price moves against your position. This issue is compounded if increasing amounts are used for safety orders, which can immobilize large portions of capital in adverse markets.
Markets lacking clear direction: During consolidation periods or erratic movements, the bot may generate unrealized losses and make position recovery difficult.
Opportunity cost: Investing in an asset that doesn't show favorable behavior can prevent you from seizing opportunities in other markets.
Emotional pressure: Large investments in advanced stages of the DCA strategy can cause stress, especially if an asset takes too long to reach your take profit level.
Dependence on market recovery: DCA assumes that the price will eventually move in your favor, which does not always happen, especially in assets without solid fundamentals.
📖 Key Considerations for Effectively Using a DCA Bot
Use small amounts for your base and safety orders: Setting small initial orders not only limits capital usage but also allows you to manage multiple bots simultaneously, maximizing portfolio diversification.
Capital management: Define a clear budget and never risk more than you are willing to lose. This is essential for maintaining sustainable operations.
Select assets with strong fundamentals: Apply DCA to assets you understand and that have solid fundamentals and a proven historical growth record. Additionally, analyze each cryptocurrency's fundamentals: What problem does it solve? Does it have a clear use case? Is it viable in the long term? These questions will help you make more informed decisions.
Diversification: Do not concentrate all your capital on a single asset or strategy. Spread your risk across multiple bots or assets.
Monitor regularly: While bots are automated and eliminate the need to monitor the market constantly, it is essential to monitor the bots themselves to ensure they are performing as expected. This includes reviewing their performance and making adjustments if market conditions change. Remember, the goal is to automate trades, but active bot management is crucial to avoid surprises.
A DCA Bot is a powerful tool for traders looking to automate their strategies and reduce the impact of market fluctuations. However, like any tool, its success depends on how it is configured and used. By applying solid capital management principles, carefully selecting assets, and using small amounts in your orders, you can maximize its potential and minimize risks.
🔷FEATURES & HOW TO USE
🔸Strategy: Here you must select the type of signal you are going to analyze and send signals to the DCA Bot, either Long for buy signals or Short for sell signals. This must match the Bot created in 3Commas.
🔸Add a Source Indicator for Entry Triggers
Tradingview allows us to use indicator plots as a source in other indicators, we will use this functionality so that the buy or sell signals of an indicator are processed by the DCA Bot Tester.
In this EXAMPLE we will use a simple strategy that uses a Donchian Channel (DC) and an Exponential Moving Average (EMA).
Trigger to buy or long signal will be when: the price closes above the previous upper level and the average of the upper and lower level (basis) is greater than the EMA.
Trigger sell or short signal will be when: the price closes below the previous lower level and the average of the upper and lower level (basis) is less than the EMA.
trigger_buy = ta.crossover (close,upper ) and basis > ema and barstate.isconfirmed
trigger_sell = ta.crossunder(close,lower ) and basis < ema and barstate.isconfirmed
Then we create the plots that will be used as input source in the DCA Bot Tester indicator.
When a buy condition is given the plot "🟢 Trigger Buy" will have a value of 1 otherwise it will remain at 0.
When a sell condition is given the plot "🔴 Trigger Sell" will have a value of -1 otherwise it will remain at 0.
plot(trigger_buy ? 1 : 0 , '🟢 Trigger Buy' , color = na, display = display.data_window)
plot(trigger_sell? -1 : 0 , '🔴 Trigger Sell', color = na, display = display.data_window)
Here you have the complete code so you can use it and do tests. Basically you just have to define the buy or sell conditions of your preferred indicator or strategy and then create the plots with the same format that will be used in DCA Bot Tester.
//@version=6
indicator(title="Simple Strategy Example", overlay= false)
// Indicator and Signal Triggers
length = input.int(10, title = "DC Length" , display = display.none)
length_ema = input.int(50, title = "EMA Length", display = display.none)
lower = ta.lowest (length)
upper = ta.highest(length)
ema = ta.ema (close, length_ema)
basis = math.avg (upper, lower)
plot(basis, "Basis", color = color.orange, display = display.all-display.status_line)
plot(upper, "Upper", color = color.blue , display = display.all-display.status_line)
plot(lower, "Lower", color = color.blue , display = display.all-display.status_line)
plot(ema , "EMA" , color = color.red , display = display.all-display.status_line)
candlecol = open < close ? color.teal : color.red
plotcandle(open, high, low, close, title='Candles', color = candlecol, wickcolor = candlecol, bordercolor = candlecol, display = display.pane)
trigger_buy = ta.crossover (close,upper ) and basis > ema and barstate.isconfirmed
trigger_sell = ta.crossunder(close,lower ) and basis < ema and barstate.isconfirmed
plotshape(trigger_buy ?close:na, title="Label Buy" , style=shape.labelup , location= location.belowbar, color=color.green, text="B", textcolor=color.white, display=display.pane)
plotshape(trigger_sell?close:na, title="Label Sell", style=shape.labeldown, location= location.abovebar, color=color.red , text="S", textcolor=color.white, display=display.pane)
// ――――――――――――――――――――――――――――――――――――――――――――――――――――――――――――――――――――――――――――――――――――――――――――――――――――――――――――――――――――
// 👇 Plots to be used in the DCA Bot Indicator as source triggers.
// ――――――――――――――――――――――――――――――――――――――――――――――――――――――――――――――――――――――――――――――――――――――――――――――――――――――――――――――――――――
plot(trigger_buy ? 1 : 0 , '🟢 Trigger Buy' , color = na, display = display.data_window)
plot(trigger_sell? -1 : 0 , '🔴 Trigger Sell', color = na, display = display.data_window)
To use the example code
Open the Pine Editor, paste the code and then click Add to chart.
Then in the Plot Entry Trigger Source option, we will select 🟢 Trigger Buy, as the plot that will give us the buy signals when it is worth 1, otherwise for the sell signals you must change the value to -1 in the Plot Entry Trigger Value and remember to change the strategy mode to Short.
🔸DCA Settings: Here you need to configure the DCA values of the strategy, you can see the meaning of each value in the Settings Section. Once you are satisfied with the tests configure the 3Commas DCA Bot with the same values so that the Summary Table matches the 3Commas Table. Pay close attention to the Total Volume that the Bot will use, according to the amount of Safety Orders you are going to execute, and that all the values in the table adapt to your risk tolerance.
🔸DCA Bot Deal Start: Once you create the Bot in 3Commas with the same settings it will give you a Deal Start Message, you must copy and paste it in this section, verify that it is the same in the summary table, this is used to be sent through tradingview alerts to the Bot and it can process the signals.
🔸DCA Bot Multi-Pair: A Multi-Pair Bot allows you to manage several pairs with a single bot, but you must specify which pair it will run on. You must activate it if you want to use the signals in a DCA Bot Multi-pair. In the text box you must enter (using the 3Commas format) the symbol for each pair before you create the alert so that the bot understands which pair to work on.
In the following image we would be configuring the indicator to send a signal to activate the bot in the BTCUSDT pair using the given format it would be USDT_BTC, but if we wanted to send a signal in another pair we must change the pair in the chart and also in the configuration, an example with ETHUSDT would be USDT_ETH. After this we could create the alert, and the Mult-Pair Bot would detect it correctly.
🔸Strategy Tester Filters: This is useful if you want to test the strategy's result on a certain time window, the indicator will only enter this range. If disabled it will use all historical data available on the chart. If you are going to use the tool to send signals, make sure to disable the Use Custom Test Period. If you want the entries to only run at a certain time and day, in that case make sure that the timezone matches the one you are using in the chart.
🔸Properties: Adjust your initial capital and exchange commission appropriately to achieve realistic results.
🔸Create alerts to trigger the DCA Bot
Check that the message is the same as the one indicated by the DCA Bot.
In the case of Multi-Pair, enable the option to add the symbol with the correct format.
When creating an alert, select Any alert() function call.
Enter the any name of the alert.
Open the Notifications tab and enable Webhook URL
Paste Webhook URL provided by 3Commas looking in the section How to use TradingView custom signals.
Done, alerts will be sent with the correct format automatically to 3Commas.
🔷 INDICATOR SETTINGS
🔸3Commas DCA Bot Settings
Strategy: Select the direction of the strategy to test Long or Short, this must be the same as the Bot created in 3Commas, so that the signals are processed properly.
DCA Bot Deal Start: Copy and paste the message for the deal start signal of the DCA Bot you created in 3Commas. This is the message that will be sent with the alert to the Bot, you must verify that it is the same as the 3Commas bot so that it can process properly so that it executes and starts the trade.
DCA Bot Multi-Pair: A Multi-Pair Bot allows you to manage several pairs with a single bot, but you must specify which pair it will run on.
DCA Bot Summary Table: Here you can activate the display of table as well as change the size, position, text color and background color.
🔸Source Indicator Settings
Plot Entry Trigger Source: Select a Plot for Entries of the Source Indicator. This refers to the Long or Short entry signal that the indicator will use as BO (Base Order).
Plot Entry Trigger Value: Value of the Source Indicator to Deal Start Condition Trigger. The default value is 1, this means that when a signal is given for example Long in the source indicator, we will use 1 or for Short -1 if there is no signal it will be 0 so it will not execute any entry, please review the example code and adjust the indicator you are going to use in the same way.
🔸DCA Settings
Base Order: The Base Order is the first order the bot will create when starting a new deal.
Safety Order: Enter the amount of funds your safety orders will use to average the cost of the asset being traded.Safety orders are also known as Dollar Cost Averaging and help when prices move in the opposite direction to your bot's take profit target.
Safety Orders Deviation %: Enter the percentage difference in price to create the first Safety Order. All Safety Orders are calculated from the price the initial Base Order was filled on the exchange account.
Safety Orders Max Count: This is the total number of Safety Orders the bot is allowed to use per deal that is opened. All Safety Orders created by the bot are placed as Limit Orders on the exchange's order book.
Safety Orders Volume Scale: The Safety Order Volume Scale is used to multiply the amount of funds used by the last Safety Order that was created. Using a larger amount of funds for Safety Orders allows your bot to be more aggressive at Dollar Cost Averaging the price of the asset being traded.
Safety Orders Step Scale: The Safety Order Step Scale is used to multiply the Price Deviation percentage used by the last Safety Order placed on the exchange account. Using a larger value here will reduce the amount of Safety Orders your bot will require to cover a larger move in price in the opposite direction to the active deal's take profit target.
Take Profit %: The Take Profit section offers tools for flexible management of target parameters: automatic profit upon reaching one or more target levels in percentage.
Stop Loss % | Use SL: To enable Stop Loss, please check the "Use SL" box. This is the percentage that price needs to move in the opposite direction to close the deal at a loss. This must be greater than the sum of the deviations from the safety orders.
🔸Strategy Tester Filters
Use Custom Test Period: When enabled signals only works in the selected time window.. If disabled it will use all historical data available on the chart.
Test Start and End: Once the Custom Test Period is enabled, here you select the start and end date that you want to analyze.
Session Filter | Days | Background: Here you can choose a time zone in which signals will be sent or your strategy will be tested, as well as the days and a background of it. It is important that you use the same timezone as your chart so that it matches.
👨🏻💻💭 If this tool helps you, don’t forget to give it a boost! Feel free to share in the comments how you're using it or if you have any questions.
_________________________________________________________________
The information and publications within the 3Commas TradingView account are not meant to be and do not constitute financial, investment, trading, or other types of advice or recommendations supplied or endorsed by 3Commas and any of the parties acting on behalf of 3Commas, including its employees, contractors, ambassadors, etc.

PSE, Practical Strategy EnginePSE, Practical Strategy Engine
A ready-to-use engine that is simple to connect your indicator to, simple to use, and effective at generating alerts for order-filled events during the real-time candle.
Great for
• Evaluating indicators on important metrics without the need to write a strategy script for backtesting.
• Using indicators with built-in risk management.
About The PSE
This engine accepts entry and exit signals from your indicator to provide trade signals for both long and short positions. The PSE was written for trading Funds (e.g. ETF’s), Stocks, Forex, Futures, and Cryptocurrencies. The trades on the chart indicate market, limit, and stop orders. The PSE allows for backtesting of trades along with metrics of performance based on trade-groups with many great features.
Note: A link to a video of how to connect your indicator(s) to the PSE is provided below.
Key Features
Trade-Grp’s
A Trade-Grp makes up one or more trade positions from the first position entering to the last position exiting. Using Trade-Grp’s instead of positions should help you better assess if the metric results fit your trading style.
Below are two (2) examples of a Trade-Grp with three (3) positions.
Metrics
A table of metrics is available if the “Show Metrics Table” checkbox is enabled on the Inputs tab, but metrics always show in the Data Window.
Examples of the Metrics Table are shown below.
• ROI (Return on Investment) and CAGR (Compound Annual Growth Rate) are based on the Avg Invest/Trade-Grp and are adjusted for dividends if the “Include Dividends in Profit” checkbox is enabled.
• Profit/Risked is based on Trade-Grp’s. Also known as reward/risk, as well as expectancy per amount risked. It determines the effectiveness of your strategy and provides a measure of comparison between your strategies. This is adjusted for dividends if the “Include Dividends in Profit” checkbox is enabled. In the Data Window the color is green when above the breakeven point of making a profit and red when below the breakeven point. In the Table the color is red if below the breakeven point, otherwise it is the default color. For example, using the 3 metrics tables above:
For every USD risked the profit is 1.709 USD.
For every BTC risked the profit is 0.832 BTC.
For every JPY risked the profit is 0.261 JPY.
• Winning % is based on Trade-Grp’s. In the Data Window the color is green when above the breakeven point of making a profit and red when below the breakeven point. In the Table the color is red if below the breakeven point, otherwise it is the default color.
The breakeven point is a relationship between the Profit/Risked and Winning % to indicate system profitability potential. Another way to assess trading system performance. For example, for a low Winning % a high Profit/Risked is needed for the system to be potentially profitable.
• Profit Factor (PF) is based on Trade-Grp’s. The dividend payment, if any, is not considered in the calculation of a win or loss. The “Include Dividends in Profit Factor” checkbox allows you the option to either include or not include dividends in the calculation of Profit Factor. The default is enabled.
Must enable the “Include Dividends in Profit” checkbox to include dividends in PF.
Including dividends in PF evaluates the trading strategy with a more overall profitability performance view.
Enable/Disable “Include Dividends in Profit Factor” checkbox also affects the Avg Trade-Grp Loss, and thus Equity Loss from ECL and % Equity Loss from ECL.
• Max Consecutive Losses are based on Trade-Grp’s.
• Nbr of Trade-Grp’s and Nbr of Positions.
These help you to determine if enough trades have occurred to validate your strategy. The Nbr of Positions is the count of positions on the chart. The TV list of trades in the Strategy Tester may indicate more than what is actually shown on the chart. The Data Window includes 'Nbr Strat Tester Trades', which equals the TV listing trades, to help you locate specific trades on the chart.
• Time in Market (%) is based on Trade-Grp’s and date range selected.
• Avg Invest/Trade-Grp will indicate the average amount of money invested in a Trade-Grp. This is adjusted for dividends if the “Include Dividends in Profit” checkbox is enabled.
• Equivalent Consecutive Losses, labeled as Equiv. Cons. Losses (ECL).
This value is determined by the Winning % and Nbr of Trade-Grp’s. This simulates the more likely case of a series of losses, then a small win, then another series of losses to form an equivalent consecutive losing streak. To lower the value, increase the Winning %.
• Equity Loss from ECL is the equity loss from the equivalent consecutive losses.
• % Equity Loss from ECL is the percent of equity loss from the equivalent consecutive losses.
Risk Management
• Pyramid rules enforce and maintain position sizing designated by you on the Inputs tab (% Equity to Risk, Up/Dwn Gap) & Properties tab (number of pyramids, slippage, and commission).
A pyramid position will not occur unless both its stop covers the last entry price with gap/slippage and commission cost of previous trade is covered. If take profit is enabled, a pyramid position will not occur unless commission cost of the trade is covered when take profit target is reached.
• Position sizing, stop-loss (SL), trailing stop-loss (TSL), and take profit (TP) are used.
• Wash sale prevention for applicable assets is enforced. Wash sale assets include stock and fund (e.g. ETF’s).
• No more than one entry position per candle is enforced .
Other Great Features
• Losing Trade-Grp’s indicated at the exit with label text in the color blue. Used to easily find consecutive losses affecting your strategy’s performance. The dividend payment, if any, is not considered in the calculation of a win or loss.
• Position values can be displayed on the chart. The number format is based on the min tick value, but is limited to 8 decimal places only for display purposes.
• Dividends per share and the amount can be displayed on the chart.
• Hold Days . This is the number of days to hold before allowing the next Trade-Grp. Can be a decimal number. This feature may help those trading on a cash account to avoid any settlement violations when trading the same asset.
• Date Filter. Partition the time when trading is allowed to see if the strategy works well across the date range selected. The metrics should be acceptable across all four (4) time ranges: entire range, 1st half, IQR (inter-quartile range), and 2nd half.
• Price gap amount identification. Used in determining if a pyramid entry may be profitable, and may be used in determining slippage amount to use.
• When TP is enabled, the PSE will only allow a pyramid position if the potential is profitable based on commission and price gap selected.
• Trade-Grp’s shown in background color: green for long positions and red for short positions.
• The PSE will alert you to update your stop-loss as the market changes if your exchange/broker does not allow for trailing stop-loss orders. Enable this option on the Inputs tab with Alert Chg TSL.
• The PSE will alert you if your drawdown exceeds Max % Equity Drawdown set on the Inputs tab.
• The PSE will send an alert to warn you of an expiring GTC order.
Some brokers will indicate the order is GTC, Good 'Till Cancelled, but there really is a time limit on the order and is typically 60-120 days. Therefore, the PSE will alert you if you've been in position for close to 60 days so you can refresh your order. The alert is typically a few days before the 60-day time period.
• For order fill alerts just use a {{placeholder}} in the Message of the alert. Details on how to enter placeholders is explained below.
• Identify same bar enter/exit for first entries and pyramids. This is shown in the Data Window as well. This can help you determine what stop-loss % works best for your trading style.
• Leverage trading information is displayed in the Data Window and applies to Trade-Grps.
Failed PosSize or Margin (%): Shows a zero if the failed-to-trade position size was less than 1 or shows the margin % which failed to meet the margin requirement set in the Properties tab. A flag will show on the bar where a failed-to-trade occurred. This is only applicable to the first position of a Trade-Grp. Position the cursor over the flag for the value to show in the Data Window.
Notional Value: total Trade-Grp position size x latest entry price x point value. The equity must be > notional value x margin requirement for a trade to occur.
Current Margin (%): must be greater than margin requirement set on the Properties tab in order for a trade to occur.
Margin Call Price: when enabled on the Style tab is displayed on both the chart and the Data Window as shown below.
PSE Settings
Pyramids
• Pyramiding requires the Stop Method to be set to either TSL or Both (meaning SL & TSL).
• The maximum number of pyramids is determined by the value entered in the Properties tab.
• Pyramid orders require the enter price to be higher than the previous close for Longs and lower than the previous close for Shorts.
• Pyramids also require the stop with gap/slippage to be higher than the last entry price for Longs, and lower than the last entry price for Shorts. This covers all previous positions and maintains position sizing.
• When take profit, TP, is enabled, the pyramids also require that they will be profitable when opening a position assuming they will reach TP. This is automatically adjusted by you with the Dwn Gap/Up Gap, Slippage, and Commission settings.
Inputs Tab
General Settings
Color Traded Background
Enable to change background color where in a trade. Green for long positions and red for short positions.
Show Losing Trade-Grp
Enable to show if losing Trade-Grp and is indicated by text in blue color. The last position may be at a loss, but if there was profit for the Trade-Grp, then it will not be shown as a loss .
Show Position Values
Enable to show the currency value of each position in gold color.
Include Dividends in Profit
This feature is only applicable if the asset pays dividends and the time frame period of the chart is 1D or less, otherwise ignored. The PSE assumes dividends are taken as cash and not reinvested.
Enable to adjust ROI, CAGR, Profit/Risked, Avg Invest/Trade-Grp, and Equity to include dividend payments. This feature considers if you were in position at least one day prior to the ex-dividend date and had not exited until after the ex-dividend date.
When Show Dividends is enabled it will display the payout in currency/share, as well as the total amount based on the number of shares the position(s) of the Trade-Grp are currently holding.
Include Dividends in Profit Factor
This checkbox allows you the option to either include or not include dividends in the calculation of Profit Factor. Must enable the “Include Dividends in Profit” checkbox to include dividends in PF. The dividend payment, if any, is not considered in the calculation of a win or loss.
Show Metrics Table
Options are font size and table location.
Alert Failed to Trade
Enable for the strategy to alert you when a trade did not happen due to low equity or low order size. Applicable only for the first position of a Trade-Grp.
Trade Direction
Options are 'Longs Only', 'Both', 'Shorts Only'.
Hold Days
This is the number of days to hold before allowing the next Trade-Grp. Applies only to the first trade position of a Trade-Grp. Where a Trade-Grp consists of the first position plus any pyramid positions.
The value entered will be overwritten to >= 31 to prevent wash sale for applicable assets in the event the last Trade-Grp was a loss. Wash sale assets include stock and fund (i.e. ETF’s).
The minimum value is the equivalent of 1 candle and is automatically assigned by the PSE if the entered value is equivalent to less than one candle. To calculate Hold Days in # of candles on the Hour chart divide the chart period by 24 x #candles. On the Minute chart divide the chart period by 60 then by 24 x #candles.
Show Vertical Lines at From Date & To Date
Shows a vertical dotted line at the From Date and To Date for visual inspection of the setting.
Date Filter
When enabled, trades are allowed between the From Date and To Date, i.e., the date range.
When disabled, trades are allowed for all candles.
Partition the time when trading is allowed to see if your indicator settings work well across the date range. Click 1st Half, IQR (inter-quartile range), or 2nd Half buttons to trade a portion of the date range.
Select only one at-a-time to partition the time when trading is allowed.
When 1st Half is enabled only trades for the 1st half of the date range are allowed.
When IQR is enabled only trades for the inter-quartile date range are allowed.
When 2nd Half is enabled only trades for the 2nd half of the date range are allowed.
Position Sizing
The % of Equity to Risk has been separated into two (2) areas: for initial trades and for pyramid trades. This allows for greater ability to maximize profits within your acceptable drawdown. A variation of the Anti-Martingale method from the initial trade if you choose to use it in that manner.
% Equity to Risk for Initial Trades: enter the percent of equity you want to risk per position for the initial trades of each Trade-Grp. For example, for 1% enter 1.
% Equity to Risk for Pyramid Trades: enter the percent of equity you want to risk per position for the pyramid trades of each Trade-Grp. For example, for 2% enter 2.
% Equity for Max Position Size: the position size will not exceed this amount. For example, for 25% enter 25.
Max % Equity Drawdown Warning: an alert will be triggered if the maximum drawdown exceeds this v alue. For example, for 10% enter 10.
Stop Methods
NOTE: The Stop Method must be either Both or TSL in order for the pyramids to work. This feature enforces position sizing.
Stop-loss, SL, and trailing stop-loss, TSL, are other features that enforce risk management.
The trailing stop-loss, TSL, is activated immediately if Stop Method = TSL. If Stop Method = Both, then the TSL is activated when its value is above stop-loss, SL, for Longs and below the SL for Shorts.
The calculated TSL value (shown on the chart by + symbol) of the previous bar is used for the current bar and the plot value is off by default, but you can it turn on via the Style tab. This is available so you can better understand how the TSL value used was calculated from. It is beneficial to show when monitoring the real-time candle.
Alert Chg TSL
When enabled, this feature will alert you to update your stop price if it moves greater than the change amount in %. The amount is the absolute % so will work for both Longs and Shorts. For example, for 1% enter 1 . This is provided since some exchanges/brokers do not offer TSL orders and you must manually adjust as price action plays out.
The alert will also suggest a stop limit price based on the gap selected and explained below.
The alert will occur at the close of the candle at the calculated TSL value of the candle just prior to the real-time candle.
Dwn Gap/Up Gap Input Settings
A price gap is the difference between the closing price of the previous candle and the opening price of the current candle. Dwn Gap and Up Gap are illustrated here.
The values of the Dwn Gap and Up Gap can be seen in the Data Window and are based on the settings of the Date Filter.
The options are “zero gap”, "median gap", "avg gap", "80 pct gap", "90 pct gap". The X pct gap stands for X percentile rank. For example, "80 pct gap" means that 80% of the gaps are less than or equal to the value shown in the Data Window. Select “zero gap” to disable this feature.
If Show Stop Limit is enabled, it will show a dotted-line below or above the current stop price where a stop-limit order should be taken. It is shown based on the gap option selected. Again, the PSE trades market, limit, and stop orders, but a stop-limit may be shown if you wanted to see where one would be set using the Up/Dwn Gap.
Dwn Gap: Affects Short Take Profit, Long Pyramid Entries, and to show the Long Stop Limit.
Up Gap : Affects Long Take Profit, Short Pyramid Entries, and to show the Short Stop Limit.
Fixed Take Profit (TP)
When take profit (TP) is enabled, the PSE will determine if opening a pyramid position will be in profit assuming the TP will be hit while considering commission costs (on Properties tab).
The larger of Up Gap or Slippage value is used with Long positions regarding TP.
The larger of Dwn Gap or Slippage value is used with Short positions regarding TP.
Properties Tab
• Initial Capital: Set as desired.
• Base Currency: Leave as Default. The PSE is designed to use the instrument’s currency, therefore leave as Default.
• Order Size: Leave as default. This setting has been disabled and position sizing is handled on the Inputs tab and is based on % of equity.
• Pyramiding: Set as desired.
• Commission: Set as number %. The PSE is designed to only work with commission as a percent of the position value.
• Verify Price for Limit Orders: Set as desired.
Slippage
Adjust Slippage on the Properties tab to account for a realistic bid-ask spread. You can use one of Dwn/Up Gap values or other guidelines. Again, the Dwn/Up Gap values are based on the Date Filter input settings.
Heed warnings from the TradingView Pine Script™ manual about values entered into the Slippage field.
The Slippage (ticks) have a noticeable influence on entry price and exit price especially at the beginning when the date range includes prices from $0.01 to $100,000.00 like that for BTC-USD INDEX. When this is the case, it is best to use different slippage values when partitioning time with the Date Filter.
To minimize the effects of slippage, yet account for it select ‘median gap’ on the Input Tab and use that value for slippage on the Properties tab.
The slippage value is included in the placeholder {{strategy.order.price}}.
Leverage Trading
The PSE is designed to be used both without leverage (the default) and with leverage.
These two settings apply to Trade-Grps. For example, for 5x leverage enter 20 (1/5x100=20).
Margin for Long Positions: Set as desired. The default is 100%.
Margin for Short Positions: Set as desired. The default is 100%.
This setting on the Inputs tab applies to each trade position within a Trade-Grp.
Max % Equity per Position: Set as desired. The default is 20% and intended for non-leverage trading. For leverage trading set as desired. For example, for 3x leverage enter 300 (3x100=300).
Recalculate After Order Is Filled
The PSE uses the strategy parameter calc_on_order_fills=true to allow for enter/exit on the same bar and generate alerts immediately after an order is filled. This parameter is on the Properties tab and is named ‘Recalculate After order is filled’ and is enabled by default.
Disabling this feature will cause the PSE to not work as intended.
You will see the following Caution! on the TV Strategy Tester
This occurs because the PSE has the strategy parameter calc_on_order_fills = true.
Again, the PSE will only work as intended if this parameter is enabled and set to true.
Therefore, you can close the caution sign and be confident of receiving realistic results.
Recalculate On every tick: Disable.
Fill Orders
• Using bar magnifier: Set as desired.
• On Bar Close: Disable. The PSE will not work as intended if this is enabled.
• Using Standard OHLC: Set as desired.
Using The Alert Message Box From TV Strategy Alert
Set alerts to gain access to all the alerts from PSE. This allows for both order filled alerts, as well as the alert function calls related to refresh GTC orders, drawdown exceeded, update stop-loss order, and Failed to Trade.
Example Message for Manual Trading Alerts
(This is just an example. Consult TV manual for possible placeholders to use.)
{
Alert for {{plot("position_for_alert")}} position. (long = 1; short = -1)
{{exchange}}:{{ticker}} on TF of {{interval}} at Broker Name
{{strategy.order.action}} Equity x Equity_Multiplier USD in shares at price = {{strategy.order.price}},
where Equity_Multiplier = {{strategy.order.contracts}} x {{strategy.order.price}} / {{plot("Equity")}}
or {{strategy.order.action}} {{strategy.order.contracts}} shares at price = {{strategy.order.price}}.
}
Note: Use the Equity x Equity_Multiplier method if you have several accounts with different initial capital.
Example Message for Bot Trading Alerts
(You must consult your specific bot for configuring the alert message. This is just an example.)
{
"action": "{{strategy.order.action}}",
“price”: {{strategy.order.price}}
"amount": {{strategy.order.contracts}},
"botId": "1234"
}
Connecting to the PSE
The diagram below illustrates how to connect indicators to the PSE.
The Aroon and MACD indicators are only used here as an example. Substitute your own indicators and add as many as you like.
Connection Indicator for the PSE
A video of how to connect your indicator(s) to the PSE is below.
The Connection Indicator for the PSE, also called here the connection-indicator.
Below is a description of how to connect your chosen indicators to the connection-indicator. Two (2) indicators were chosen for the example, but you may have one (1) or many indicators.
If you have source code access to your indicators you can paste the code directly into the connection-indicator to eliminate the need to have those indicators on the chart and the additional connection of them to the connection-indicator. Below will assume source code to the indicators are not available.
The MACD and Aroon Oscillator are from TV built standard indicators and are shown here just as an example for inputs (i.e. source) to the connection-indicator. They were configured as follows:
The source code for the connection-indicator is shown below. Substitute your own chosen indicators and add as many as you like to create your connection-indicator that feeds into the PSE. The MACD and Aroon Oscillator were simply chosen as an example. Configure your connection-indicator in the manner shown below.
// This Pine Script™ code is subject to the terms of the Mozilla Public License 2.0 at mozilla.org
// This is just an example Indicator to show how to interface with the PSE.
// The indicators used in the example are standard TV built indicators.
//@version=5
indicator(title="Connection Indicator for the PSE", overlay=false, max_lines_count=500, max_labels_count=500, max_boxes_count=500)
// Ind_1 INDICATOR ++++++++++++++++++++++++++++++++++++++++++++++++++++++++
// This is just and example and used MACD histogram as the source.
Filter_Ind_1 = input.bool(false, 'Ind_1', group='Ind_1 INDICATOR ~~~~~~~~~~~~~~~~~', tooltip='Click ON to enable the indicator')
input_Ind_1 = input.source(title = "input_Ind_1", defval = close, group='Ind_1 INDICATOR ~~~~~~~~~~~~~~~~~')
Entry_Ind_1_Long = Filter_Ind_1 ? input_Ind_1 > 0 ? 1 : 0 : 0
Entry_Ind_1_Short = Filter_Ind_1 ? input_Ind_1 < 0 ? 1 : 0 : 0
Exit_Ind_1_Long = Entry_Ind_1_Short
Exit_Ind_1_Short = Entry_Ind_1_Long
// Ind_2 INDICATOR ++++++++++++++++++++++++++++++++++++++++++++++++++++++++
// This is just an example and used Aroon Oscillator as the source. Included limits to use with the oscillator to determine enter and exit.
Filter_Ind_2 = input.bool(false, "Ind_2", group='Ind_2 INDICATOR ~~~~~~~~~~~~~~', tooltip='Click ON to enable the indicator')
Filter_Ind_2_Limit = input.int(35, minval=0, step=5, group='Ind_2 INDICATOR ~~~~~~~~~~~~~~')
Filter_Ind_2_UL = Filter_Ind_2_Limit
Filter_Ind_2_LL = -Filter_Ind_2_Limit
up = input.source(title = "input_Ind_2A Up", defval = close, group='Ind_2 INDICATOR ~~~~~~~~~~~~~~')
down = input.source(title = "input_Ind_2B Down", defval = close, group='Ind_2 INDICATOR ~~~~~~~~~~~~~~')
oscillator = up - down
Entry_Ind_2_Long = Filter_Ind_2? oscillator > Filter_Ind_2_UL ? 1 : 0 : 0
Entry_Ind_2_Short = Filter_Ind_2? oscillator < Filter_Ind_2_LL ? 1 : 0 : 0
Exit_Ind_2_Long = Entry_Ind_2_Short
Exit_Ind_2_Short = Entry_Ind_2_Long
//#region ~~~~~~~ASSEMBLY OF FILTERS ~~~~~~~~~~~~~~~~~~~~~~~~~~~~~~~~~~~~~~~~~~~~~~~~~~~~~~~~~~~~~~~~~}
// You may have as many indicators as you like. Assemble them in similar fashion as below.
// ——————— Assembly of Entry Filters
Nbr_Entries = input.int(1, minval=1, title='Min Nbr Entries', inline='nbr_in_out', group='Assembly of Indicators')
// Update the assembly based on the number of indicators connected.
EntryLongOK = Entry_Ind_1_Long + Entry_Ind_2_Long >= Nbr_Entries? true: false
EntryShortOK = Entry_Ind_1_Short + Entry_Ind_2_Short >= Nbr_Entries? true: false
entry_signal = EntryLongOK ? 1 : EntryShortOK ? -1 : 0
plot(entry_signal, title="Entry_Signal", color=color.new(color.blue, 0))
// ——————— Assembly of Exit Filters
Nbr_Exits = input.int(1, minval=1, title='Min Nbr of Exits', inline='nbr_in_out', group='Assembly of Indicators', tooltip='Enter the minimum number of entries & exits
required for a signal.')
// Update the assembly based on the number of indicators connected.
ExitLongOK = Exit_Ind_1_Long + Exit_Ind_2_Long >= Nbr_Exits? true: false
ExitShortOK = Exit_Ind_1_Short + Exit_Ind_2_Short >= Nbr_Exits? true: false
exit_signal = ExitLongOK ? 1 : ExitShortOK ? -1 : 0
plot(exit_signal, title="Exit_Signal", color=color.new(color.red, 0))
//#endregion ~~~~~~~END OF ASSEMBLY OF FILTERS ~~~~~~~~~~~~~~~~~~~~~~~~~~~~~~~~~~~~~~~~~~~~~~~~~~~~~~~~~~~~~~~~~}
The input box for the connection-indicator is shown below. The default for input source is “close”. For Input_Ind_1 click the dropdown and select the MACD Histogram. For Input_Ind_2 click the dropdown and select Aroon Up and Aroon Down as shown.
Signal Connection Section of PSE
Below is a description of how to connect your chosen indicators to the PSE from the connection-indicator.
At the PSE Input tab, the Signal Connection Section is where you select the source of the Entry and Exit Signal to the PSE. These are the outputs from connection-indicator.
The default source is “close”. Click the dropdown and select the entry and exit signal to establish a connection as shown below.

NexTrade
Overview of NexTrade: The Future of Crypto Trading
Introduction
NexTrade is a cutting-edge algorithmic trading platform designed to optimize cryptocurrency trading strategies. Developed by myself, a software engineer with a passion for quantitative development. Over the past year, I have focused on learning and applying quantitative techniques to the crypto space, ultimately crafting a platform that leverages advanced market analysis, automation, and robust risk management to help investors maximize returns while minimizing risk. NexTrade is engineered to help you capitalize on market movements in a fast-paced and highly competitive space, that is Cryptocurrency.
Key Features and Advantages
Sophisticated Market Analysis: NexTrade uses a comprehensive market analysis framework that examines historical trends, price movements, and market conditions across multiple cryptocurrency exchanges. The algorithm identifies trading opportunities by chart analysis on higher timeframes in order to follow trends, allowing it to execute trades at optimal moments.
Multi-Exchange Integration: NexTrade connects to multiple leading cryptocurrency exchanges, such as Binance, Kraken, and Coinbase Pro, to ensure access to diverse liquidity pools. This multi-exchange connectivity allows the platform to execute trades at the most favorable prices, optimizing profitability and minimizing slippage across various platforms. However, we suggest using the exchange with lowest fees possible.
Risk Management: NexTrade’s risk management features such as Stop Losses, ATR Trailing SL, and ADX chop indicator allows us to ensure we are effectively managing our risk.
Backtesting and Optimization: Before going live, NexTrade’s trading strategies undergo rigorous backtesting using historical market data. This enables users to see how strategies would have performed under various conditions, providing transparency and confidence in the platform’s potential for generating consistent returns. Ongoing optimization ensures that strategies evolve in response to market changes.
Real-Time Performance Monitoring: Users have access to detailed, real-time performance reports, tracking key metrics such as trades executed, profits, losses, and overall portfolio performance. This transparency allows investors to make informed decisions and monitor their investments closely at any time.
Market Opportunity
The cryptocurrency market continues to experience rapid growth, with trillions of dollars in trading volume annually. However, it is also notoriously volatile, creating both risk and reward opportunities for traders. To successfully navigate this market, investors need sophisticated tools that can automate the trading process and optimize decisions based on accurate market analysis.
NexTrade was developed to address this need. With its combination of data-driven market analysis, automated execution, and risk management, NexTrade is positioned to help investors gain an edge in a market that is often unpredictable and challenging. The platform offers a reliable, scalable solution to crypto trading, designed for both beginners and seasoned professionals.
Why Invest in NexTrade?
Scalable and Flexible: Whether you’re trading small amounts or large volumes, NexTrade can scale to accommodate your needs. The platform supports multiple exchanges, giving users the flexibility to diversify and grow their investments. Users can start with as low as $100!
Risk-Adjusted Returns: By focusing on risk management, NexTrade aims to deliver returns that are balanced with the level of risk the investor is willing to accept. The algorithm continuously adjusts trading strategies to align with market conditions, maximizing the potential for profits while minimizing the likelihood of significant losses.
24/7 Trading: The cryptocurrency market operates around the clock, and NexTrade is designed to take advantage of this. Its automated nature means that it can execute trades at any time, without the need for human intervention.
Conclusion
NexTrade offers a sophisticated yet accessible solution for investors looking to capitalize on the growth of the cryptocurrency market. With its focus on data-driven analysis, automated trade execution, and advanced risk management, NexTrade empowers investors to achieve optimal returns while managing risk effectively. Whether you are new to crypto or an experienced trader, NexTrade provides the tools needed to stay competitive and succeed in a fast-moving market.
By investing in NexTrade, you are gaining access to a proven algorithmic trading platform that has the potential to enhance your crypto trading strategy and deliver consistent results. The future of cryptocurrency trading is automated, risk-managed, and optimized—and NexTrade is leading the way.
If users wish the enable the chop detector on the bot, which uses ADX, they can turn it on in the settings after the strategu is added to the chart. By default, it is set to false.

Temporary Help Services Jobs - Trend Allocation StrategyThis strategy is designed to capitalize on the economic trends represented by the Temporary Help Services (TEMPHELPS) index, which is published by the Federal Reserve Economic Data (FRED). Temporary Help Services Jobs are often regarded as a leading indicator of labor market conditions, as changes in temporary employment levels frequently precede broader employment trends.
Methodology:
Data Source: The strategy uses the FRED dataset TEMPHELPS for monthly data on temporary help services.
Trend Definition:
Uptrend: When the current month's value is greater than the previous month's value.
Downtrend: When the current month's value is less than the previous month's value.
Entry Condition: A long position is opened when an uptrend is detected, provided no position is currently held.
Exit Condition: The long position is closed when a downtrend is detected.
Scientific Basis:
The TEMPHELPS index serves as a leading economic indicator, as noted in studies analyzing labor market cyclicality (e.g., Katz & Krueger, 1999). Temporary employment is often considered a proxy for broader economic conditions, particularly in predicting recessions or recoveries. Incorporating this index into trading strategies allows for aligning trades with potential macroeconomic shifts, as suggested by research on employment trends and market performance (Autor, 2001; Valetta & Bengali, 2013).
Usage:
This strategy is best suited for long-term investors or macroeconomic trend followers who wish to leverage labor market signals for equity or futures trading. It operates exclusively on end-of-month data, ensuring minimal transaction costs and noise.

Relative StrengthThis strategy employs a custom "strength" function to assess the relative strength of a user-defined source (e.g., closing price, moving average) compared to its historical performance over various timeframes (8, 34, 20, 50, and 200 periods). The strength is calculated as a percentage change from an Exponential Moving Average (EMA) for shorter timeframes and a Simple Moving Average (SMA) for longer timeframes. Weights are then assigned to each timeframe based on a logarithmic scale, and a weighted average strength is computed.
Key Features:
Strength Calculation:
Calculates the relative strength of the source using EMAs and SMAs over various timeframes.
Assigns weights to each timeframe based on a logarithmic scale, emphasizing shorter timeframes.
Calculates a weighted average strength for a comprehensive view.
Visualizations:
Plots the calculated strength as a line, colored green for positive strength and red for negative strength.
Fills the background area below the line with green for positive strength and red for negative strength, enhancing visualization.
Comparative Analysis:
Optionally displays the strength of Bitcoin (BTC), Ethereum (ETH), S&P 500, Nasdaq, and Dow Jones Industrial Average (DJI) for comparison with the main source strength.
Backtesting:
Allows users to specify a start and end time for backtesting the strategy's performance.
Trading Signals:
Generates buy signals when the strength turns positive from negative and vice versa for sell signals.
Entry and exit are conditional on the backtesting time range.
Basic buy and sell signal plots are commented out (can be uncommented for visual representation).
Risk Management:
Closes all open positions and cancels pending orders outside the backtesting time range.
Disclaimer:
Backtesting results do not guarantee future performance. This strategy is for educational purposes only and should be thoroughly tested and refined before risking capital.
Additional Notes:
- The strategy uses a custom "strength" function that can be further customized to explore different timeframes and weighting schemes.
- Consider incorporating additional technical indicators or filters to refine the entry and exit signals.
- Backtesting with different parameters and market conditions is crucial for evaluating the strategy's robustness.
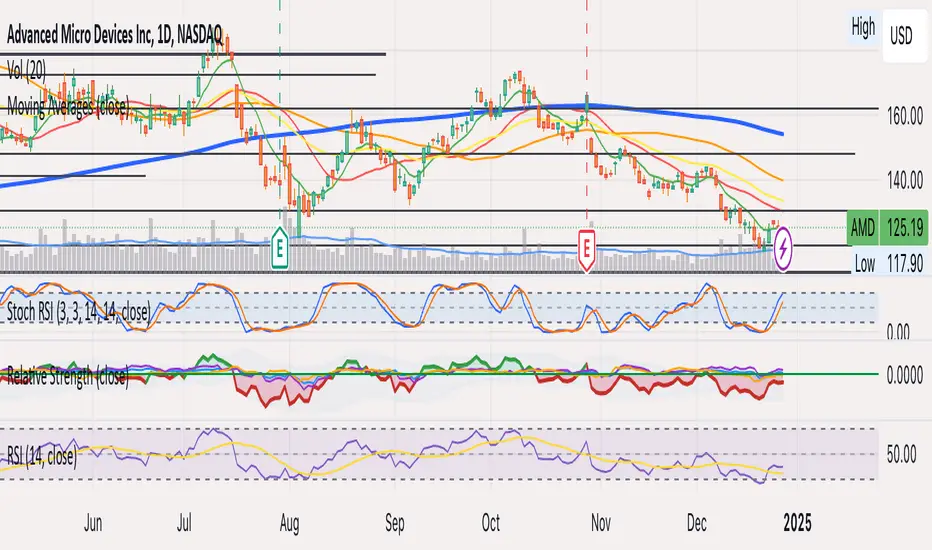
Trend Trader-Remastered StrategyOfficial Strategy for Trend Trader - Remastered
Indicator: Trend Trader-Remastered (TTR)
Overview:
The Trend Trader-Remastered is a refined and highly sophisticated implementation of the Parabolic SAR designed to create strategic buy and sell entry signals, alongside precision take profit and re-entry signals based on marked Bill Williams (BW) fractals. Built with a deep emphasis on clarity and accuracy, this indicator ensures that only relevant and meaningful signals are generated, eliminating any unnecessary entries or exits.
Please check the indicator details and updates via the link above.
Important Disclosure:
My primary objective is to provide realistic strategies and a code base for the TradingView Community. Therefore, the default settings of the strategy version of the indicator have been set to reflect realistic world trading scenarios and best practices.
Key Features:
Strategy execution date&time range.
Take Profit Reduction Rate: The percentage of progressive reduction on active position size for take profit signals.
Example:
TP Reduce: 10%
Entry Position Size: 100
TP1: 100 - 10 = 90
TP2: 90 - 9 = 81
Re-Entry When Rate: The percentage of position size on initial entry of the signal to determine re-entry.
Example:
RE When: 50%
Entry Position Size: 100
Re-Entry Condition: Active Position Size < 50
Re-Entry Fill Rate: The percentage of position size on initial entry of the signal to be completed.
Example:
RE Fill: 75%
Entry Position Size: 100
Active Position Size: 50
Re-Entry Order Size: 25
Final Active Position Size:75
Important: Even RE When condition is met, the active position size required to drop below RE Fill rate to trigger re-entry order.
Key Points:
'Process Orders on Close' is enabled as Take Profit and Re-Entry signals must be executed on candle close.
'Calculate on Every Tick' is enabled as entry signals are required to be executed within candle time.
'Initial Capital' has been set to 10,000 USD.
'Default Quantity Type' has been set to 'Percent of Equity'.
'Default Quantity' has been set to 10% as the best practice of investing 10% of the assets.
'Currency' has been set to USD.
'Commission Type' has been set to 'Commission Percent'
'Commission Value' has been set to 0.05% to reflect the most realistic results with a common taker fee value.

Bitcoin Exponential Profit Strategy### Strategy Description:
The **Bitcoin Trading Strategy** is an **Exponential Moving Average (EMA) crossover strategy** designed to identify bullish trends for Bitcoin.
1. **Indicators**:
- **Fast EMA (default 9 periods)**: Represents the short-term trend.
- **Slow EMA (default 21 periods)**: Represents the longer-term trend.
2. **Entry Condition**:
- A **bullish crossover** occurs when the Fast EMA crosses above the Slow EMA.
- The strategy enters a **long position** with a user-defined order size (default 0.01 BTC).
3. **Exit Conditions**:
- **Take Profit**: Closes the position when the profit target is reached (default $100).
- **Stop Loss**: Closes the position when the price drops below the stop loss level (default $50).
- **Bearish Crossunder**: Closes the position when the Fast EMA crosses below the Slow EMA.
4. **Visual Signals**:
- **BUY signals**: Displayed when a bullish crossover occurs.
- **SELL signals**: Displayed when a bearish crossunder occurs.
This strategy is optimized for trend-following behavior, ensuring positions are aligned with upward-moving trends while managing risk through clear stop-loss and take-profit levels.

Swing High/Low Pivots Strategy [LV]The Swing High/Low Pivots Strategy was developed as a counter-momentum trading tool.
The strategy is suitable for any market and the default values used in the input settings menu are set for Bitcoin (best on 15min). These values, expressed in minimum ticks (or pips if symbol is Forex) make this tool perfectly adaptable to every symbol and/or timeframe.
Check tooltips in the settings menu for more details about every user input.
STRTEGY ENTRY & EXIT MECHANISMS:
Trades Entry based on the detection of swing highs and lows for short and long entries respectively, validated by:
- Limit orders placed after each new pivot level confirmation
- Moving averages trend filter (if enabled)
- No active trade currently open
Trades Exit when the price reaches take-profit or stop-loss level as defined in the settings menu. A double entry/second take-profit level can be enabled for partial exits, with dynamic stop-loss adjustment for the remaining position.
Enhanced Trade Precision:
By limiting entries to confirmed swing high (HH, LH) or swing low (HL, LL) pivot points, the strategy ensures that trades occur at levels of significant price reversals. This precision reduces the likelihood of entering trades in the midst of a trend or during uncertain price action.
Risk Management Optimization:
The strategy incorporates clearly defined stop-loss (SL) and take-profit (TP) levels derived from the pivot points. This structured approach minimizes potential losses while locking in profits, which is critical for consistent performance in volatile markets.
Trend Filtering for Better Entry:
The use of a configurable moving average filter adds a layer of trend validation. This prevents entering trades against the dominant market trend, increasing the probability of success for each trade.
Avoidance of Noise:
The lookback period (length parameter) confirms pivots only after a set number of bars, effectively filtering out market noise and ensuring that entries are based on reliable, well-defined price movements.
Adaptability Across Markets:
The strategy is versatile and can be applied across different markets (Forex, stocks, crypto) due to its dynamic use of ticks and pips converters. It adapts seamlessly to varying price scales and asset types.
Dual Quantity Entries:
The original and optionnal double-entry mechanism allows traders to capture both short-term and extended profits by scaling out of positions. This adaptive approach caters to varying risk appetites and market conditions.
Clear Visualization:
The plotted pivot points, entry limits, SL, and TP levels provide visual clarity, making it easy for traders to track the strategy's behavior and make informed decisions.
Automated Execution with Alerts:
Integrated alerts for both entries and exits ensure timely actions without the need for constant market monitoring, enhancing efficiency. Configurable alert messages are suitable for API use.
Any feedback, comments, or suggestions for improvement are always welcome.
Hope you enjoy!

R-based Strategy Template [Daveatt]Have you ever wondered how to properly track your trading performance based on risk rather than just profits?
This template solves that problem by implementing R-multiple tracking directly in TradingView's strategy tester.
This script is a tool that you must update with your own trading entry logic.
Quick notes
Before we dive in, I want to be clear: this is a template focused on R-multiple calculation and visualization.
I'm using a basic RSI strategy with dummy values just to demonstrate how the R tracking works. The actual trading signals aren't important here - you should replace them with your own strategy logic.
R multiple logic
Let's talk about what R-multiple means in practice.
Think of R as your initial risk per trade.
For instance, if you have a $10,000 account and you're risking 1% per trade, your 1R would be $100.
A trade that makes twice your risk would be +2R ($200), while hitting your stop loss would be -1R (-$100).
This way of measuring makes it much easier to evaluate your strategy's performance regardless of account size.
Whenever the SL is hit, we lose -1R
Proof showing the strategy tester whenever the SL is hit: i.imgur.com
The magic happens in how we calculate position sizes.
The script automatically determines the right position size to risk exactly your specified percentage on each trade.
This is done through a simple but powerful calculation:
risk_amount = (strategy.equity * (risk_per_trade_percent / 100))
sl_distance = math.abs(entry_price - sl_price)
position_size = risk_amount / (sl_distance * syminfo.pointvalue)
Limitations with lower timeframe gaps
This ensures that if your stop loss gets hit, you'll lose exactly the amount you intended to risk. No more, no less.
Well, could be more or less actually ... let's assume you're trading futures on a 15-minute chart but in the 1-minute chart there is a gap ... then your 15 minute SL won't get filled and you'll likely to not lose exactly -1R
This is annoying but it can't be fixed - and that's how trading works anyway.
Features
The template gives you flexibility in how you set your stop losses. You can use fixed points, ATR-based stops, percentage-based stops, or even tick-based stops.
Regardless of which method you choose, the position sizing will automatically adjust to maintain your desired risk per trade.
To help you track performance, I've added a comprehensive statistics table in the top right corner of your chart.
It shows you everything you need to know about your strategy's performance in terms of R-multiples: how many R you've won or lost, your win rate, average R per trade, and even your longest winning and losing streaks.
Happy trading!
And remember, measuring your performance in R-multiples is one of the most classical ways to evaluate and improve your trading strategies.
Daveatt

IU EMA Channel StrategyIU EMA Channel Strategy
Overview:
The IU EMA Channel Strategy is a simple yet effective trend-following strategy that uses two Exponential Moving Averages (EMAs) based on the high and low prices. It provides clear entry and exit signals by identifying price crossovers relative to the EMAs while incorporating a built-in Risk-to-Reward Ratio (RTR) for effective risk management.
Inputs ( Settings ):
- RTR (Risk-to-Reward Ratio): Define the ratio for risk-to-reward (default = 2).
- EMA Length: Adjust the length of the EMA channels (default = 100).
How the Strategy Works
1. EMA Channels:
- High-based EMA: EMA calculated on the high price.
- Low-based EMA: EMA calculated on the low price.
The area between these two EMAs creates a "channel" that visually highlights potential support and resistance zones.
2. Entry Rules:
- Long Entry: When the price closes above the high-based EMA (crossover).
- Short Entry: When the price closes below the low-based EMA (crossunder).
These entries ensure trades are taken in the direction of momentum.
3. Stop Loss (SL) and Take Profit (TP):
- Stop Loss:
- For long positions, the SL is set at the previous bar's low.
- For short positions, the SL is set at the previous bar's high.
- Take Profit:
- TP is automatically calculated using the Risk-to-Reward Ratio (RTR) you define.
- Example: If RTR = 2, the TP will be 2x the risk distance.
4. Exit Rules:
- Positions are closed at either the stop loss or the take profit level.
- The strategy manages exits automatically to enforce disciplined risk management.
Visual Features
1. EMA Channels:
- The high and low EMAs are dynamically color-coded:
- Green: Price is above the EMA (bullish condition).
- Red: Price is below the EMA (bearish condition).
- The area between the EMAs is shaded for better visual clarity.
2. Stop Loss and Take Profit Zones:
- SL and TP levels are plotted for both long and short positions.
- Zones are filled with:
- Red: Stop Loss area.
- Green: Take Profit area.
Be sure to manage your risk and position size properly.

ETH - 12HR Double Kernel Regression Strategy ETH Double Kernel Regression Strategy
This ETH -focused, 12-hour Double Kernel Regression strategy is designed to cut through market noise and guide you toward data-backed, higher-probability trades. By utilizing two kernel regression models—Fast and Slow—this approach gauges momentum shifts and confirms trends. The strategy intelligently switches between these kernels based on identifying FOMO patterns, allowing it to adapt to changing market conditions. This ensures you enter trades when the trend is genuinely gaining strength, rather than blindly "buying the dip."
Key Concepts
Fine-Tuned Since Inception:
The strategy’s logic and filters—including price thresholds, trend moving averages (MAs), and kernel confirmations—are meticulously fine-tuned to perform consistently across all market conditions. This proactive planning enables confident entries during bullish recoveries, eliminating the need to second-guess every signal.
“Buy the Rise, Sell the Dip” Logic:
Unlike the traditional mantra, this strategy waits for slow kernel confirmation before entering uptrends. When market conditions shift, it identifies optimal entry points and holds steady if the trade isn’t losing money. This reduces guesswork and helps prevent buying into false rallies.
Sell the Hype:
The crypto market is often cluttered with noise—meme coins, last-minute hype, and social media influencers. The Double Kernel Regression approach distinguishes genuine trends from hype-driven movements. When the price exceeds simple moving averages (SMAs), the fast kernel generates a sell signal. This carefully crafted strategy helps you navigate the chaotic landscape, especially during hype-driven rallies, and ensures you sell at the top.
Try It Out
Import this strategy into your TradingView platform and observe how it reacts in real-time as market conditions change. Evaluate the signals, adjust parameters if necessary, and experience firsthand how combining sound trading philosophy with a data-driven backbone can transform your trading journey.

3 EMA + RSI with Trail Stop [Free990] (LOW TF)This trading strategy combines three Exponential Moving Averages (EMAs) to identify trend direction, uses RSI to signal exit conditions, and applies both a fixed percentage stop-loss and a trailing stop for risk management. It aims to capture momentum when the faster EMAs cross the slower EMA, then uses RSI thresholds, time-based exits, and stops to close trades.
Short Explanation of the Logic
Trend Detection: When the 10 EMA crosses above the 20 EMA and both are above the 100 EMA (and the current price bar closes higher), it triggers a long entry signal. The reverse happens for a short (the 10 EMA crosses below the 20 EMA and both are below the 100 EMA).
RSI Exit: RSI crossing above a set threshold closes long trades; crossing below another threshold closes short trades.
Time-Based Exit: If a trade is in profit after a set number of bars, the strategy closes it.
Stop-Loss & Trailing Stop: A fixed stop-loss based on a percentage from the entry price guards against large drawdowns. A trailing stop dynamically tightens as the trade moves in favor, locking in potential gains.
Detailed Explanation of the Strategy Logic
Exponential Moving Average (EMA) Setup
Short EMA (out_a, length=10)
Medium EMA (out_b, length=20)
Long EMA (out_c, length=100)
The code calculates three separate EMAs to gauge short-term, medium-term, and longer-term trend behavior. By comparing their relative positions, the strategy infers whether the market is bullish (EMAs stacked positively) or bearish (EMAs stacked negatively).
Entry Conditions
Long Entry (entryLong): Occurs when:
The short EMA (10) crosses above the medium EMA (20).
Both EMAs (short and medium) are above the long EMA (100).
The current bar closes higher than it opened (close > open).
This suggests that momentum is shifting to the upside (short-term EMAs crossing up and price action turning bullish). If there’s an existing short position, it’s closed first before opening a new long.
Short Entry (entryShort): Occurs when:
The short EMA (10) crosses below the medium EMA (20).
Both EMAs (short and medium) are below the long EMA (100).
The current bar closes lower than it opened (close < open).
This indicates a potential shift to the downside. If there’s an existing long position, that gets closed first before opening a new short.
Exit Signals
RSI-Based Exits:
For long trades: When RSI exceeds a specified threshold (e.g., 70 by default), it triggers a long exit. RSI > short_rsi generally means overbought conditions, so the strategy exits to lock in profits or avoid a pullback.
For short trades: When RSI dips below a specified threshold (e.g., 30 by default), it triggers a short exit. RSI < long_rsi indicates oversold conditions, so the strategy closes the short to avoid a bounce.
Time-Based Exit:
If the trade has been open for xBars bars (configurable, e.g., 24 bars) and the trade is in profit (current price above entry for a long, or current price below entry for a short), the strategy closes the position. This helps lock in gains if the move takes too long or momentum stalls.
Stop-Loss Management
Fixed Stop-Loss (% Based): Each trade has a fixed stop-loss calculated as a percentage from the average entry price.
For long positions, the stop-loss is set below the entry price by a user-defined percentage (fixStopLossPerc).
For short positions, the stop-loss is set above the entry price by the same percentage.
This mechanism prevents catastrophic losses if the market moves strongly against the position.
Trailing Stop:
The strategy also sets a trail stop using trail_points (the distance in price points) and trail_offset (how quickly the stop “catches up” to price).
As the market moves in favor of the trade, the trailing stop gradually tightens, allowing profits to run while still capping potential drawdowns if the price reverses.
Order Execution Flow
When the conditions for a new position (long or short) are triggered, the strategy first checks if there’s an opposite position open. If there is, it closes that position before opening the new one (prevents going “both long and short” simultaneously).
RSI-based and time-based exits are checked on each bar. If triggered, the position is closed.
If the position remains open, the fixed stop-loss and trailing stop remain in effect until the position is exited.
Why This Combination Works
Multiple EMA Cross: Combining 10, 20, and 100 EMAs balances short-term momentum detection with a longer-term trend filter. This reduces false signals that can occur if you only look at a single crossover without considering the broader trend.
RSI Exits: RSI provides a momentum oscillator view—helpful for detecting overbought/oversold conditions, acting as an extra confirmation to exit.
Time-Based Exit: Prevents “lingering trades.” If the position is in profit but failing to advance further, it takes profit rather than risking a trend reversal.
Fixed & Trailing Stop-Loss: The fixed stop-loss is your safety net to cap worst-case losses. The trailing stop allows the strategy to lock in gains by following the trade as it moves favorably, thus maximizing profit potential while keeping risk in check.
Overall, this approach tries to capture momentum from EMA crossovers, protect profits with trailing stops, and limit risk through both a fixed percentage stop-loss and exit signals from RSI/time-based logic.

Liquidity + Engulfment StrategyThis strategy identifies potential trading opportunities by combining bullish and bearish engulfing candle patterns with liquidity seal-off points. The logic is based on the concept of engulfing candles, which signal a shift in market sentiment, and liquidity lines, which represent local price extremes (highs and lows) that can indicate potential reversal or continuation points.
Key Features:
Mode Selection
The strategy allows for three modes: "Both", "Bullish Only", and "Bearish Only". Users can choose whether to trade both directions, only bullish setups, or only bearish setups.
Time Range
Users can define a specific time range for when the strategy is active, enabling tailored analysis and trade execution over a desired period.
Engulfing Candles
Bullish Engulfing: A candle that closes above the high of the previous bearish candle, signaling potential upward momentum.
Bearish Engulfing: A candle that closes below the low of the previous bullish candle, indicating a potential downtrend.
Liquidity Seal-Off Points
The strategy detects local highs and local lows within a specified lookback period, which can serve as critical support and resistance points.
A bullish signal is triggered when the price touches a lower liquidity point (local low), and a bearish signal is triggered at a higher liquidity point (local high).
Signal Confirmation
Signals are only triggered when both an engulfing candle and the price action at a liquidity seal-off point align. This helps filter out weaker signals.
Consecutive signals are prevented by locking the trade direction after an initial signal and waiting for the liquidity line to be broken before re-triggering a signal.
Entry and Exit Conditions
The strategy can enter both long (bullish) or short (bearish) positions based on the mode and signals.
Exit is based on opposing signals or reaching predefined stop-loss and take-profit levels.
Alerts
The strategy supports alert conditions to notify users when bullish engulfing after a lower liquidity touch or bearish engulfing after an upper liquidity touch is detected.
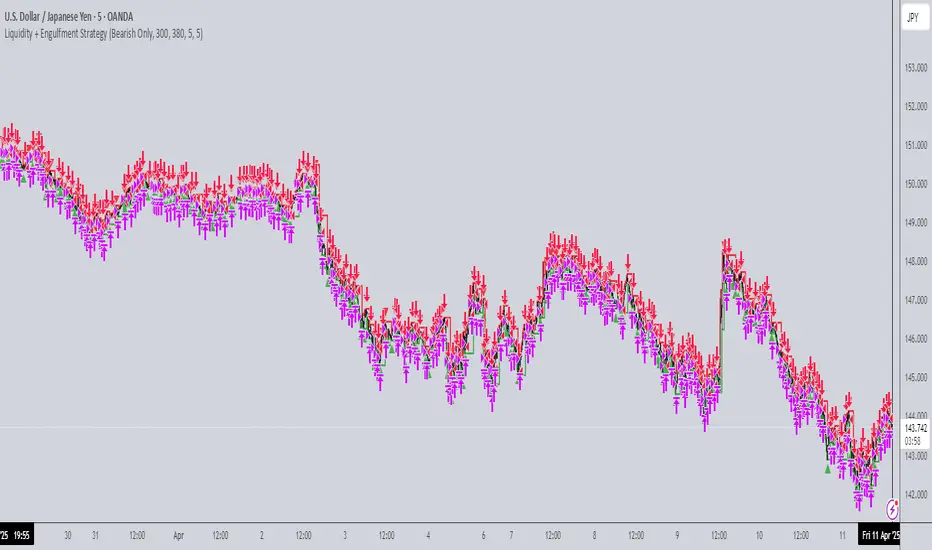
Ichimoku by FarmerBTCLegal Disclaimer
This strategy, "Ichimoku by FarmerBTC," is provided for educational and informational purposes only. It does not constitute financial advice and should not be relied upon as such. Trading and investing involve substantial risk, including the potential for losing more than your initial investment. Past performance is not indicative of future results. Always consult with a qualified financial advisor before making trading or investment decisions. The author of this strategy is not responsible for any financial losses incurred through its use.
Overview
The "Ichimoku by FarmerBTC" strategy is a trend-following system built on the Ichimoku Cloud indicator, enhanced with volume analysis and a high-timeframe Simple Moving Average (HTF SMA) condition. It is designed to identify long-only trade opportunities and performs optimally on higher timeframes, such as the daily chart or above.
Core Components
1. Ichimoku Cloud
The Ichimoku Cloud is a comprehensive trend-following indicator that helps identify the overall market direction and momentum. It consists of:
Conversion Line (Tenkan-Sen): Measures short-term momentum.
Base Line (Kijun-Sen): Filters medium-term trends.
Leading Span A: The average of the Conversion and Base Lines, forming one cloud boundary.
Leading Span B: The midpoint of the highest high and lowest low over a longer period, forming the other cloud boundary.
Key Ichimoku Rules Applied:
The strategy identifies bullish trends when:
The price is above the cloud.
The cloud is bullish (Leading Span A > Leading Span B).
2. High-Timeframe Simple Moving Average (HTF SMA)
This condition ensures alignment with the broader trend:
Default SMA Length: 13 periods.
Default Timeframe: 1 day.
HTF SMA Rule:
Trades are allowed only when the price is above the HTF SMA, ensuring alignment with the larger trend.
3. Volume Analysis
The strategy uses volume to validate trade setups:
Volume MA: A 20-period moving average of volume is calculated.
Trades are allowed only when the current volume is at least 1.5x the Volume MA, indicating strong market participation.
Entry and Exit Rules
Entry Condition (Long Only):
Price above the Ichimoku Cloud: Confirms a bullish trend.
Bullish Cloud: Leading Span A > Leading Span B indicates upward momentum.
Price above the HTF SMA: Ensures alignment with the broader trend.
Volume exceeds threshold: Confirms strong market participation.
Exit Condition:
The strategy exits the position when the price moves below the Ichimoku Cloud, signaling a potential trend reversal.
Best Timeframes
This strategy is optimized for daily (1D) or higher timeframes (e.g., weekly 1W). Using it on lower timeframes may produce false signals due to increased noise in price and volume data.
Default Settings
Ichimoku Settings:
Conversion Line Period: 10
Base Line Period: 30
Lagging Span Period: 53
Displacement: 26
HTF SMA Settings:
SMA Length: 13
Timeframe: 1 Day
Volume Settings:
Volume MA Length: 20
Volume Multiplier: 1.5x
Visualization
Ichimoku Cloud:
Dynamic cloud coloring (green for bullish, red for bearish) helps identify the current trend.
HTF SMA:
A purple line overlays the chart, providing a clear representation of the high-timeframe trend.
Volume Panel:
An optional panel displays volume (blue histogram) and the Volume Moving Average (orange line) to analyze market participation.
Advantages of This Strategy
High Accuracy on Higher Timeframes:
Filtering trades using the Ichimoku Cloud, HTF SMA, and volume ensures robust trend alignment, reducing false signals.
Volume Confirmation:
Incorporates volume as a validation metric to enter trades only during strong market participation.
Easy Customization:
Parameters like Ichimoku periods, SMA length, timeframe, and volume thresholds can be adjusted to suit different assets or trading styles.
Limitations
Not Suitable for Low Timeframes:
Lower timeframes can produce excessive noise, leading to false signals.
Long-Only:
The strategy is designed only for bullish markets and does not support short trades.
Lagging Nature of Indicators:
Both the Ichimoku Cloud and SMA are lagging indicators, meaning they react to past price movements.
Conclusion
The "Ichimoku by FarmerBTC" strategy is an excellent tool for trend-following on daily or higher timeframes. Its combination of Ichimoku Cloud, high-timeframe SMA, and volume ensures a robust framework for identifying high-probability long trades in trending markets. However, users are advised to test the strategy thoroughly and manage their risk appropriately. Always consult with a financial professional before making trading decisions.

TTM Grid StrategyThis strategy uses a TTM (based on EMAs of highs and lows) to determine the market's trend direction.
It then deploys a grid trading system around a dynamically updated base price, with the grid's direction and levels adjusting based on the trend.
Trades are executed as the price crosses the predefined grid levels, with the strategy risking a set percentage of equity per trade.
Core Strategy Logic:
TTM State Calculation (ttmState() function):
* Calculates two EMAs based on the `ttmPeriod`: one for the lows (`lowMA`) and one for the highs (`highMA`).
* Defines two threshold levels: `lowThird` (1/3 from the bottom) and `highThird` (2/3 from the bottom) of the range between `highMA` and `lowMA`.
* Returns the current TTM state as an integer:
+ `1` if the close price is above `highThird` (indicating an uptrend).
+ `0` if the close price is below `lowThird` (indicating a downtrend).
+ `-1` if the close price is between `lowThird` and `highThird` (indicating a neutral state).