Eliora Gold 1min (Heikin Ashi)Eliora -focused trading strategy designed for anything on the 1-minute timeframe using Heikin Ashi candles. This mode combines advanced market logic with structured risk management to deliver smooth, disciplined trade execution.
Key Features:
✅ Trend Confirmation – Aligns with dominant market direction for higher accuracy.
✅ ATR-Based Volatility Filter – Avoids high-risk conditions and chaotic price action.
✅ Candle Strength Logic – Filters weak setups, focusing on strong momentum.
✅ Balanced Risk/Reward – Calculates stop-loss and take-profit dynamically for consistent results.
✅ Cooldown & Overtrade Protection – Limits frequency to maintain trade quality.
This version of Eliora is built for scalpers and intraday traders seeking high-probability entries with graceful exits.
Trend Analizi

Auto Intelligence Selective Moving Average(AI/MA)# 🤖 Auto Intelligence Moving Average Strategy (AI/MA)
**AI/MA** is a state-adaptive moving average crossover strategy designed to **maximize returns from golden cross / death cross logic** by intelligently switching between different MA types and parameters based on market conditions.
---
## 🎯 Objective
To build a moving average crossover strategy that:
- **Adapts dynamically** to market regimes (trend vs range, rising vs falling)
- **Switches intelligently** between SMA, EMA, RMA, and HMA
- **Maximizes cumulative return** under realistic backtesting
---
## 🧪 materials amd methods
- **MA Types Considered**: SMA, EMA, RMA, HMA
- **Parameter Ranges**: Periods from 5 to 40
- **Market Conditions Classification**:
- Based on the slope of a central SMA(20) line
- And the relative position of price to the central line
- Resulting in 4 regimes: A (Bull), B (Pullback), C (Rebound), D (Bear)
- **Optimization Dataset**:
- **Bybit BTCUSDT.P**
- **1-hour candles**
- **2024 full-year**
- **Search Process**:
- **Random search**: 200 parameter combinations
- Evaluated by:
- `Cumulative PnL`
- `Sharpe Ratio`
- `Max Drawdown`
- `R² of linear regression on cumulative PnL`
- **Implementation**:
- Optimization performed in **Python (Pandas + Matplotlib + Optuna-like logic)**
- Final parameters ported to **Pine Script (v5)** for TradingView backtesting
---
## 📈 Performance Highlights (on optimization set)
| Timeframe | Return (%) | Notes |
|-----------|------------|----------------------------|
| 6H | +1731% | Strongest performance |
| 1D | +1691% | Excellent trend capture |
| 12H | +1438% | Balance of trend/range |
| 5min | +27.3% | Even survives scalping |
| 1min | +9.34% | Robust against noise |
- Leverage: 100x
- Position size: 100%
- Fees: 0.055%
- Margin calls: **none** 🎯
---
## 🛠 Technology Stack
- `Python` for data handling and optimization
- `Pine Script v5` for implementation and visualization
- Fully state-aware strategy, modular and extendable
---
## ✨ Final Words
This strategy is **not curve-fitted**, **not over-parameterized**, and has been validated across multiple timeframes. If you're a fan of dynamic, intelligent technical systems, feel free to use and expand it.
💡 The future of simple-yet-smart trading begins here.

Pullback Pro Dow Strategy v7 (ADX Filter)
### **Strategy Description (For TradingView)**
#### **Title:** Pullback Pro: Dow Theory & ADX Strategy
---
#### **1. Summary**
This strategy is designed to identify and trade pullbacks within an established trend, based on the core principles of Dow Theory. It uses market structure (pivot highs and lows) to determine the trend direction and an Exponential Moving Average (EMA) to pinpoint pullback entry opportunities.
To enhance trade quality and avoid ranging markets, an ADX (Average Directional Index) filter is integrated to ensure that entries are only taken when the trend has sufficient momentum.
---
#### **2. Core Logic: How It Works**
The strategy's logic is broken down into three main steps:
**Step 1: Trend Determination (Dow Theory)**
* The primary trend is identified by analyzing recent pivot points.
* An **Uptrend** is confirmed when the script detects a pattern of higher highs and higher lows (HH/HL).
* A **Downtrend** is confirmed by a pattern of lower highs and lower lows (LH/LL).
* If neither pattern is present, the strategy considers the market to be in a range and will not seek trades.
**Step 2: Entry Signal (Pullback to EMA)**
* Once a clear trend is established, the strategy waits for a price correction.
* **Long Entry:** In a confirmed uptrend, a long position is initiated when the price pulls back and crosses *under* the specified EMA.
* **Short Entry:** In a confirmed downtrend, a short position is initiated when the price rallies and crosses *over* the EMA.
**Step 3: Confirmation & Risk Management**
* **ADX Filter:** To ensure the trend is strong enough to trade, an entry signal is only validated if the ADX value is above a user-defined threshold (e.g., 25). This helps filter out weak signals during choppy or consolidating markets.
* **Stop Loss:** The initial Stop Loss is automatically and logically placed at the last market structure point:
* For long trades, it's placed at the `lastPivotLow`.
* For short trades, it's placed at the `lastPivotHigh`.
* **Take Profit:** Two Take Profit levels are calculated based on user-defined Risk-to-Reward (R:R) ratios. The strategy allows for partial profit-taking at the first target (TP1), moving the remainder of the position to the second target (TP2).
---
#### **3. Input Settings Explained**
**① Dow Theory Settings**
* **Pivot Lookback Period:** Determines the sensitivity for detecting pivot highs and lows. A smaller number makes it more sensitive to recent price swings; a larger number focuses on more significant, longer-term pivots.
**② Entry Logic (Pullback)**
* **Pullback EMA Length:** Sets the period for the Exponential Moving Average used to identify pullback entries.
**③ Risk & Exit Management**
* **Take Profit 1 R:R:** Sets the Risk-to-Reward ratio for the first take-profit target.
* **Take Profit 1 (%):** The percentage of the position to be closed when TP1 is hit.
* **Take Profit 2 R:R:** Sets the Risk-to-Reward ratio for the final take-profit target.
**④ Filters**
* **Use ADX Trend Filter:** A master switch to enable or disable the ADX filter.
* **ADX Length:** The lookback period for the ADX calculation.
* **ADX Threshold:** The minimum ADX value required to confirm a trade signal. Trades will only be placed if the ADX is above this level.
---
#### **4. Best Practices & Recommendations**
* This is a trend-following system. It is designed to perform best in markets that exhibit clear, sustained trending behavior.
* It may underperform in choppy, sideways, or strongly ranging markets. The ADX filter is designed to help mitigate this, but no filter is perfect.
* **Crucially, you must backtest this strategy thoroughly** on your preferred financial instrument and timeframe before considering any live application.
* Experiment with the `Pivot Lookback Period`, `Pullback EMA Length`, and `ADX Threshold` to optimize performance for a specific market's characteristics.
---
#### **DISCLAIMER**
This script is provided for educational and informational purposes only. It does not constitute financial advice. All trading involves a high level of risk, and past performance is not indicative of future results. You are solely responsible for your own trading decisions. The author assumes no liability for any financial losses you may incur from using this strategy. Always conduct your own research and due diligence.

VoVix DEVMA🌌 VoVix DEVMA: A Deep Dive into Second-Order Volatility Dynamics
Welcome to VoVix+, a sophisticated trading framework that transcends traditional price analysis. This is not merely another indicator; it is a complete system designed to dissect and interpret the very fabric of market volatility. VoVix+ operates on the principle that the most powerful signals are not found in price alone, but in the behavior of volatility itself. It analyzes the rate of change, the momentum, and the structure of market volatility to identify periods of expansion and contraction, providing a unique edge in anticipating major market moves.
This document will serve as your comprehensive guide, breaking down every mathematical component, every user input, and every visual element to empower you with a profound understanding of how to harness its capabilities.
🔬 THEORETICAL FOUNDATION: THE MATHEMATICS OF MARKET DYNAMICS
VoVix+ is built upon a multi-layered mathematical engine designed to measure what we call "second-order volatility." While standard indicators analyze price, and first-order volatility indicators (like ATR) analyze the range of price, VoVix+ analyzes the dynamics of the volatility itself. This provides insight into the market's underlying state of stability or chaos.
1. The VoVix Score: Measuring Volatility Thrust
The core of the system begins with the VoVix Score. This is a normalized measure of volatility acceleration or deceleration.
Mathematical Formula:
VoVix Score = (ATR(fast) - ATR(slow)) / (StDev(ATR(fast)) + ε)
Where:
ATR(fast) is the Average True Range over a short period, representing current, immediate volatility.
ATR(slow) is the Average True Range over a longer period, representing the baseline or established volatility.
StDev(ATR(fast)) is the Standard Deviation of the fast ATR, which measures the "noisiness" or consistency of recent volatility.
ε (epsilon) is a very small number to prevent division by zero.
Market Implementation:
Positive Score (Expansion): When the fast ATR is significantly higher than the slow ATR, it indicates a rapid increase in volatility. The market is "stretching" or expanding.
Negative Score (Contraction): When the fast ATR falls below the slow ATR, it indicates a decrease in volatility. The market is "coiling" or contracting.
Normalization: By dividing by the standard deviation, we normalize the score. This turns it into a standardized measure, allowing us to compare volatility thrust across different market conditions and timeframes. A score of 2.0 in a quiet market means the same, relatively, as a score of 2.0 in a volatile market.
2. Deviation Analysis (DEV): Gauging Volatility's Own Volatility
The script then takes the analysis a step further. It calculates the standard deviation of the VoVix Score itself.
Mathematical Formula:
DEV = StDev(VoVix Score, lookback_period)
Market Implementation:
This DEV value represents the magnitude of chaos or stability in the market's volatility dynamics. A high DEV value means the volatility thrust is erratic and unpredictable. A low DEV value suggests the change in volatility is smooth and directional.
3. The DEVMA Crossover: Identifying Regime Shifts
This is the primary signal generator. We take two moving averages of the DEV value.
Mathematical Formula:
fastDEVMA = SMA(DEV, fast_period)
slowDEVMA = SMA(DEV, slow_period)
The Core Signal:
The strategy triggers on the crossover and crossunder of these two DEVMA lines. This is a profound concept: we are not looking at a moving average of price or even of volatility, but a moving average of the standard deviation of the normalized rate of change of volatility.
Bullish Crossover (fastDEVMA > slowDEVMA): This signals that the short-term measure of volatility's chaos is increasing relative to the long-term measure. This often precedes a significant market expansion and is interpreted as a bullish volatility regime.
Bearish Crossunder (fastDEVMA < slowDEVMA): This signals that the short-term measure of volatility's chaos is decreasing. The market is settling down or contracting, often leading to trending moves or range consolidation.
⚙️ INPUTS MENU: CONFIGURING YOUR ANALYSIS ENGINE
Every input has been meticulously designed to give you full control over the strategy's behavior. Understanding these settings is key to adapting VoVix+ to your specific instrument, timeframe, and trading style.
🌀 VoVix DEVMA Configuration
🧬 Deviation Lookback: This sets the lookback period for calculating the DEV value. It defines the window for measuring the stability of the VoVix Score. A shorter value makes the system highly reactive to recent changes in volatility's character, ideal for scalping. A longer value provides a smoother, more stable reading, better for identifying major, long-term regime shifts.
⚡ Fast VoVix Length: This is the lookback period for the fastDEVMA. It represents the short-term trend of volatility's chaos. A smaller number will result in a faster, more sensitive signal line that reacts quickly to market shifts.
🐌 Slow VoVix Length: This is the lookback period for the slowDEVMA. It represents the long-term, baseline trend of volatility's chaos. A larger number creates a more stable, slower-moving anchor against which the fast line is compared.
How to Optimize: The relationship between the Fast and Slow lengths is crucial. A wider gap (e.g., 20 and 60) will result in fewer, but potentially more significant, signals. A narrower gap (e.g., 25 and 40) will generate more frequent signals, suitable for more active trading styles.
🧠 Adaptive Intelligence
🧠 Enable Adaptive Features: When enabled, this activates the strategy's performance tracking module. The script will analyze the outcome of its last 50 trades to calculate a dynamic win rate.
⏰ Adaptive Time-Based Exit: If Enable Adaptive Features is on, this allows the strategy to adjust its Maximum Bars in Trade setting based on performance. It learns from the average duration of winning trades. If winning trades tend to be short, it may shorten the time exit to lock in profits. If winners tend to run, it will extend the time exit, allowing trades more room to develop. This helps prevent the strategy from cutting winning trades short or holding losing trades for too long.
⚡ Intelligent Execution
📊 Trade Quantity: A straightforward input that defines the number of contracts or shares for each trade. This is a fixed value for consistent position sizing.
🛡️ Smart Stop Loss: Enables the dynamic stop-loss mechanism.
🎯 Stop Loss ATR Multiplier: Determines the distance of the stop loss from the entry price, calculated as a multiple of the current 14-period ATR. A higher multiplier gives the trade more room to breathe but increases risk per trade. A lower multiplier creates a tighter stop, reducing risk but increasing the chance of being stopped out by normal market noise.
💰 Take Profit ATR Multiplier: Sets the take profit target, also as a multiple of the ATR. A common practice is to set this higher than the Stop Loss multiplier (e.g., a 2:1 or 3:1 reward-to-risk ratio).
🏃 Use Trailing Stop: This is a powerful feature for trend-following. When enabled, instead of a fixed stop loss, the stop will trail behind the price as the trade moves into profit, helping to lock in gains while letting winners run.
🎯 Trail Points & 📏 Trail Offset ATR Multipliers: These control the trailing stop's behavior. Trail Points defines how much profit is needed before the trail activates. Trail Offset defines how far the stop will trail behind the current price. Both are based on ATR, making them fully adaptive to market volatility.
⏰ Maximum Bars in Trade: This is a time-based stop. It forces an exit if a trade has been open for a specified number of bars, preventing positions from being held indefinitely in stagnant markets.
⏰ Session Management
These inputs allow you to confine the strategy's trading activity to specific market hours, which is crucial for day trading instruments that have defined high-volume sessions (e.g., stock market open).
🎨 Visual Effects & Dashboard
These toggles give you complete control over the on-chart visuals and the dashboard. You can disable any element to declutter your chart or focus only on the information that matters most to you.
📊 THE DASHBOARD: YOUR AT-A-GLANCE COMMAND CENTER
The dashboard centralizes all critical information into one compact, easy-to-read panel. It provides a real-time summary of the market state and strategy performance.
🎯 VOVIX ANALYSIS
Fast & Slow: Displays the current numerical values of the fastDEVMA and slowDEVMA. The color indicates their direction: green for rising, red for falling. This lets you see the underlying momentum of each line.
Regime: This is your most important environmental cue. It tells you the market's current state based on the DEVMA relationship. 🚀 EXPANSION (Green) signifies a bullish volatility regime where explosive moves are more likely. ⚛️ CONTRACTION (Purple) signifies a bearish volatility regime, where the market may be consolidating or entering a smoother trend.
Quality: Measures the strength of the last signal based on the magnitude of the DEVMA difference. An ELITE or STRONG signal indicates a high-conviction setup where the crossover had significant force.
PERFORMANCE
Win Rate & Trades: Displays the historical win rate of the strategy from the backtest, along with the total number of closed trades. This provides immediate feedback on the strategy's historical effectiveness on the current chart.
EXECUTION
Trade Qty: Shows your configured position size per trade.
Session: Indicates whether trading is currently OPEN (allowed) or CLOSED based on your session management settings.
POSITION
Position & PnL: Displays your current position (LONG, SHORT, or FLAT) and the real-time Profit or Loss of the open trade.
🧠 ADAPTIVE STATUS
Stop/Profit Mult: In this simplified version, these are placeholders. The primary adaptive feature currently modifies the time-based exit, which is reflected in how long trades are held on the chart.
🎨 THE VISUAL UNIVERSE: DECIPHERING MARKET GEOMETRY
The visuals are not mere decorations; they are geometric representations of the underlying mathematical concepts, designed to give you an intuitive feel for the market's state.
The Core Lines:
FastDEVMA (Green/Maroon Line): The primary signal line. Green when rising, indicating an increase in short-term volatility chaos. Maroon when falling.
SlowDEVMA (Aqua/Orange Line): The baseline. Aqua when rising, indicating a long-term increase in volatility chaos. Orange when falling.
🌊 Morphism Flow (Flowing Lines with Circles):
What it represents: This visualizes the momentum and strength of the fastDEVMA. The width and intensity of the "beam" are proportional to the signal strength.
Interpretation: A thick, steep, and vibrant flow indicates powerful, committed momentum in the current volatility regime. The floating '●' particles represent kinetic energy; more particles suggest stronger underlying force.
📐 Homotopy Paths (Layered Transparent Boxes):
What it represents: These layered boxes are centered between the two DEVMA lines. Their height is determined by the DEV value.
Interpretation: This visualizes the overall "volatility of volatility." Wider boxes indicate a chaotic, unpredictable market. Narrower boxes suggest a more stable, predictable environment.
🧠 Consciousness Field (The Grid):
What it represents: This grid provides a historical lookback at the DEV range.
Interpretation: It maps the recent "consciousness" or character of the market's volatility. A consistently wide grid suggests a prolonged period of chaos, while a narrowing grid can signal a transition to a more stable state.
📏 Functorial Levels (Projected Horizontal Lines):
What it represents: These lines extend from the current fastDEVMA and slowDEVMA values into the future.
Interpretation: Think of these as dynamic support and resistance levels for the volatility structure itself. A crossover becomes more significant if it breaks cleanly through a prior established level.
🌊 Flow Boxes (Spaced Out Boxes):
What it represents: These are compact visual footprints of the current regime, colored green for Expansion and red for Contraction.
Interpretation: They provide a quick, at-a-glance confirmation of the dominant volatility flow, reinforcing the background color.
Background Color:
This provides an immediate, unmistakable indication of the current volatility regime. Light Green for Expansion and Light Aqua/Blue for Contraction, allowing you to assess the market environment in a split second.
📊 BACKTESTING PERFORMANCE REVIEW & ANALYSIS
The following is a factual, transparent review of a backtest conducted using the strategy's default settings on a specific instrument and timeframe. This information is presented for educational purposes to demonstrate how the strategy's mechanics performed over a historical period. It is crucial to understand that these results are historical, apply only to the specific conditions of this test, and are not a guarantee or promise of future performance. Market conditions are dynamic and constantly change.
Test Parameters & Conditions
To ensure the backtest reflects a degree of real-world conditions, the following parameters were used. The goal is to provide a transparent baseline, not an over-optimized or unrealistic scenario.
Instrument: CME E-mini Nasdaq 100 Futures (NQ1!)
Timeframe: 5-Minute Chart
Backtesting Range: March 24, 2024, to July 09, 2024
Initial Capital: $100,000
Commission: $0.62 per contract (A realistic cost for futures trading).
Slippage: 3 ticks per trade (A conservative setting to account for potential price discrepancies between order placement and execution).
Trade Size: 1 contract per trade.
Performance Overview (Historical Data)
The test period generated 465 total trades , providing a statistically significant sample size for analysis, which is well above the recommended minimum of 100 trades for a strategy evaluation.
Profit Factor: The historical Profit Factor was 2.663 . This metric represents the gross profit divided by the gross loss. In this test, it indicates that for every dollar lost, $2.663 was gained.
Percent Profitable: Across all 465 trades, the strategy had a historical win rate of 84.09% . While a high figure, this is a historical artifact of this specific data set and settings, and should not be the sole basis for future expectations.
Risk & Trade Characteristics
Beyond the headline numbers, the following metrics provide deeper insight into the strategy's historical behavior.
Sortino Ratio (Downside Risk): The Sortino Ratio was 6.828 . Unlike the Sharpe Ratio, this metric only measures the volatility of negative returns. A higher value, such as this one, suggests that during this test period, the strategy was highly efficient at managing downside volatility and large losing trades relative to the profits it generated.
Average Trade Duration: A critical characteristic to understand is the strategy's holding period. With an average of only 2 bars per trade , this configuration operates as a very short-term, or scalping-style, system. Winning trades averaged 2 bars, while losing trades averaged 4 bars. This indicates the strategy's logic is designed to capture quick, high-probability moves and exit rapidly, either at a profit target or a stop loss.
Conclusion and Final Disclaimer
This backtest demonstrates one specific application of the VoVix+ framework. It highlights the strategy's behavior as a short-term system that, in this historical test on NQ1!, exhibited a high win rate and effective management of downside risk. Users are strongly encouraged to conduct their own backtests on different instruments, timeframes, and date ranges to understand how the strategy adapts to varying market structures. Past performance is not indicative of future results, and all trading involves significant risk.
🔧 THE DEVELOPMENT PHILOSOPHY: FROM VOLATILITY TO CLARITY
The journey to create VoVix+ began with a simple question: "What drives major market moves?" The answer is often not a change in price direction, but a fundamental shift in market volatility. Standard indicators are reactive to price. We wanted to create a system that was predictive of market state. VoVix+ was designed to go one level deeper—to analyze the behavior, character, and momentum of volatility itself.
The challenge was twofold. First, to create a robust mathematical model to quantify these abstract concepts. This led to the multi-layered analysis of ATR differentials and standard deviations. Second, to make this complex data intuitive and actionable. This drove the creation of the "Visual Universe," where abstract mathematical values are translated into geometric shapes, flows, and fields. The adaptive system was intentionally kept simple and transparent, focusing on a single, impactful parameter (time-based exits) to provide performance feedback without becoming an inscrutable "black box." The result is a tool that is both profoundly deep in its analysis and remarkably clear in its presentation.
⚠️ RISK DISCLAIMER AND BEST PRACTICES
VoVix+ is an advanced analytical tool, not a guarantee of future profits. All financial markets carry inherent risk. The backtesting results shown by the strategy are historical and do not guarantee future performance. This strategy incorporates realistic commission and slippage settings by default, but market conditions can vary. Always practice sound risk management, use position sizes appropriate for your account equity, and never risk more than you can afford to lose. It is recommended to use this strategy as part of a comprehensive trading plan. This was developed specifically for Futures
"The prevailing wisdom is that markets are always right. I take the opposite view. I assume that markets are always wrong. Even if my assumption is occasionally wrong, I use it as a working hypothesis."
— George Soros
— Dskyz, Trade with insight. Trade with anticipation.

Enhanced Ichimoku Cloud Strategy V1 [Quant Trading]Overview
This strategy combines the powerful Ichimoku Kinko Hyo system with a 171-period Exponential Moving Average (EMA) filter to create a robust trend-following approach. The strategy is designed for traders seeking to capitalize on strong momentum moves while using the Ichimoku cloud structure to identify optimal entry and exit points.
This is a patient, low-frequency trading system that prioritizes quality over quantity. In backtesting on Solana, the strategy achieved impressive results with approximately 3600% profit over just 29 trades, demonstrating its effectiveness at capturing major trend movements rather than attempting to profit from every market fluctuation. The extended parameters and strict entry criteria are specifically optimized for Solana's price action characteristics, making it well-suited for traders who prefer fewer, higher-conviction positions over high-frequency trading approaches.
What Makes This Strategy Original
This implementation enhances the traditional Ichimoku system by:
Custom Ichimoku Parameters: Uses non-standard periods (Conversion: 7, Base: 211, Lagging Span 2: 120, Displacement: 41) optimized for different market conditions
EMA Confirmation Filter: Incorporates a 171-period EMA as an additional trend confirmation layer
State Memory System: Implements a sophisticated memory system to track buy/sell states and prevent false signals
Dual Trade Modes: Offers both traditional Ichimoku signals ("Ichi") and cloud-based signals ("Cloud")
Breakout Confirmation: Requires price to break above the 25-period high for long entries
How It Works
Core Components
Ichimoku Elements:
-Conversion Line (Tenkan-sen): 7-period Donchian midpoint
-Base Line (Kijun-sen): 211-period Donchian midpoint
-Span A (Senkou Span A): Average of Conversion and Base lines, plotted 41 periods ahead
-Span B (Senkou Span B): 120-period Donchian midpoint, plotted 41 periods ahead
-Lagging Span (Chikou Span): Current close plotted 41 periods back
EMA Filter: 171-period EMA acts as a long-term trend filter
Entry Logic (Ichi Mode - Default)
A long position is triggered when ALL conditions are met:
Cloud Bullish: Span A > Span B (41 periods ago)
Breakout Confirmation: Current close > 25-period high
Ichimoku Bullish: Conversion Line > Base Line
Trend Alignment: Current close > 171-period EMA
State Memory: No previous buy signal is still active
Exit Logic
Positions are closed when:
Ichimoku Bearish: Conversion Line < Base Line
Alternative Cloud Mode
When "Cloud" mode is selected, the strategy uses:
Entry: Span A crosses above Span B with additional cloud and EMA confirmations
Exit: Span A crosses below Span B with cloud and EMA confirmations
Default Settings Explained
Strategy Properties
Initial Capital: $1,000 (realistic for average traders)
Position Size: 100% of equity (appropriate for backtesting single-asset strategies)
Commission: 0.1% (realistic for most brokers)
Slippage: 3 ticks (accounts for realistic execution costs)
Date Range: January 1, 2018 to December 31, 2069
Key Parameters
Conversion Periods: 7 (faster than traditional 9, more responsive to price changes)
Base Periods: 211 (much longer than traditional 26, provides stronger trend confirmation)
Lagging Span 2 Periods: 120 (custom period for stronger support/resistance levels)
Displacement: 41 (projects cloud further into future than standard 26)
EMA Period: 171 (long-term trend filter, approximately 8.5 months of daily data)
How to Use This Strategy
Best Market Conditions
Trending Markets: Works best in clearly trending markets where the cloud provides strong directional bias
Medium to Long-term Timeframes: Optimized for daily charts and higher timeframes
Volatile Assets: The breakout confirmation helps filter out weak signals in choppy markets
Risk Management
The strategy uses 100% equity allocation, suitable for backtesting single strategies
Consider reducing position size when implementing with real capital
Monitor the 25-period high breakout requirement as it may delay entries in fast-moving markets
Visual Elements
Green/Red Cloud: Shows bullish/bearish cloud conditions
Yellow Line: Conversion Line (Tenkan-sen)
Blue Line: Base Line (Kijun-sen)
Orange Line: 171-period EMA trend filter
Gray Line: Lagging Span (Chikou Span)
Important Considerations
Limitations
Lagging Nature: Like all Ichimoku strategies, signals may lag significant price moves
Whipsaw Risk: Extended periods of consolidation may generate false signals
Parameter Sensitivity: Custom parameters may not work equally well across all market conditions
Backtesting Notes
Results are based on historical data and past performance does not guarantee future results
The strategy includes realistic slippage and commission costs
Default settings are optimized for backtesting and may need adjustment for live trading
Risk Disclaimer
This strategy is for educational purposes only and should not be considered financial advice. Always conduct your own analysis and risk management before implementing any trading strategy. The unique parameter combinations used may not be suitable for all market conditions or trading styles.
Customization Options
Trade Mode: Switch between "Ichi" and "Cloud" signal generation
Short Trading: Option to enable short positions (disabled by default)
Date Range: Customize backtesting period
All Ichimoku Parameters: Fully customizable for different market conditions
This enhanced Ichimoku implementation provides a structured approach to trend following while maintaining the flexibility to adapt to different trading styles and market conditions.

RSI-Adaptive T3 + Squeeze Momentum Strategy✅ Strategy Guide: RSI-Adaptive T3 + Squeeze Momentum Strategy
📌 Overview
The RSI-Adaptive T3 + Squeeze Momentum Strategy is a dynamic trend-following strategy based on an RSI-responsive T3 moving average and Squeeze Momentum detection .
It adapts in real-time to market volatility to enhance entry precision and optimize risk.
⚠️ This strategy is provided for educational and research purposes only.
Past performance does not guarantee future results.
🎯 Strategy Objectives
The main objective of this strategy is to catch the early phase of a trend and generate consistent entry signals.
Designed to be intuitive and accessible for traders from beginner to advanced levels.
✨ Key Features
RSI-Responsive T3: T3 length dynamically adjusts according to RSI values for adaptive trend detection
Squeeze Momentum: Combines Bollinger Bands and Keltner Channels to identify trend buildup phases
Visual Triggers: Entry signals are generated from T3 crossovers and momentum strength after squeeze release
📊 Trading Rules
Long Entry:
When T3 crosses upward, momentum is positive, and the squeeze has just been released.
Short Entry:
When T3 crosses downward, momentum is negative, and the squeeze has just been released.
Exit (Reversal):
When the opposite condition to the entry is triggered, the position is reversed.
💰 Risk Management Parameters
Pair & Timeframe: BTC/USD (30-minute chart)
Capital (simulated): $30,00
Order size: `$100` per trade (realistic, low-risk sizing)
Commission: 0.02%
Slippage: 2 pips
Risk per Trade: 5%
Number of Trades (backtest period): 181
📊 Performance Overview
Symbol: BTC/USD
Timeframe: 30-minute chart
Date Range: January 1, 2024 – July 3, 2025
Win Rate: 47.8%
Profit Factor: 2.01
Net Profit: 173.16 (units not specified)
Max Drawdown: 5.77% or 24.91 (0.79%)
⚙️ Indicator Parameters
Indicator Name: RSI-Adaptive T3 + Squeeze Momentum
RSI Length: 14
T3 Min Length: 5
T3 Max Length: 50
T3 Volume Factor: 0.7
BB Length: 27 (Multiplier: 2.0)
KC Length: 20 (Multiplier: 1.5, TrueRange enabled)
🖼 Visual Support
T3 slope direction, squeeze status, and momentum bars are visually plotted on the chart,
providing high clarity for quick trend analysis and execution.
🔧 Strategy Improvements & Uniqueness
Inspired by the RSI Adaptive T3 by ChartPrime and Squeeze Momentum Indicator by LazyBear ,
this strategy fuses both into a hybrid trend-reversal and momentum breakout detection system .
Compared to traditional trend-following methods, it excels at capturing early trend signals with greater sensitivity .
✅ Summary
The RSI-Adaptive T3 + Squeeze Momentum Strategy combines momentum detection with volatility-responsive risk management.
With a strong balance between visual clarity and practicality, it serves as a powerful tool for traders seeking high repeatability.
⚠️ This strategy is based on historical data and does not guarantee future profits.
Always use appropriate risk management when applying it.

Tuga SupertrendDescription
This strategy uses the Supertrend indicator enhanced with commission and slippage filters to capture trends on the daily chart. It’s designed to work on any asset but is especially effective in markets with consistent movements.
Use the date inputs to set the backtest period (default: from January 1, 2018, through today, June 30, 2025).
The default input values are optimized for the daily chart. For other timeframes, adjust the parameters to suit the asset you’re testing.
Release Notes
June 30, 2025
• Updated default backtest period to end on June 30, 2025.
• Default commission adjusted to 0.1 %.
• Slippage set to 3 ticks.
• Default slippage set to 3 ticks.
• Simplified the strategy name to “Tuga Supertrend”.
Default Parameters
Parameter Default Value
Supertrend Period 10
Multiplier (Factor) 3
Commission 0.1 %
Slippage 3 ticks
Start Date January 1, 2018
End Date June 30, 2025

LANZ Strategy 1.0 [Backtest]🔷 LANZ Strategy 1.0 — Time-Based Session Trading with Smart Reversal Logic and Risk-Controlled Limit Orders
This backtest version of LANZ Strategy 1.0 brings precision to session-based trading by using directional confirmation, pre-defined risk parameters, and limit orders that execute overnight. Designed for the 1-hour timeframe, it allows traders to evaluate the system with configurable SL, TP, and risk settings in a fully automated environment.
🧠 Core Strategy Logic:
1. Directional Confirmation at 18:00 NY:
At 18:00 NY, the system compares the 08:00 open vs the 18:00 close:
If the direction matches the previous day, the signal is reversed.
If the direction differs, the current day's trend is kept.
This logic is designed to avoid momentum exhaustion and capture corrective reversals.
2. Entry Level Definition:
Based on the confirmed direction:
For BUY, the Low of the day is used as Entry Point (EP).
For SELL, the High of the day becomes EP.
The system plots a Stop Loss and Take Profit based on user-defined pip inputs (default: SL = 18 pips, TP = 54 pips → RR 1:3).
3. Time-Limited Entry Execution (LIMIT Orders):
Orders are sent after 18:00 NY and can be triggered anytime between 18:00 and 08:00 NY.
If EP is not touched before 08:00, the order is automatically cancelled.
4. Manual Close Feature:
If the trade is still open at the configured hour (default 09:00 NY), the system closes all positions, simulating realistic intraday exit scenarios.
5. Lot Size Calculation Based on Risk:
Lot size is dynamically calculated using the account size, risk percentage, and SL distance.
This ensures consistent risk exposure regardless of market volatility.
⚙️ Step-by-Step Flow:
08:00 NY → Captures the open of the day.
18:00 NY → Confirms direction and defines EP, SL, and TP.
After 18:00 NY → If conditions are met, a LIMIT order is placed at EP.
Between 18:00–08:00 NY → If price touches EP, the trade is executed.
At 08:00 NY → If EP wasn’t touched, the order is cancelled.
At Configured Manual Close Time (default 09:00 NY) → All open positions are force-closed if still active.
🧪 Backtest Settings:
Timeframe: 1-hour only
Order Type: strategy.entry() with limit=
SL/TP Configurable: Yes, in pips
Risk Input: % of capital per trade
Manual Close Time: Fully adjustable (default 09:00 NY)
👨💻 Credits:
Developed by LANZ
Strategy logic and trading concept built with clarity and precision.
Code structure and documentation by Kairos, your AI trading assistant.
Designed for high-confidence execution and clean backtesting performance.

Out of the Noise Intraday Strategy with VWAP [YuL]This is my (naive) implementation of "Beat the Market An Effective Intraday Momentum Strategy for S&P500 ETF (SPY)" paper by Carlo Zarattini, Andrew Aziz, Andrea Barbon, so the credit goes to them.
It is supposed to run on SPY on 30-minute timeframe, there may be issues on other timeframes.
I've used settings that were used by the authors in the original paper to keep it close to the publication, but I understand that they are very aggressive and probably shouldn't be used like that.
Results are good, but not as good as they are stated in the paper (unsurprisingly?): returns are smaller and Sharpe is very low (which is actually weird given the returns and drawdown ratio), there are also margin calls if you enable margin check (and you should).
I have my own ideas of improvements which I will probably implement separately to keep this clean.

US30 Stealth StrategyOnly works on US30 (CAPITALCOM) 5 Minute chart
📈 Core Concept:
This is a trend-following strategy that captures strong market continuations by entering on:
The 3rd swing in the current trend,
Confirmed by a volume-verified engulfing candle,
With adaptive SL/TP and position sizing based on risk.
🧠 Entry Logic:
✅ Trend Filter
Uses a 50-period Simple Moving Average (SMA).
Buy only if price is above SMA → Uptrend
Sell only if price is below SMA → Downtrend
✅ Swing Count Logic
For buy: Wait for the 3rd higher low
For sell: Wait for the 3rd lower high
Uses a 5-bar lookback to detect highs/lows
This ensures you’re not buying early — but after trend is confirmed with structure.
✅ Engulfing Candle Confirmation
Bullish engulfing for buys
Bearish engulfing for sells
Candle must engulf previous bar completely (body logic)
✅ Volume Filter
Current candle volume must be greater than the 20-period volume average
Ensures trades only occur with institutional participation
✅ MA Slope Filter
Requires the slope of the 50 SMA over the last 3 candles to exceed 0.1
Avoids chop or flat trends
Adds momentum confirmation to the trade
✅ Session Filter (Time Filter)
Trades only executed between:
2:00 AM to 11:00 PM Oman Time (UTC+4)
Helps avoid overnight chop and illiquidity
📊 Position Sizing & Risk Management
✅ Smart SL (Adaptive Stop Loss)
SL is based on full size of the signal candle (including wick)
But if candle is larger than 25 points, SL is cut to half the size
This prevents oversized risk from long signals during volatile moves.

Long/Short/Exit/Risk management Strategy # LongShortExit Strategy Documentation
## Overview
The LongShortExit strategy is a versatile trading system for TradingView that provides complete control over entry, exit, and risk management parameters. It features a sophisticated framework for managing long and short positions with customizable profit targets, stop-loss mechanisms, partial profit-taking, and trailing stops. The strategy can be enhanced with continuous position signals for visual feedback on the current trading state.
## Key Features
### General Settings
- **Trading Direction**: Choose to trade long positions only, short positions only, or both.
- **Max Trades Per Day**: Limit the number of trades per day to prevent overtrading.
- **Bars Between Trades**: Enforce a minimum number of bars between consecutive trades.
### Session Management
- **Session Control**: Restrict trading to specific times of the day.
- **Time Zone**: Specify the time zone for session calculations.
- **Expiration**: Optionally set a date when the strategy should stop executing.
### Contract Settings
- **Contract Type**: Select from common futures contracts (MNQ, MES, NQ, ES) or custom values.
- **Point Value**: Define the dollar value per point movement.
- **Tick Size**: Set the minimum price movement for accurate calculations.
### Visual Signals
- **Continuous Position Signals**: Implement 0 to 1 visual signals to track position states.
- **Signal Plotting**: Customize color and appearance of position signals.
- **Clear Visual Feedback**: Instantly see when entry conditions are triggered.
### Risk Management
#### Stop Loss and Take Profit
- **Risk Type**: Choose between percentage-based, ATR-based, or points-based risk management.
- **Percentage Mode**: Set SL/TP as a percentage of entry price.
- **ATR Mode**: Set SL/TP as a multiple of the Average True Range.
- **Points Mode**: Set SL/TP as a fixed number of points from entry.
#### Advanced Exit Features
- **Break-Even**: Automatically move stop-loss to break-even after reaching specified profit threshold.
- **Trailing Stop**: Implement a trailing stop-loss that follows price movement at a defined distance.
- **Partial Profit Taking**: Take partial profits at predetermined price levels:
- Set first partial exit point and percentage of position to close
- Set second partial exit point and percentage of position to close
- **Time-Based Exit**: Automatically exit a position after a specified number of bars.
#### Win/Loss Streak Management
- **Streak Cutoff**: Automatically pause trading after a series of consecutive wins or losses.
- **Daily Reset**: Option to reset streak counters at the start of each day.
### Entry Conditions
- **Source and Value**: Define the exact price source and value that triggers entries.
- **Equals Condition**: Entry signals occur when the source exactly matches the specified value.
### Performance Analytics
- **Real-Time Stats**: Track important performance metrics like win rate, P&L, and largest wins/losses.
- **Visual Feedback**: On-chart markers for entries, exits, and important events.
### External Integration
- **Webhook Support**: Compatible with TradingView's webhook alerts for automated trading.
- **Cross-Platform**: Connect to external trading systems and notification platforms.
- **Custom Order Execution**: Implement advanced order flows through external services.
## How to Use
### Setup Instructions
1. Add the script to your TradingView chart.
2. Configure the general settings based on your trading preferences.
3. Set session trading hours if you only want to trade specific times.
4. Select your contract specifications or customize for your instrument.
5. Configure risk parameters:
- Choose your preferred risk management approach
- Set appropriate stop-loss and take-profit levels
- Enable advanced features like break-even, trailing stops, or partial profit taking as needed
6. Define entry conditions:
- Select the price source (such as close, open, high, or an indicator)
- Set the specific value that should trigger entries
### Entry Condition Examples
- **Example 1**: To enter when price closes exactly at a whole number:
- Long Source: close
- Long Value: 4200 (for instance, to enter when price closes exactly at 4200)
- **Example 2**: To enter when an indicator reaches a specific value:
- Long Source: ta.rsi(close, 14)
- Long Value: 30 (triggers when RSI equals exactly 30)
### Best Practices
1. **Always backtest thoroughly** before using in live trading.
2. **Start with conservative risk settings**:
- Small position sizes
- Reasonable stop-loss distances
- Limited trades per day
3. **Monitor and adjust**:
- Use the performance table to track results
- Adjust parameters based on how the strategy performs
4. **Consider market volatility**:
- Use ATR-based stops during volatile periods
- Use fixed points during stable markets
## Continuous Position Signals Implementation
The LongShortExit strategy can be enhanced with continuous position signals to provide visual feedback about the current position state. These signals can help you track when the strategy is in a long or short position.
### Adding Continuous Position Signals
Add the following code to implement continuous position signals (0 to 1):
```pine
// Continuous position signals (0 to 1)
var float longSignal = 0.0
var float shortSignal = 0.0
// Update position signals based on your indicator's conditions
longSignal := longCondition ? 1.0 : 0.0
shortSignal := shortCondition ? 1.0 : 0.0
// Plot continuous signals
plot(longSignal, title="Long Signal", color=#00FF00, linewidth=2, transp=0, style=plot.style_line)
plot(shortSignal, title="Short Signal", color=#FF0000, linewidth=2, transp=0, style=plot.style_line)
```
### Benefits of Continuous Position Signals
- Provides clear visual feedback of current position state (long/short)
- Signal values stay consistent (0 or 1) until condition changes
- Can be used for additional calculations or alert conditions
- Makes it easier to track when entry conditions are triggered
### Using with Custom Indicators
You can adapt the continuous position signals to work with any custom indicator by replacing the condition with your indicator's logic:
```pine
// Example with moving average crossover
longSignal := fastMA > slowMA ? 1.0 : 0.0
shortSignal := fastMA < slowMA ? 1.0 : 0.0
```
## Webhook Integration
The LongShortExit strategy is fully compatible with TradingView's webhook alerts, allowing you to connect your strategy to external trading platforms, brokers, or custom applications for automated trading execution.
### Setting Up Webhooks
1. Create an alert on your chart with the LongShortExit strategy
2. Enable the "Webhook URL" option in the alert dialog
3. Enter your webhook endpoint URL (from your broker or custom trading system)
4. Customize the alert message with relevant information using TradingView variables
### Webhook Message Format Example
```json
{
"strategy": "LongShortExit",
"action": "{{strategy.order.action}}",
"price": "{{strategy.order.price}}",
"quantity": "{{strategy.position_size}}",
"time": "{{time}}",
"ticker": "{{ticker}}",
"position_size": "{{strategy.position_size}}",
"position_value": "{{strategy.position_value}}",
"order_id": "{{strategy.order.id}}",
"order_comment": "{{strategy.order.comment}}"
}
```
### TradingView Alert Condition Examples
For effective webhook automation, set up these alert conditions:
#### Entry Alert
```
{{strategy.position_size}} != {{strategy.position_size}}
```
#### Exit Alert
```
{{strategy.position_size}} < {{strategy.position_size}} or {{strategy.position_size}} > {{strategy.position_size}}
```
#### Partial Take Profit Alert
```
strategy.order.comment contains "Partial TP"
```
### Benefits of Webhook Integration
- **Automated Trading**: Execute trades automatically through supported brokers
- **Cross-Platform**: Connect to custom trading bots and applications
- **Real-Time Notifications**: Receive trade signals on external platforms
- **Data Collection**: Log trade data for further analysis
- **Custom Order Management**: Implement advanced order types not available in TradingView
### Compatible External Applications
- Trading bots and algorithmic trading software
- Custom order execution systems
- Discord, Telegram, or Slack notification systems
- Trade journaling applications
- Risk management platforms
### Implementation Recommendations
- Test webhook delivery using a free service like webhook.site before connecting to your actual trading system
- Include authentication tokens or API keys in your webhook URL or payload when required by your external service
- Consider implementing confirmation mechanisms to verify trade execution
- Log all webhook activities for troubleshooting and performance tracking
## Strategy Customization Tips
### For Scalping
- Set smaller profit targets (1-3 points)
- Use tighter stop-losses
- Enable break-even feature after small profit
- Set higher max trades per day
### For Day Trading
- Use moderate profit targets
- Implement partial profit taking
- Enable trailing stops
- Set reasonable session trading hours
### For Swing Trading
- Use longer-term charts
- Set wider stops (ATR-based often works well)
- Use higher profit targets
- Disable daily streak reset
## Common Troubleshooting
### Low Win Rate
- Consider widening stop-losses
- Verify that entry conditions aren't triggering too frequently
- Check if the equals condition is too restrictive; consider small tolerances
### Missing Obvious Trades
- The equals condition is extremely precise. Price must exactly match the specified value.
- Consider using floating-point precision for more reliable triggers
### Frequent Stop-Outs
- Try ATR-based stops instead of fixed points
- Increase the stop-loss distance
- Enable break-even feature to protect profits
## Important Notes
- The exact equals condition is strict and may result in fewer trade signals compared to other conditions.
- For instruments with decimal prices, exact equality might be rare. Consider the precision of your value.
- Break-even and trailing stop calculations are based on points, not percentage.
- Partial take-profit levels are defined in points distance from entry.
- The continuous position signals (0 to 1) provide valuable visual feedback but don't affect the strategy's trading logic directly.
- When implementing continuous signals, ensure they're aligned with the actual entry conditions used by the strategy.
---
*This strategy is for educational and informational purposes only. Always test thoroughly before using with real funds.*

Timeshifter Triple Timeframe Strategy w/ SessionsOverview
The "Enhanced Timeshifter Triple Timeframe Strategy with Session Filtering" is a sophisticated trading strategy designed for the TradingView platform. It integrates multiple technical indicators across three different timeframes and allows traders to customize their trading Sessions. This strategy is ideal for traders who wish to leverage multi-timeframe analysis and session-based trading to enhance their trading decisions.
Features
Multi-Timeframe Analysis and direction:
Higher Timeframe: Set to a daily timeframe by default, providing a broader view of market trends.
Trading Timeframe: Automatically set to the current chart timeframe, ensuring alignment with the trader's primary analysis period.
Lower Timeframe: Set to a 15-minute timeframe by default, offering a granular view for precise entry and exit points.
Indicator Selection:
RMI (Relative Momentum Index): Combines RSI and MFI to gauge market momentum.
TWAP (Time Weighted Average Price): Provides an average price over a specified period, useful for identifying trends.
TEMA (Triple Exponential Moving Average): Reduces lag and smooths price data for trend identification.
DEMA (Double Exponential Moving Average): Similar to TEMA, it reduces lag and provides a smoother trend line.
MA (Moving Average): A simple moving average for basic trend analysis.
MFI (Money Flow Index): Measures the flow of money into and out of a security, useful for identifying overbought or oversold conditions.
VWMA (Volume Weighted Moving Average): Incorporates volume data into the moving average calculation.
PSAR (Parabolic SAR): Identifies potential reversals in price movement.
Session Filtering:
London Session: Trade during the London market hours (0800-1700 GMT+1).
New York Session: Trade during the New York market hours (0800-1700 GMT-5).
Tokyo Session: Trade during the Tokyo market hours (0900-1800 GMT+9).
Users can select one or multiple sessions to align trading with specific market hours.
Trade Direction:
Long: Only long trades are permitted.
Short: Only short trades are permitted.
Both: Both long and short trades are permitted, providing flexibility based on market conditions.
ADX Confirmation:
ADX (Average Directional Index): An optional filter to confirm the strength of a trend before entering a trade.
How to Use the Script
Setup:
Add the script to your TradingView chart.
Customize the input parameters according to your trading preferences and strategy requirements.
Indicator Selection:
Choose the primary indicator you wish to use for generating trading signals from the dropdown menu.
Enable or disable the ADX confirmation based on your preference for trend strength analysis.
Session Filtering:
Select the trading sessions you wish to trade in. You can choose one or multiple Sessions based on your trading strategy and market focus.
Trade Direction:
Set your preferred trade direction (Long, Short, or Both) to align with your market outlook and risk tolerance. You can use this feature to gauge the market and understand the possible directions.
Tips for Profitable and Safe Trading:
Recommended Timeframes Combination:
LT: 1m , CT: 5m, HT: 1H
LT: 1-5m , CT: 15m, HT: 4H
LT: 5-15m , CT: 4H, HT: 1W
Backtesting:
Always backtest the strategy on historical data to understand its performance under various market conditions.
Adjust the parameters based on backtesting results to optimize the strategy for your specific trading style.
Risk Management:
Use appropriate risk management techniques, such as setting stop-loss and take-profit levels, to protect your capital.
Avoid over-leveraging and ensure that you are trading within your risk tolerance.
Market Analysis:
Combine the script with other forms of market analysis, such as fundamental analysis or market sentiment, to make well-rounded trading decisions.
Stay informed about major economic events and news that could impact market volatility and trading sessions.
Continuous Monitoring:
Regularly monitor the strategy's performance and make adjustments as necessary.
Keep an eye on the results and settings for real-time statistics and ensure that the strategy aligns with current market conditions.
Education and Practice:
Continuously educate yourself on trading strategies and market dynamics.
Practice using the strategy in a demo account before applying it to live trading to gain confidence and understanding.

Anomalous Holonomy Field Theory🌌 Anomalous Holonomy Field Theory (AHFT) - Revolutionary Quantum Market Analysis
Where Theoretical Physics Meets Trading Reality
A Groundbreaking Synthesis of Differential Geometry, Quantum Field Theory, and Market Dynamics
🔬 THEORETICAL FOUNDATION - THE MATHEMATICS OF MARKET REALITY
The Anomalous Holonomy Field Theory represents an unprecedented fusion of advanced mathematical physics with practical market analysis. This isn't merely another indicator repackaging old concepts - it's a fundamentally new lens through which to view and understand market structure .
1. HOLONOMY GROUPS (Differential Geometry)
In differential geometry, holonomy measures how vectors change when parallel transported around closed loops in curved space. Applied to markets:
Mathematical Formula:
H = P exp(∮_C A_μ dx^μ)
Where:
P = Path ordering operator
A_μ = Market connection (price-volume gauge field)
C = Closed price path
Market Implementation:
The holonomy calculation measures how price "remembers" its journey through market space. When price returns to a previous level, the holonomy captures what has changed in the market's internal geometry. This reveals:
Hidden curvature in the market manifold
Topological obstructions to arbitrage
Geometric phase accumulated during price cycles
2. ANOMALY DETECTION (Quantum Field Theory)
Drawing from the Adler-Bell-Jackiw anomaly in quantum field theory:
Mathematical Formula:
∂_μ j^μ = (e²/16π²)F_μν F̃^μν
Where:
j^μ = Market current (order flow)
F_μν = Field strength tensor (volatility structure)
F̃^μν = Dual field strength
Market Application:
Anomalies represent symmetry breaking in market structure - moments when normal patterns fail and extraordinary opportunities arise. The system detects:
Spontaneous symmetry breaking (trend reversals)
Vacuum fluctuations (volatility clusters)
Non-perturbative effects (market crashes/melt-ups)
3. GAUGE THEORY (Theoretical Physics)
Markets exhibit gauge invariance - the fundamental physics remains unchanged under certain transformations:
Mathematical Formula:
A'_μ = A_μ + ∂_μΛ
This ensures our signals are gauge-invariant observables , immune to arbitrary market "coordinate changes" like gaps or reference point shifts.
4. TOPOLOGICAL DATA ANALYSIS
Using persistent homology and Morse theory:
Mathematical Formula:
β_k = dim(H_k(X))
Where β_k are the Betti numbers describing topological features that persist across scales.
🎯 REVOLUTIONARY SIGNAL CONFIGURATION
Signal Sensitivity (0.5-12.0, default 2.5)
Controls the responsiveness of holonomy field calculations to market conditions. This parameter directly affects the threshold for detecting quantum phase transitions in price action.
Optimization by Timeframe:
Scalping (1-5min): 1.5-3.0 for rapid signal generation
Day Trading (15min-1H): 2.5-5.0 for balanced sensitivity
Swing Trading (4H-1D): 5.0-8.0 for high-quality signals only
Score Amplifier (10-200, default 50)
Scales the raw holonomy field strength to produce meaningful signal values. Higher values amplify weak signals in low-volatility environments.
Signal Confirmation Toggle
When enabled, enforces additional technical filters (EMA and RSI alignment) to reduce false positives. Essential for conservative strategies.
Minimum Bars Between Signals (1-20, default 5)
Prevents overtrading by enforcing quantum decoherence time between signals. Higher values reduce whipsaws in choppy markets.
👑 ELITE EXECUTION SYSTEM
Execution Modes:
Conservative Mode:
Stricter signal criteria
Higher quality thresholds
Ideal for stable market conditions
Adaptive Mode:
Self-adjusting parameters
Balances signal frequency with quality
Recommended for most traders
Aggressive Mode:
Maximum signal sensitivity
Captures rapid market moves
Best for experienced traders in volatile conditions
Dynamic Position Sizing:
When enabled, the system scales position size based on:
Holonomy field strength
Current volatility regime
Recent performance metrics
Advanced Exit Management:
Implements trailing stops based on ATR and signal strength, with mode-specific multipliers for optimal profit capture.
🧠 ADAPTIVE INTELLIGENCE ENGINE
Self-Learning System:
The strategy analyzes recent trade outcomes and adjusts:
Risk multipliers based on win/loss ratios
Signal weights according to performance
Market regime detection for environmental adaptation
Learning Speed (0.05-0.3):
Controls adaptation rate. Higher values = faster learning but potentially unstable. Lower values = stable but slower adaptation.
Performance Window (20-100 trades):
Number of recent trades analyzed for adaptation. Longer windows provide stability, shorter windows increase responsiveness.
🎨 REVOLUTIONARY VISUAL SYSTEM
1. Holonomy Field Visualization
What it shows: Multi-layer quantum field bands representing market resonance zones
How to interpret:
Blue/Purple bands = Primary holonomy field (strongest resonance)
Band width = Field strength and volatility
Price within bands = Normal quantum state
Price breaking bands = Quantum phase transition
Trading application: Trade reversals at band extremes, breakouts on band violations with strong signals.
2. Quantum Portals
What they show: Entry signals with recursive depth patterns indicating momentum strength
How to interpret:
Upward triangles with portals = Long entry signals
Downward triangles with portals = Short entry signals
Portal depth = Signal strength and expected momentum
Color intensity = Probability of success
Trading application: Enter on portal appearance, with size proportional to portal depth.
3. Field Resonance Bands
What they show: Fibonacci-based harmonic price zones where quantum resonance occurs
How to interpret:
Dotted circles = Minor resonance levels
Solid circles = Major resonance levels
Color coding = Resonance strength
Trading application: Use as dynamic support/resistance, expect reactions at resonance zones.
4. Anomaly Detection Grid
What it shows: Fractal-based support/resistance with anomaly strength calculations
How to interpret:
Triple-layer lines = Major fractal levels with high anomaly probability
Labels show: Period (H8-H55), Price, and Anomaly strength (φ)
⚡ symbol = Extreme anomaly detected
● symbol = Strong anomaly
○ symbol = Normal conditions
Trading application: Expect major moves when price approaches high anomaly levels. Use for precise entry/exit timing.
5. Phase Space Flow
What it shows: Background heatmap revealing market topology and energy
How to interpret:
Dark background = Low market energy, range-bound
Purple glow = Building energy, trend developing
Bright intensity = High energy, strong directional move
Trading application: Trade aggressively in bright phases, reduce activity in dark phases.
📊 PROFESSIONAL DASHBOARD METRICS
Holonomy Field Strength (-100 to +100)
What it measures: The Wilson loop integral around price paths
>70: Strong positive curvature (bullish vortex)
<-70: Strong negative curvature (bearish collapse)
Near 0: Flat connection (range-bound)
Anomaly Level (0-100%)
What it measures: Quantum vacuum expectation deviation
>70%: Major anomaly (phase transition imminent)
30-70%: Moderate anomaly (elevated volatility)
<30%: Normal quantum fluctuations
Quantum State (-1, 0, +1)
What it measures: Market wave function collapse
+1: Bullish eigenstate |↑⟩
0: Superposition (uncertain)
-1: Bearish eigenstate |↓⟩
Signal Quality Ratings
LEGENDARY: All quantum fields aligned, maximum probability
EXCEPTIONAL: Strong holonomy with anomaly confirmation
STRONG: Good field strength, moderate anomaly
MODERATE: Decent signals, some uncertainty
WEAK: Minimal edge, high quantum noise
Performance Metrics
Win Rate: Rolling performance with emoji indicators
Daily P&L: Real-time profit tracking
Adaptive Risk: Current risk multiplier status
Market Regime: Bull/Bear classification
🏆 WHY THIS CHANGES EVERYTHING
Traditional technical analysis operates on 100-year-old principles - moving averages, support/resistance, and pattern recognition. These work because many traders use them, creating self-fulfilling prophecies.
AHFT transcends this limitation by analyzing markets through the lens of fundamental physics:
Markets have geometry - The holonomy calculations reveal this hidden structure
Price has memory - The geometric phase captures path-dependent effects
Anomalies are predictable - Quantum field theory identifies symmetry breaking
Everything is connected - Gauge theory unifies disparate market phenomena
This isn't just a new indicator - it's a new way of thinking about markets . Just as Einstein's relativity revolutionized physics beyond Newton's mechanics, AHFT revolutionizes technical analysis beyond traditional methods.
🔧 OPTIMAL SETTINGS FOR MNQ 10-MINUTE
For the Micro E-mini Nasdaq-100 on 10-minute timeframe:
Signal Sensitivity: 2.5-3.5
Score Amplifier: 50-70
Execution Mode: Adaptive
Min Bars Between: 3-5
Theme: Quantum Nebula or Dark Matter
💭 THE JOURNEY - FROM IMPOSSIBLE THEORY TO TRADING REALITY
Creating AHFT was a mathematical odyssey that pushed the boundaries of what's possible in Pine Script. The journey began with a seemingly impossible question: Could the profound mathematical structures of theoretical physics be translated into practical trading tools?
The Theoretical Challenge:
Months were spent diving deep into differential geometry textbooks, studying the works of Chern, Simons, and Witten. The mathematics of holonomy groups and gauge theory had never been applied to financial markets. Translating abstract mathematical concepts like parallel transport and fiber bundles into discrete price calculations required novel approaches and countless failed attempts.
The Computational Nightmare:
Pine Script wasn't designed for quantum field theory calculations. Implementing the Wilson loop integral, managing complex array structures for anomaly detection, and maintaining computational efficiency while calculating geometric phases pushed the language to its limits. There were moments when the entire project seemed impossible - the script would timeout, produce nonsensical results, or simply refuse to compile.
The Breakthrough Moments:
After countless sleepless nights and thousands of lines of code, breakthrough came through elegant simplifications. The realization that market anomalies follow patterns similar to quantum vacuum fluctuations led to the revolutionary anomaly detection system. The discovery that price paths exhibit holonomic memory unlocked the geometric phase calculations.
The Visual Revolution:
Creating visualizations that could represent 4-dimensional quantum fields on a 2D chart required innovative approaches. The multi-layer holonomy field, recursive quantum portals, and phase space flow representations went through dozens of iterations before achieving the perfect balance of beauty and functionality.
The Balancing Act:
Perhaps the greatest challenge was maintaining mathematical rigor while ensuring practical trading utility. Every formula had to be both theoretically sound and computationally efficient. Every visual had to be both aesthetically pleasing and information-rich.
The result is more than a strategy - it's a synthesis of pure mathematics and market reality that reveals the hidden order within apparent chaos.
📚 INTEGRATED DOCUMENTATION
Once applied to your chart, AHFT includes comprehensive tooltips on every input parameter. The source code contains detailed explanations of the mathematical theory, practical applications, and optimization guidelines. This published description provides the overview - the indicator itself is a complete educational resource.
⚠️ RISK DISCLAIMER
While AHFT employs advanced mathematical models derived from theoretical physics, markets remain inherently unpredictable. No mathematical model, regardless of sophistication, can guarantee future results. This strategy uses realistic commission ($0.62 per contract) and slippage (1 tick) in all calculations. Past performance does not guarantee future results. Always use appropriate risk management and never risk more than you can afford to lose.
🌟 CONCLUSION
The Anomalous Holonomy Field Theory represents a quantum leap in technical analysis - literally. By applying the profound insights of differential geometry, quantum field theory, and gauge theory to market analysis, AHFT reveals structure and opportunities invisible to traditional methods.
From the holonomy calculations that capture market memory to the anomaly detection that identifies phase transitions, from the adaptive intelligence that learns and evolves to the stunning visualizations that make the invisible visible, every component works in mathematical harmony.
This is more than a trading strategy. It's a new lens through which to view market reality.
Trade with the precision of physics. Trade with the power of mathematics. Trade with AHFT.
I hope this serves as a good replacement for Quantum Edge Pro - Adaptive AI until I'm able to fix it.
— Dskyz, Trade with insight. Trade with anticipation.

Donchian x WMA Crossover (2025 Only, Adjustable TP, Real OHLC)Short Description:
Long-only breakout system that goes long when the Donchian Low crosses up through a Weighted Moving Average, and closes when it crosses back down (with an optional take-profit), restricted to calendar year 2025. All signals use the instrument’s true OHLC data (even on Heikin-Ashi charts), start with 1 000 AUD of capital, and deploy 100 % equity per trade.
Ideal parameters configured for Temple & Webster on ASX 30 minute candles. Adjust parameter to suit however best to download candle interval data and have GPT test the pine script for optimum parameters for your trading symbol.
Detailed Description
1. Strategy Concept
This strategy captures trend-driven breakouts off the bottom of a Donchian channel. By combining the Donchian Low with a WMA filter, it aims to:
Enter when volatility compresses and price breaks above the recent Donchian Low while the longer‐term WMA confirms upward momentum.
Exit when price falls back below that same WMA (i.e. when the Donchian Low crosses back down through WMA), but only if the WMA itself has stopped rising.
Optional Take-Profit: you can specify a profit target in decimal form (e.g. 0.01 = 1 %).
2. Timeframe & Universe
In-sample period: only bars stamped between Jan 1 2025 00:00 UTC and Dec 31 2025 23:59 UTC are considered.
Any resolution (e.g. 30 m, 1 h, D, etc.) is supported—just set your preferred timeframe in the TradingView UI.
3. True-Price Execution
All indicator calculations (Donchian Low, WMA, crossover checks, take-profit) are sourced from the chart’s underlying OHLC via request.security(). This guarantees that:
You can view Heikin-Ashi or other styled candles, but your strategy will execute on the real OHLC bars.
Chart styling never suppresses or distorts your backtest results.
4. Position Sizing & Equity
Initial capital: 1 000 AUD
Size per trade: 100 % of available equity
No pyramiding: one open position at a time
5. Inputs (all exposed in the “Inputs” tab):
Input Default Description
Donchian Length 7 Number of bars to calculate the Donchian channel low
WMA Length 62 Period of the Weighted Moving Average filter
Take Profit (decimal) 0.01 Exit when price ≥ entry × (1 + take_profit_perc)
6. How It Works
Donchian Low: ta.lowest(low, DonchianLength) over the specified look-back.
WMA: ta.wma(close, WMALength) applied to true closes.
Entry: ta.crossover(DonchianLow, WMA) AND barTime ∈ 2025.
Exit:
Cross-down exit: ta.crossunder(DonchianLow, WMA) and WMA is not rising (i.e. momentum has stalled).
Take-profit exit: price ≥ entry × (1 + take_profit_perc).
Calendar exit: barTime falls outside 2025.
7. Usage Notes
After adding to your chart, open the Strategy Tester tab to review performance metrics, list of trades, equity curve, etc.
You can toggle your chart to Heikin-Ashi for visual clarity without affecting execution, thanks to the real-OHLC calls.

Kaufman Trend Strategy# ✅ Kaufman Trend Strategy – Full Description (Script Publishing Version)
**Kaufman Trend Strategy** is a dynamic trend-following strategy based on Kaufman Filter theory.
It detects real-time trend momentum, reduces noise, and aims to enhance entry accuracy while optimizing risk.
⚠️ _For educational and research purposes only. Past performance does not guarantee future results._
---
## 🎯 Strategy Objective
- Smooth price noise using Kaufman Filter smoothing
- Detect the strength and direction of trends with a normalized oscillator
- Manage profits using multi-stage take-profits and adaptive ATR stop-loss logic
---
## ✨ Key Features
- **Kaufman Filter Trend Detection**
Extracts directional signal using a state space model.
- **Multi-Stage Profit-Taking**
Automatically takes partial profits based on color changes and zero-cross events.
- **ATR-Based Volatility Stops**
Stops adjust based on swing highs/lows and current market volatility.
---
## 📊 Entry & Exit Logic
**Long Entry**
- `trend_strength ≥ 60`
- Green trend signal
- Price above the Kaufman average
**Short Entry**
- `trend_strength ≤ -60`
- Red trend signal
- Price below the Kaufman average
**Exit (Long/Short)**
- Blue trend color → TP1 (50%)
- Oscillator crosses 0 → TP2 (25%)
- Trend weakens → Final exit (25%)
- ATR + swing-based stop loss
---
## 💰 Risk Management
- Initial capital: `$3,000`
- Order size: `$100` per trade (realistic, low-risk sizing)
- Commission: `0.002%`
- Slippage: `2 ticks`
- Pyramiding: `1` max position
- Estimated risk/trade: `~0.1–0.5%` of equity
> ⚠️ _No trade risks more than 5% of equity. This strategy follows TradingView script publishing rules._
---
## ⚙️ Default Parameters
- **1st Take Profit**: 50%
- **2nd Take Profit**: 25%
- **Final Exit**: 25%
- **ATR Period**: 14
- **Swing Lookback**: 10
- **Entry Threshold**: ±60
- **Exit Threshold**: ±40
---
## 📅 Backtest Summary
- **Symbol**: USD/JPY
- **Timeframe**: 1H
- **Date Range**: Jan 3, 2022 – Jun 4, 2025
- **Trades**: 924
- **Win Rate**: 41.67%
- **Profit Factor**: 1.108
- **Net Profit**: +$1,659.29 (+54.56%)
- **Max Drawdown**: -$1,419.73 (-31.87%)
---
## ✅ Summary
This strategy uses Kaufman filtering to detect market direction with reduced lag and increased smoothness.
It’s built with visual clarity and strong trade management, making it practical for both beginners and advanced users.
---
## 📌 Disclaimer
This script is for educational and informational purposes only and should not be considered financial advice.
Use with proper risk controls and always test in a demo environment before live trading.

Supply/Demand Zones + Engulfment-based ExecutionSupply/Demand Zones + Engulfment-Based Execution
Strategy Overview
This strategy combines institutional trading concepts—supply/demand zones and engulfing candle patterns—to generate high-probability long and short trade setups. The system uses aggregated price action to identify potential reversal zones and confirms entries with engulfing candle patterns, ensuring trades are only taken when market structure shows commitment in the direction of the trade.
Core Concepts
• Supply & Demand Zones: These are automatically detected by analyzing aggregated bullish and bearish candle structures over user-defined intervals. Supply zones are formed after bearish continuation patterns; demand zones appear after bullish continuation patterns.
• Engulfing Entries: Once price enters a zone, the strategy waits for a bullish engulfing pattern (in a demand zone) or a bearish engulfing pattern (in a supply zone) before executing a trade. This adds confirmation and reduces false signals.
• Risk Management: Stop-loss is placed at the low (for long trades) or high (for short trades) of the engulfed candle. Take-profit can be calculated using a fixed R-multiple (risk-to-reward ratio) or a user-defined target price.
Key Features
Fully customizable aggregation factor for zone detection
Visual zone boxes, entry/SL/TP boxes, and engulfing pattern labels
Optional removal of mitigated zones for cleaner charting
Configurable trade mode (Long only, Short only, or Both)
Support for trading sessions and date filtering
Alerts for price entering supply or demand zones
How to Use
Select Aggregation Factor: Choose how many candles to group together for identifying key zones (e.g., 4x timeframe).
Enable Zones: Turn on supply and/or demand zones as needed.
Set Execution Parameters:
– Choose R-multiple (e.g., 2:1 risk-reward)
– Or use a fixed take-profit price
Define Trade Time Window:
– Set the date and time ranges to restrict execution
– Use Start Hour and End Hour to limit trades to specific sessions (e.g., London/New York)
Run on Desired Timeframe: Typically used on 15m–4H charts, depending on your strategy and the asset’s volatility.
Ideal For
• Traders using Smart Money Concepts (SMC)
• Those who value high-confluence entries
• Intraday to swing traders looking for structure-based automation
⚠️ Important Notes
• The strategy requires engulfing confirmation within the zone to enter a position.
• This script does not repaint and executes trades on a bar close basis.
• Backtest results may vary based on session filters and aggregation factor.
© Attribution
This strategy was developed by The_Forex_Steward and is licensed under the Mozilla Public License 2.0.
You are free to use, modify, and distribute it under the terms of that license.

Grid TLong V1The “Grid TLong V1” strategy is based on the classic Grid strategy, but in the mode of buying and selling in favor of the trend and only on Long. This allows to take advantage of large uptrend movements to maximize profits in bull markets. For this reason, excessively sideways or bearish markets may not be very conducive to this strategy.
Like our Grid strategies in favor of the trend, you can enter and exit with the balance with controlled risk, as the distance between each grid functions as a natural and adaptable stop loss and take profit. What differentiates it from bidirectional strategies is that Short uses a minimum amount of follow-through, so that the percentage distance between the grids is maintained.
In this version of the script the entries and exits can be chosen at market or limit , and are based on the profit or loss of the current position, not on the percentage change in price.
The user may also notice that the strategy setup is risk-controlled, because it risks 5% on each trade, has a fairly standard commission and modest initial capital, all in order to protect the strategy user from unrealistic results.
As with all strategies, it is strongly recommended to optimize the parameters for the strategy to be effective for each asset and for each time frame.

Volatility Bias ModelVolatility Bias Model
Overview
Volatility Bias Model is a purely mathematical, non-indicator-based trading system that detects directional probability shifts during high volatility market phases. Rather than relying on classic tools like RSI or moving averages, this strategy uses raw price behavior and clustering logic to determine potential breakout direction based on recent market bias.
How It Works
Over a defined lookback window (default 10 bars), the strategy counts how many candles closed in the same direction (i.e., bullish or bearish).
Simultaneously, it calculates the price range during that window.
If volatility is above a minimum threshold and a clear directional bias is detected (e.g., >60% of closes are bullish), a trade is opened in the direction of that bias.
This approach assumes that when high volatility is coupled with directional closing consistency, the market is probabilistically more likely to continue in that direction.
ATR-based stop-loss and take-profit levels are applied, and trades auto-exit after 20 bars if targets are not hit.
Key Features
- 100% non-indicator-based logic
- Statistically-driven directional bias detection
- Works across all timeframes (1H, 4H, 1D)
- ATR-based risk management
- No pyramiding, slippage and commissions included
- Compatible with real-world backtesting conditions
Realism & Assumptions
To make this strategy more aligned with actual trading environments, it includes 0.05% commission per trade and a 1-point slippage on every entry and exit.
Additionally, position sizing is set at 10% of a $10,000 starting capital, and no pyramiding is allowed.
These assumptions help avoid unrealistic backtest results and make the performance metrics more representative of live conditions.
Parameter Explanation
Bias Window (10 bars): Number of past candles used to evaluate directional closings
Bias Threshold (0.60): Required ratio of same-direction candles to consider a bias valid
Minimum Range (1.5%): Ensures the market is volatile enough to avoid noise
ATR Length (14): Used to dynamically define stop-loss and target zones
Risk-Reward Ratio (2.0): Take-profit is set at twice the stop-loss distance
Max Holding Bars (20): Trades are closed automatically after 20 bars to prevent stagnation
Originality Note
Unlike common strategies based on oscillators or moving averages, this script is built on pure statistical inference. It models the market as a probabilistic process and identifies directional intent based on historical closing behavior, filtered by volatility. This makes it a non-linear, adaptive model grounded in real-world price structure — not traditional technical indicators.
Disclaimer
This strategy is for educational and experimental purposes only. It does not constitute financial advice. Always perform your own analysis and test thoroughly before applying with real capital.
Algoway V4.2📌 Algoway V4.2 — Multi-layered Strategy Powered by ADX, MACD & PSO
Overview
Algoway V4.2 is a layered algorithmic strategy designed for volatility-rich assets like cryptocurrencies. While some core components (such as PSO, MACD, and ADX oscillators) are adapted from known indicator models, the original logic, state tracking, and Candle Strength Oscillator (CSO) are fully custom-developed.
This strategy is not a simple combination of tools — it implements a conditional entry-exit logic system based on ADX zone transitions, momentum structure, and MACD/PSO signal synchronization, enhanced by custom-built CSO filtering.
🧠 Key Modules and How They Work Together
PSO (Premium Stochastic Oscillator)
Used to confirm local oversold/overbought pressure. Acts as a directional filter.
MACD (Normalized)
Volatility-normalized MACD values allow consistent signal detection even on volatile pairs. It triggers entries when momentum begins shifting.
ADX Zonal Logic
Divides the market into Range / MidRange / Trend Peak zones. Entries are allowed only under specific transitions — e.g., long entries only in yellow (low volatility) zones or in trend climax zones under certain pullbacks.
CSO (Candle Strength Oscillator) — Custom Module
Designed to measure real candle momentum and price structure consistency. It avoids false breakouts and filters trend fatigue.
🔁 How Logic Works
Strategy maintains state variables to track entry type and zone.
Exit conditions depend on the entry origin: entries from "Range" exit in "Peak", while "Peak" entries exit during pullbacks or mid-strength trend reversals.
Additional logic prevents entries when signals are not aligned across modules, minimizing noise.
Optional CSO module acts as a final microstructure confirmation before executing MACD-based midpoint entries.
📊 Example Parameters (for 5M crypto scalping)
Each module is tuned to respond to 5-minute crypto volatility:
Stochastic: fast response, tight thresholds
MACD: shortened EMAs, normalized
ADX: traditional smoothing, custom thresholds for zone switching
CSO: candle-based dynamic filter with visual zone mapping
🧪 Conclusion
Algoway V4.2 is not a script merger — it is a custom logic engine using familiar technical components but governed by a proprietary decision model, with additional filters and dynamic variable tracking.
It’s suitable for scalping or swing setups, and the internal logic is optimized for real trading conditions, not just visual backtests.

Antony.N4A -NQ ORB Quartile Str v6.3Antony.N4A – NQ ORB Quartile Strategy v6.3
A precision-engineered intraday breakout system built for the Nasdaq futures market, combining the Opening Range Breakout (ORB) logic with dynamic standard deviation targets, structural filters, and multi-layer risk management.
🧠 Key Features
Opening Range Breakout (ORB):
Automatically defines a breakout window (default: 09:30–09:45) and triggers entries when price breaks the high or low of that range.
Standard Deviation Profit Targets:
Supports SD0.5, SD1.0, SD1.5, and SD2.0 targets relative to the ORB range.
EMA Filtering (200-period):
Filters trades based on EMA direction and price position to validate breakout direction and avoid false entries.
Range Filtering:
Detects directional bias and volatility trends using smoothed range logic.
Momentum Triggering:
Validates breakout momentum and allows entries when directional momentum is positive and increasing.
⚙️ User Inputs
ORB Settings: Timeframe, session, and timezone customization
Entry Window: Define when trades are allowed to trigger
Day Filters: Enable/disable trading by weekday
SD Targets: Configure exit % and active levels (SD0.5 – SD2.0)
EMA Filter & Sensitivity
Cross Filter (Anti-chop logic)
Range Filter Parameters
Visual Toggles: ORB range, SD levels, EMA clouds
🎯 Trade Management Rules
Entry:
Triggered at the close of a 5-minute candle confirming a breakout of the ORB range.
Stop Loss:
Defined by structural invalidation (quartile boundaries & mid-range buffers).
Take Profit Strategy:
75% closed at SD1.0 level
Remaining 25% trailed to further SD2 target
SL is moved to breakeven after partial exit
Execution Controls:
No pyramiding
No re-entries (cooldown enforced)
🔧 Trading Modes
✅ Safe Mode
EMA Filter: Enabled
EMA Sensitivity: 19
Range Filter: Disabled
Ideal for conservative setups and reduced noise environments
🔥 Aggressive Mode
EMA Filter: Enabled
EMA Sensitivity: 5
Range Filter: Disabled
Suited for high-frequency setups and faster breakouts
📊 Backtest Performance (7-Month Sample)
Safe Mode:
Win Rate: 66%
Total Trades: 29
Net PnL: +21.79R (~$4,357 with R = $200)
Max Red Days: 3
Max Drawdown: -$663
Best Month: +9R, Worst Month: -2R
Aggressive Mode:
Win Rate: 63%
Total Trades: 52
Net PnL: +30R (~$6,080)
Max Red Days: 6
Max Drawdown: -$1,357
Best Month: +12R, Worst Month: -3.2R
👨💻 Developed by Antony.N4A
This tool is crafted for strategic intraday traders, system developers, and backtesters.
For access, customization, or licensing options, contact the developer directly.
Protected script. Redistribution or reuse without permission is prohibited.
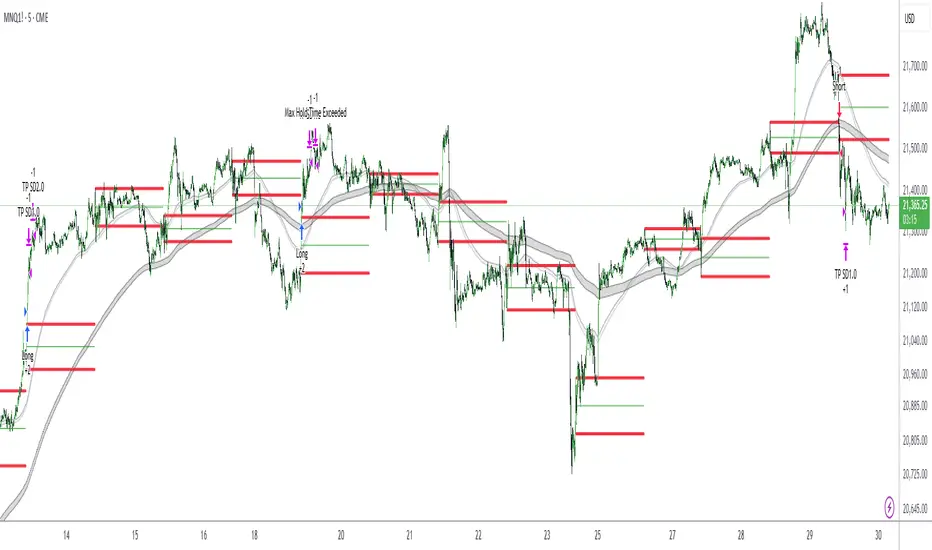
Price Statistical Strategy-Z Score V 1.01
Price Statistical Strategy – Z Score V 1.01
Overview
A technical breakdown of the logic and components of the “Price Statistical Strategy – Z Score V 1.01”.
This script implements a smoothed Z-Score crossover mechanism applied to the closing price to detect potential statistical deviations from local price mean. The strategy operates solely on price data (close) and includes signal spacing control and momentum-based candle filters. No volume-based or trend-detection components are included.
Core Methodology
The strategy is built on the statistical concept of Z-Score, which quantifies how far a value (closing price) is from its recent average, normalized by standard deviation. Two moving averages of the raw Z-Score are calculated: a short-term and a long-term smoothed version. The crossover between them generates long entries and exits.
Signal Conditions
Entry Condition:
A long position is opened when the short-term smoothed Z-Score crosses above the long-term smoothed Z-Score, and additional entry conditions are met.
Exit Condition:
The position is closed when the short-term Z-Score crosses below the long-term Z-Score, provided the exit conditions allow.
Signal Gapping:
A minimum number of bars (Bars gap between identical signals) must pass between repeated entry or exit signals to reduce noise.
Momentum Filter:
Entries are prevented during sequences of three or more consecutively bullish candles, and exits are prevented during three or more consecutively bearish candles.
Z-Score Function
The Z-Score is calculated as:
Z = (Close - SMA(Close, N)) / STDEV(Close, N)
Where N is the base period selected by the user.
Input Parameters
Enable Smoothed Z-Score Strategy
Enables or disables the Z-Score strategy logic. When disabled, no trades are executed.
Z-Score Base Period
Defines the number of bars used to calculate the simple moving average and standard deviation for the Z-Score. This value affects how responsive the raw Z-Score is to price changes.
Short-Term Smoothing
Sets the smoothing window for the short-term Z-Score. Higher values produce smoother short-term signals, reducing sensitivity to short-term volatility.
Long-Term Smoothing
Sets the smoothing window for the long-term Z-Score, which acts as the reference line in the crossover logic.
Bars gap between identical signals
Minimum number of bars that must pass before another signal of the same type (entry or exit) is allowed. This helps reduce redundant or overly frequent signals.
Trade Visualization Table
A table positioned at the bottom-right displays live PnL for open trades:
Entry Price
Unrealized PnL %
Text colors adapt based on whether unrealized profit is positive, negative, or neutral.
Technical Notes
This strategy uses only close prices — no trend indicators or volume components are applied.
All calculations are based on simple moving averages and standard deviation over user-defined windows.
Designed as a minimal, isolated Z-Score engine without confirmation filters or multi-factor triggers.

Multi-Indicator Trend-Following Strategy v6Multi-Indicator Trend-Following Strategy v6
This strategy uses a combination of technical indicators to identify potential trend-following trade entries and exits. It is intended for educational and research purposes.
How it works:
Moving Averages (EMA): Entry signals are generated on crossovers between a fast and slow exponential moving average.
RSI Filter: Confirms momentum with a threshold above/below 50 for long/short entries.
Volume Confirmation: Requires volume to exceed a moving average multiplied by a user-defined factor.
ATR-Based Risk Management: Stop loss and take profit levels are calculated using the Average True Range (ATR), allowing for dynamic risk control based on market volatility.
Customizable Inputs:
Fast/Slow MA lengths
RSI length and levels
MACD settings (used in calculation, not directly in signal)
Volume MA and multiplier
ATR period and multipliers for stop loss and take profit
Notes:
This strategy does not guarantee future results.
It is provided for analysis and backtesting only.
Alerts are available for buy/sell conditions.
Feel free to adjust parameters to explore different market conditions and asset classes.

Long Explosive V1The “Long Explosive V1” strategy calculates the percentage change in price from the last closing price of the candlestick, so that if it increases by a certain percentage it goes long, but if it decreases by another percentage it sends an exit order, so that the percentage limits above and below the current price function as inherent stop loss and take profit, with the benefit of taking advantage of the volatility of the bull market.
Entries and exits are always at the market and based on percentage changes in the price. Of course, the default configuration of the strategy considers a position with a 5% risk control, modest initial capital and standard commissions, which helps to obtain realistic results and protect the user from unexpectedly controlled potential losses.
It is again emphasized that it is always advisable to adjust the parameters of the strategy well, so that the risk-reward is well controlled.
