Trading strategy Jesse LivermoreLong only trading strategies based on Jesse Livermore's trading philosophy
Trend Analizi

ADX GatekeeperADX Gatekeeper is an original strategy that combines three classic filters to improve trend-following accuracy and avoid choppy markets.
Combines RSI, OBV, and ADX filters to catch stronger trends and avoid sideways markets. RSI confirms momentum extremes, OBV confirms volume flow, and ADX filters low-trend conditions. Fully configurable for different market conditions.
RSI Filter: Avoids overbought/oversold traps by requiring RSI < 35 for longs and > 70 for shorts.
OBV Filter: Confirms directional volume with positive OBV changes for longs and negative for shorts.
ADX Filter: Filters out low-volatility sideways conditions by requiring ADX above a configurable threshold (default 45).
The combined conditions aim to identify stronger trend moves while avoiding choppy markets. All filters can be toggled on or off for flexibility.
Default risk: 10% of equity per trade. Users can adjust this.
Ideal for trend traders looking to filter noise and improve entry quality.

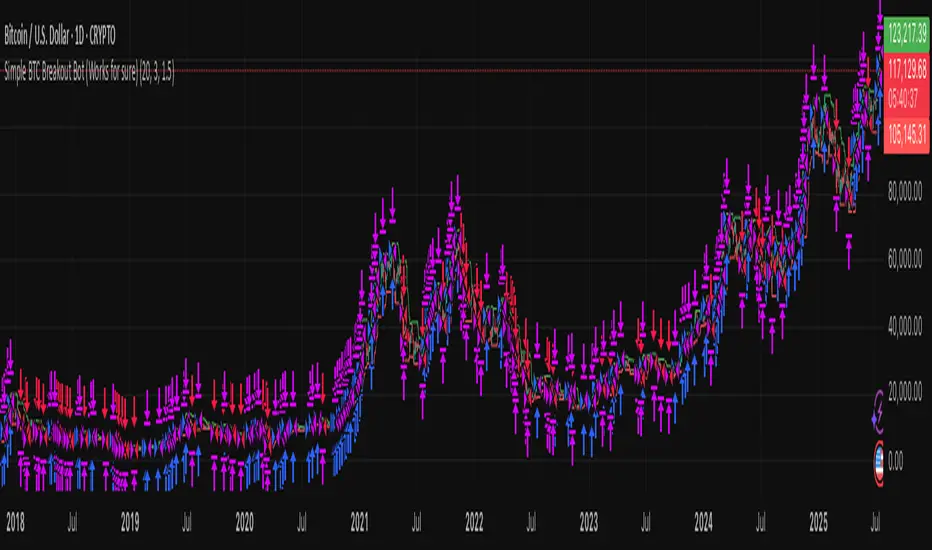
Simple BTC Breakout Bot (Works for sure)🚀 Simple BTC Breakout Bot (Works for sure)
This strategy is designed for BTC/USDT breakout trading using recent highs and lows. It automatically detects breakout signals and manages trades with Take Profit and Stop Loss to help manage risk and lock in profits.
Key Features:
🔍 Breakout Detection:
Enters a long position when price crosses above the highest high of the last N candles (default 20).
Enters a short position when price crosses below the lowest low of the last N candles.
💰 Risk Management:
Automatically sets a Take Profit (default 3%) and Stop Loss (default 1.5%) for every trade.
📊 Visuals:
Plots breakout levels (highest high in green, lowest low in red) on the chart.
🔔 Alerts:
Sends alerts on every breakout trade for long and short entries, compatible with TradingView’s alert system.
Parameters:
⏳ Breakout Lookback Period: Number of candles to check for breakouts (default: 20)
🎯 Take Profit (%): Profit target as a percentage from entry price (default: 3%)
🚫 Stop Loss (%): Maximum loss allowed as a percentage from entry price (default: 1.5%)
⚠️ Disclaimer:
This strategy is based on historical data and does not guarantee future profits. Always backtest and trade with proper risk management.
MA Crossover Strategy with TP/SL📊 MA Crossover Strategy with TP/SL
This strategy uses two simple moving averages (SMAs) to catch trend changes and trade breakouts with clear risk management.
🔥 How it works:
Enters a Long position when the fast SMA (short period) crosses above the slow SMA (long period), signaling an upward trend.
Enters a Short position when the fast SMA crosses below the slow SMA, signaling a downward trend.
🎯 Features:
Take Profit (TP): Automatically closes the trade at a defined percentage profit.
Stop Loss (SL): Limits potential losses with a predefined stop level.
Customizable parameters: Adjust the lengths of the moving averages, TP%, and SL% to fit your style.
Alerts: Receive notifications on every trade entry for timely action.
⚡️ Designed for traders looking for a simple, effective trend-following system with built-in risk control.

ETH-BCH Strategy 4hr(Powered by BCH)ETH-BCH Strategy 4hr-chart (Powered by BCH)
This strategy optimized for ETHUSDT 4hr chart.
(But very good for 2hr chart also)
Incredible profit
But High risk High return
High MDD
Unlock a new perspective on crypto trading with our innovative ETH-BCH Strategy, now specially optimized for the ETHUSDT 2-hour chart. Available exclusively on TradingView for a limited time, this strategy leverages the unique interplay between Bitcoin Cash (BCH), Ethereum (ETH), and Bitcoin (BTC) to identify high-probability trading opportunities—without relying on conventional single-asset signals.
Key Highlights:
Multi-Asset Analysis: Dynamically compares price movements and momentum between BCH, ETH, and BTC, seeking to capture relative strength and weakness across major cryptocurrencies.
Advanced Technical Filters: Incorporates a blend of classic and proprietary indicators, including:
Bollinger Bands for volatility-based entry and exit zones
Volume surges to confirm genuine market interest
Momentum oscillators for trend validation and overbought/oversold detection
Smart Entry & Exit Logic: Buy and sell conditions are designed to avoid noise and false signals, focusing on periods of significant divergence and market inflection points.
Risk Management Built-In: Includes timing filters to prevent overtrading and optimize entry and exit timing.
Visual Insights: Key indicator levels and signals are clearly plotted for intuitive chart-based decision-making.
The full algorithmic logic remains proprietary, ensuring a competitive edge for early adopters. Experience the performance and transparency of the strategy in action—without revealing the core code.
Try it now and see how cross-asset crypto analytics—tailored for the ETHUSDT 2-hour timeframe—can elevate your trading decisions.
Available as a protected script—contact us for access or more information.
Note: This strategy is for educational and informational purposes only. Past performance does not guarantee future results.

High Accuracy Scalping StrategyHigh Accuracy Scalping Strategy
Overview
This strategy is designed for scalping on lower timeframes (e.g., 1-5 minutes) in volatile markets like forex, crypto, or indices. It generates buy and sell signals based on a combination of momentum, volatility, and overbought/oversold conditions to identify high-probability entry points for quick trades. The strategy incorporates adaptive risk management using ATR-based stop-loss (SL) and take-profit (TP) levels, ensuring exits are dynamically adjusted to market volatility rather than fixed pips or percentages. An optional EMA filter can be enabled to add trend alignment, reducing whipsaws in ranging markets.Why Multi-Indicator Approach?Combining multiple indicators is essential here to create a robust signal generation system that filters out noise and improves accuracy in fast-moving scalping environments. Each indicator serves a complementary role:
RSI (Relative Strength Index) : Measures momentum and identifies oversold (for buys) or overbought (for sells) conditions, helping spot potential reversals.
Stochastic Oscillator : Provides additional momentum confirmation through %K and %D crossovers, focusing on short-term price extremes while being smoothed to avoid erratic signals.
Bollinger Bands : Adds a volatility layer by comparing price to dynamic bands (based on standard deviation), signaling entries when price touches the lower band (potential buy) or upper band (potential sell).
ATR (Average True Range): Used exclusively for exits, it calculates SL and TP based on recent volatility, ensuring risk-reward ratios (customizable via inputs) adapt to the asset's behavior rather than static values.
Optional EMA (Exponential Moving Average): Acts as a trend filter to ensure entries align with the short-term direction (e.g., buys only above EMA), preventing counter-trend trades.
These components work synergistically : RSI and Stochastic provide dual momentum confirmation to validate overbought/oversold states, while Bollinger Bands add volatility context to avoid entries in low-volatility squeezes. The EMA filter (disabled by default for broader signal generation) overlays a trend bias, and ATR ensures exits are practical and volatility-aware. This mashup reduces false positives common in single-indicator strategies (e.g., RSI alone might signal in a strong trend), leading to higher win rates in backtesting on scalping setups. The combination draws from classic technical analysis but is tuned for scalping with shorter default lengths and crossover logic, making it original in its integrated, adaptive design rather than a simple overlay of unrelated tools.
How It Works
Buy Signal : Triggered when RSI is oversold (<30 by default) OR price is at/ below the lower Bollinger Band, AND Stochastic %K crosses over %D while below the oversold level (20). If EMA filter is enabled, price must also be above the EMA.
Sell Signa l: Triggered when RSI is overbought (>70) OR price is at/above the upper Bollinger Band, AND Stochastic %K crosses under %D while above the overbought level (80). If EMA filter is enabled, price must be below the EMA.
Entries : Long on buy, short on sell, using a percentage of equity (default 100%) for position sizing.
Exits : For longs, SL at entry price minus (ATR * SL RR, default 1.0), TP at entry plus (ATR * TP RR, default 2.0). Opposite for shorts. This creates a favorable risk-reward asymmetry.
Visuals : Green triangle below bar for buys, red above for sells. Blue EMA line plotted for reference.
The strategy is backtest-ready with initial capital of $1000 and USD currency, but results vary by asset and timeframe—always forward-test.How to UseAdd to chart and customize inputs: Adjust RSI/Stochastic/BB lengths for your timeframe (shorter for scalping), tweak overbought/oversold levels, or enable EMA filter for trending markets.
Best on liquid assets with volatility (e.g., BTC/USD, EUR/USD). Use on 1-15min charts for scalping.
Monitor signals visually or via alerts. Combine with manual discretion for news events.
Risk management: Start with small position sizes; the ATR-based exits help preserve capital.
This script is original in its tuned parameter defaults, optional filter integration, and focus on scalping synergy, differentiating it from generic multi-indicator scripts by emphasizing adaptive volatility handling and reduced false signals through cross-confirmation.

TradingWeapon#pure price action
#custom candlestick
#custom location
#support resistance
#liquidity
#best strategy
#without using any types of mathematical lagging indicator

tradingweapon#PurePriceAction
#TradeWithoutIndicator
Custom Candlestick Pattern
Buy and Sell On Custom Location
Best Semi Automatic Strategy

Ekoparaloji&Strategy1000 USDT
BNB Smart Chain (BEP20) usdt: 0x0abd7ec93ebf0d325f7d731ba2a128e12bf010d3
Contact ekoparaloji@gmail.com
Opens new long trades during gradual declines in volatility, uses TP with average price, and makes high-profit, high-risk trades.

DRAGONFLY 2.0 Strategy🐉 DRAGONFLY 2.0 — Strategy Guide
DRAGONFLY 2.0 is a precision-built trading system designed for adaptive trend-based entries, dynamic scaling, and calculated exits. It introduces a unique multi-ladder logic and a reactive take-profit engine, ideal for intraday or swing trading.
🧭 Strategy Concept
Proprietary trigger engine that detects trend shifts using directional logic
Ladder entry system that adds size during structured pullbacks
Take profit targets are assigned to each ladder with dynamic average entry updates
A fallback global take profit is used when no ladders are active
Stop loss is managed at a structural level
This system is built for traders who prefer rules over emotions
⚙️ Input Sections
🪜 Ladder Entry Settings
Set percentage distance between ladder steps
Define the first entry size
Assign additional size for each ladder step
Allows flexible scaling into positions with controlled risk
🎯 Take Profit Settings
Set global take profit for longs and shorts before any ladders are filled
Define individual take profit levels for each ladder
Only one take profit is active at a time depending on ladder status
🛡️ Stop Loss Settings
Set percentage stop loss below or above average entry for long and short trades
Designed to exit when market structure is broken
Optional and fully customizable
📐 Trend Engine Settings
Adjust upper and lower trend filters to control signal sensitivity
Change signal length to smooth the trend detection
Choose source input for trend logic like close or hl2
Fine-tune to reduce false signals or increase confirmation strength
🔁 Strategy Flow
📍 Entry and Ladder Progression
Trade begins when the trend breakout is confirmed
Initial base position is entered
As price moves deeper, ladder entries are triggered
Each ladder entry recalculates the average price
Old take profit is disabled and new one is assigned
This creates a fluid and responsive position builder
💰 Take Profit Logic
A global take profit is used if no ladders are filled
When ladder one is triggered, global take profit is disabled
New take profit is tied to the updated average price
Each ladder step updates the take profit accordingly
Visual markers and alerts are shown when targets are hit
🛑 Stop Loss Logic
Stop loss is calculated relative to the average entry
Only triggered if structural breakdown occurs
Can be turned off or adjusted based on risk preference
📊 Visual Chart Aids
🟢 Green circles show active ladder take profits for long trades
🟠 Orange circles show active ladder take profits for short trades
🔵 Blue circles show global take profit level
🔺 Trend bands act as entry zone and direction filters
💡 Strategy Tips
Use wider ladder spacing in volatile markets like BTC or ETH
Smaller take profits are better for scalping
Increase trend filter range if you’re getting too many false signals
Enable or disable long and short entries based on market conditions
📢 ALERT SYSTEM — DMT Autobot Dragonfly Edition
This strategy works seamlessly with TradingView alerts and automation systems
Every entry, ladder, take profit, and stop can trigger real-time alerts for bots or webhooks
🔔 Types of Alerts
lentry and SEntry trigger long and short entries
ADD1 to ADD4 are sent as ladder steps are activated
TP alerts are triggered when targets are reached
close_all signals full exit from the position
🧠 How It Works
Alerts are generated based on logic inside the strategy
You can create alerts in TradingView and connect them to bots or external platforms
⚙️ Recommended Alert Settings
Entry alerts should be set to once per bar close
Ladder adds should be set to once per bar
Take profits should be set to once per bar for better timing
Stop loss or exit alerts should be once per bar close
Once per bar is more responsive and helps avoid missing take profit hits
📈 Entry and Exit Logic
Each ladder or take profit follows strict logic
Alerts are only sent when exact trade conditions are met
Helps automate clean and reliable execution
🔄 Ladder System and Alerts
Every ladder step has a dedicated alert
Take profit is recalculated each time a ladder fills
The system supports full automation with dynamic trade logic
Bots can follow each step as price evolves
⚠️ Leveraged Trading Considerations
If using leverage, check that your ladder spacing and size is appropriate
Make sure your account can handle full position build
Strategy can recover positions using precision, but leverage increases risk
🧭 Final Note
DRAGONFLY 2.0 supports full automation and is compatible with most trading bots
For access, contact me directly on TradingView chat
Stay focused and trade smart with DRAGONFLY 2.0

ETH-BCH Strategy4 (Powered by BCH)ETH-BCH Strategy4 (Powered by BCH)
Difference of ETH-BCH Strategy3
This strategy focused for the more conservative users.
Less trades but higher hit rate. Better profit ratio.
This is a high-risk, high-return strategy with a higher trading frequency than the previous ETH-BCH Strategy.
Unlock a new perspective on crypto trading with our innovative ETH-BCH Strategy, now specially optimized for the ETHUSDT 2-hour chart. Available exclusively on TradingView for a limited time, this strategy leverages the unique interplay between Bitcoin Cash (BCH), Ethereum (ETH), and Bitcoin (BTC) to identify high-probability trading opportunities—without relying on conventional single-asset signals.
Key Highlights:
Multi-Asset Analysis: Dynamically compares price movements and momentum between BCH, ETH, and BTC, seeking to capture relative strength and weakness across major cryptocurrencies.
Advanced Technical Filters: Incorporates a blend of classic and proprietary indicators, including:
Bollinger Bands for volatility-based entry and exit zones
Volume surges to confirm genuine market interest
Momentum oscillators for trend validation and overbought/oversold detection
Smart Entry & Exit Logic: Buy and sell conditions are designed to avoid noise and false signals, focusing on periods of significant divergence and market inflection points.
Risk Management Built-In: Includes timing filters to prevent overtrading and optimize entry and exit timing.
Visual Insights: Key indicator levels and signals are clearly plotted for intuitive chart-based decision-making.
The full algorithmic logic remains proprietary, ensuring a competitive edge for early adopters. Experience the performance and transparency of the strategy in action—without revealing the core code.
Try it now and see how cross-asset crypto analytics—tailored for the ETHUSDT 2-hour timeframe—can elevate your trading decisions.
Available as a protected script—contact us for access or more information.
Note: This strategy is for educational and informational purposes only. Past performance does not guarantee future results.

5-Indicator Swing StrategyCustom 5-Indicator Swing Strategy for 4H Chart
---
Key Features:
1. Price Uptrend Detection
Uses 50-period EMA as trend filter
Only takes long positions when price is above EMA
2. RSI Momentum Confirmation
RSI must be above 40 and rising (3-bar confirmation)
Includes overbought exit at RSI > 70
3. MACD Bullish Crossover
Detects when MACD line crosses above signal line
Uses standard 12/26/9 settings (customizable)
4. Volume Spike Detection
Identifies volume spikes 1.5x above 20-period average
Confirms breakout strength
5. Fibonacci Retracement Levels
Calculates dynamic Fibonacci levels from recent swing high/low
Enters when price is near 38.2% to 61.8% support levels
Additional Features:
Risk Management: Stop Loss: 2 x ATR below entry price / Take Profit: 3 x ATR above entry price
ATR Length: 14 periods
Visual Indicators: Clear entry/exit signals with shapes
Information Table: Real-time status of all 5 conditions
Multi-Panel Display: RSI, MACD, and Volume in separate panels
Customizable Parameters: All inputs can be adjusted
Alert System: Built-in alerts for entry and exit signals

SIWONK V11The SIWONK V11 indicator was designed to help traders identify key market zones based on Support & Resistance (S&R) principles, along with Crossing analysis. The SIWONK V11 indicator is suitable for scalping, particularly in the Gold (XAUUSD) and Bitcoin (BTC) markets on lower timeframes like M1 and M5. It can also be used on all timeframes.

ETH-BCH Strategy3 (Powered by BCH)ETH-BCH Strategy3 (Powered by BCH)
Difference of ETH-BCH Strategy2
This strategy more focused not change rate but trade volume.
Less trades but higher hit rate.
This is a high-risk, high-return strategy with a higher trading frequency than the previous ETH-BCH Strategy.
Unlock a new perspective on crypto trading with our innovative ETH-BCH Strategy, now specially optimized for the ETHUSDT 2-hour chart. Available exclusively on TradingView for a limited time, this strategy leverages the unique interplay between Bitcoin Cash (BCH), Ethereum (ETH), and Bitcoin (BTC) to identify high-probability trading opportunities—without relying on conventional single-asset signals.
Key Highlights:
Multi-Asset Analysis: Dynamically compares price movements and momentum between BCH, ETH, and BTC, seeking to capture relative strength and weakness across major cryptocurrencies.
Advanced Technical Filters: Incorporates a blend of classic and proprietary indicators, including:
Bollinger Bands for volatility-based entry and exit zones
Volume surges to confirm genuine market interest
Momentum oscillators for trend validation and overbought/oversold detection
Smart Entry & Exit Logic: Buy and sell conditions are designed to avoid noise and false signals, focusing on periods of significant divergence and market inflection points.
Risk Management Built-In: Includes timing filters to prevent overtrading and optimize entry and exit timing.
Visual Insights: Key indicator levels and signals are clearly plotted for intuitive chart-based decision-making.
The full algorithmic logic remains proprietary, ensuring a competitive edge for early adopters. Experience the performance and transparency of the strategy in action—without revealing the core code.
Try it now and see how cross-asset crypto analytics—tailored for the ETHUSDT 2-hour timeframe—can elevate your trading decisions.
Available as a protected script—contact us for access or more information.
Note: This strategy is for educational and informational purposes only. Past performance does not guarantee future results.

Friedrich's Ichimoku & EMA Strategy📈 Friedrich's Ichimoku & EMA Strategy
This strategy combines the strength of the Ichimoku Cloud with the long-term trend confirmation of the 200 EMA to identify high-probability long entries.
🧠 Strategy Logic
Entry Conditions:
- Price is above the Ichimoku Cloud (bullish confirmation).
- Price is above the 200 EMA (long-term trend is up).
Exit Conditions:
- Price falls below the Ichimoku Cloud, or
- Price drops below the 200 EMA while in an open position.
📊 Visual Features
Plots Lead Line 1 & 2 of the Ichimoku Cloud.
Fills the cloud area for clear visual trend recognition.
Plots the 200 EMA to show long-term trend alignment.
🔔 Alerts
Long Entry Signal: When all conditions align for a long.
Close Signal: When price invalidates the setup.
🕒 Recommended Use
Best used on the 6H (6-hour) timeframe.
Optimized for Bitcoin (BTC/USD), but adaptable to other trending assets.
💡 Use Case
This strategy is designed for traders who want to:
Ride strong trends.
Use a rule-based approach with clear visual guidance.
You can customize the Ichimoku or EMA settings to fit your asset or time frame.

Gaussian/Stoch-RSI Breakout Strategy🧠 Overview
The Gaussian/Stoch-RSI Breakout Strategy is a trend-following breakout strategy that combines a Gaussian Moving Average Channel with a Stochastic RSI filter. It identifies bullish breakouts when price exceeds statistically significant volatility bands and momentum confirms the move.
This strategy is best suited for trend initiation points and works across various asset classes (e.g., Forex, indices, crypto) and timeframes.
⚙️ Strategy Logic
🎯 Entry Conditions (Long Only)
A long position is triggered when both of the following conditions are met:
The closing price crosses above the upper Gaussian channel.
The Stoch RSI K line crosses above the D line (indicating bullish momentum).
❌ Exit Conditions
The long position is closed when:
The closing price falls back below the upper Gaussian channel.
🧮 Indicators & Calculations
📈 Gaussian Moving Average Channel
A Gaussian-weighted moving average is used to smooth price.
Standard deviation is computed using Gaussian weights to construct a volatility-based channel.
The channel is defined by:
Midline: Gaussian-weighted moving average
Upper Band: Midline + (Standard Deviation × Multiplier)
Lower Band: Midline − (Standard Deviation × Multiplier)
🔁 Stochastic RSI
Combines RSI with a Stochastic calculation to identify momentum shifts.
Used as a filter to confirm the strength of a breakout.
The following plots are displayed on the chart:
Gaussian Midline – Red line: core trend anchor
Upper & Lower Bands – Blue lines: breakout thresholds
Stochastic RSI is not plotted by default but used internally
🛠️ Notes & Best Practices
Timeframe: Strategy can be used on intraday or higher timeframes. For reduced noise, consider using it on 1H or higher.
No Short Trades: This version is long-only.
No Stop Loss / Take Profit: The strategy relies on a trailing exit via the Gaussian channel.
📌 Disclaimer
This strategy is intended for educational and research purposes only. Past performance does not guarantee future results. Always test strategies in a simulated environment before deploying them on a live account. This is not financial advice.

Pullback Pro Dow Strategy v7 (ADX Filter)
### **Strategy Description (For TradingView)**
#### **Title:** Pullback Pro: Dow Theory & ADX Strategy
---
#### **1. Summary**
This strategy is designed to identify and trade pullbacks within an established trend, based on the core principles of Dow Theory. It uses market structure (pivot highs and lows) to determine the trend direction and an Exponential Moving Average (EMA) to pinpoint pullback entry opportunities.
To enhance trade quality and avoid ranging markets, an ADX (Average Directional Index) filter is integrated to ensure that entries are only taken when the trend has sufficient momentum.
---
#### **2. Core Logic: How It Works**
The strategy's logic is broken down into three main steps:
**Step 1: Trend Determination (Dow Theory)**
* The primary trend is identified by analyzing recent pivot points.
* An **Uptrend** is confirmed when the script detects a pattern of higher highs and higher lows (HH/HL).
* A **Downtrend** is confirmed by a pattern of lower highs and lower lows (LH/LL).
* If neither pattern is present, the strategy considers the market to be in a range and will not seek trades.
**Step 2: Entry Signal (Pullback to EMA)**
* Once a clear trend is established, the strategy waits for a price correction.
* **Long Entry:** In a confirmed uptrend, a long position is initiated when the price pulls back and crosses *under* the specified EMA.
* **Short Entry:** In a confirmed downtrend, a short position is initiated when the price rallies and crosses *over* the EMA.
**Step 3: Confirmation & Risk Management**
* **ADX Filter:** To ensure the trend is strong enough to trade, an entry signal is only validated if the ADX value is above a user-defined threshold (e.g., 25). This helps filter out weak signals during choppy or consolidating markets.
* **Stop Loss:** The initial Stop Loss is automatically and logically placed at the last market structure point:
* For long trades, it's placed at the `lastPivotLow`.
* For short trades, it's placed at the `lastPivotHigh`.
* **Take Profit:** Two Take Profit levels are calculated based on user-defined Risk-to-Reward (R:R) ratios. The strategy allows for partial profit-taking at the first target (TP1), moving the remainder of the position to the second target (TP2).
---
#### **3. Input Settings Explained**
**① Dow Theory Settings**
* **Pivot Lookback Period:** Determines the sensitivity for detecting pivot highs and lows. A smaller number makes it more sensitive to recent price swings; a larger number focuses on more significant, longer-term pivots.
**② Entry Logic (Pullback)**
* **Pullback EMA Length:** Sets the period for the Exponential Moving Average used to identify pullback entries.
**③ Risk & Exit Management**
* **Take Profit 1 R:R:** Sets the Risk-to-Reward ratio for the first take-profit target.
* **Take Profit 1 (%):** The percentage of the position to be closed when TP1 is hit.
* **Take Profit 2 R:R:** Sets the Risk-to-Reward ratio for the final take-profit target.
**④ Filters**
* **Use ADX Trend Filter:** A master switch to enable or disable the ADX filter.
* **ADX Length:** The lookback period for the ADX calculation.
* **ADX Threshold:** The minimum ADX value required to confirm a trade signal. Trades will only be placed if the ADX is above this level.
---
#### **4. Best Practices & Recommendations**
* This is a trend-following system. It is designed to perform best in markets that exhibit clear, sustained trending behavior.
* It may underperform in choppy, sideways, or strongly ranging markets. The ADX filter is designed to help mitigate this, but no filter is perfect.
* **Crucially, you must backtest this strategy thoroughly** on your preferred financial instrument and timeframe before considering any live application.
* Experiment with the `Pivot Lookback Period`, `Pullback EMA Length`, and `ADX Threshold` to optimize performance for a specific market's characteristics.
---
#### **DISCLAIMER**
This script is provided for educational and informational purposes only. It does not constitute financial advice. All trading involves a high level of risk, and past performance is not indicative of future results. You are solely responsible for your own trading decisions. The author assumes no liability for any financial losses you may incur from using this strategy. Always conduct your own research and due diligence.

The Price ModelOpening Range Breakout
Focuses on taking advantage of the New York Opening High volatility
Main goal is to catch simple and straight forward trades with Strict rules
Recommend Targeting 1:1 first, and then setting stop to breakeven after 1:1 is hit
Can use 5 Min ORB 1:1 as a second TP after entering on the prior 1min ORB.

Momentum Trading StrategyThis is a Trend Following Momentum Strategy, where i used EMA, ADX, RSI, VWAP to take trade with Trend and initiate trade when Momentum builds up.
The Default target is 1:2

RSI Bullish Divergence TraderThis RSI Divergence Buy strategy identifies bullish divergence by detecting confirmed swing lows where the price forms a lower low compared to the previous swing low, but the RSI indicator shows a higher low, signaling weakening downward momentum often in oversold conditions. It enters a long position upon confirmation of these criteria, with the entry visualized by a green upward triangle below the pivot bar. Positions are exited either when the RSI crosses above a specified mean-reversion level (like 55) for profit-taking or hits a dynamic stop-loss set a percentage below the pivot low to manage risk.

RSI Divergence Buy v4 - More TradesThis RSI Divergence Buy strategy identifies bullish divergence by detecting confirmed swing lows where the price forms a lower low compared to the previous swing low, but the RSI indicator shows a higher low, signaling weakening downward momentum often in oversold conditions. It enters a long position upon confirmation of these criteria, with the entry visualized by a green upward triangle below the pivot bar. Positions are exited either when the RSI crosses above a specified mean-reversion level (like 55) for profit-taking or hits a dynamic stop-loss set a percentage below the pivot low to manage risk.

ETH-BCH Strategy2 (Powered by BCH)ETH-BCH Strategy2 (Powered by BCH)
This is a high-risk, high-return strategy with a higher trading frequency than the previous ETH-BCH Strategy.
Unlock a new perspective on crypto trading with our innovative ETH-BCH Strategy, now specially optimized for the ETHUSDT 2-hour chart. Available exclusively on TradingView for a limited time, this strategy leverages the unique interplay between Bitcoin Cash (BCH), Ethereum (ETH), and Bitcoin (BTC) to identify high-probability trading opportunities—without relying on conventional single-asset signals.
Key Highlights:
Multi-Asset Analysis: Dynamically compares price movements and momentum between BCH, ETH, and BTC, seeking to capture relative strength and weakness across major cryptocurrencies.
Advanced Technical Filters: Incorporates a blend of classic and proprietary indicators, including:
Bollinger Bands for volatility-based entry and exit zones
Volume surges to confirm genuine market interest
Momentum oscillators for trend validation and overbought/oversold detection
Smart Entry & Exit Logic: Buy and sell conditions are designed to avoid noise and false signals, focusing on periods of significant divergence and market inflection points.
Risk Management Built-In: Includes timing filters to prevent overtrading and optimize entry and exit timing.
Visual Insights: Key indicator levels and signals are clearly plotted for intuitive chart-based decision-making.
The full algorithmic logic remains proprietary, ensuring a competitive edge for early adopters. Experience the performance and transparency of the strategy in action—without revealing the core code.
Try it now and see how cross-asset crypto analytics—tailored for the ETHUSDT 2-hour timeframe—can elevate your trading decisions.
Available as a protected script—contact us for access or more information.
Note: This strategy is for educational and informational purposes only. Past performance does not guarantee future results.

BTC-BCH Strategy (Powered by BCH)BTC-BCH Strategy (Powered by BCH)
Unlock a new perspective on crypto trading with our innovative BTC-BCH Strategy, now specially optimized for the BTCUSDT 2-hour chart. Available exclusively on TradingView for a limited time, this strategy leverages the unique interplay between Bitcoin Cash (BCH), Bitcoin (BTC) to identify high-probability trading opportunities—without relying on conventional single-asset signals.
Key Highlights:
Multi-Asset Analysis: Dynamically compares price movements and momentum between BCH, BTC, seeking to capture relative strength and weakness across major cryptocurrencies.
Advanced Technical Filters: Incorporates a blend of classic and proprietary indicators, including:
Bollinger Bands for volatility-based entry and exit zones
Volume surges to confirm genuine market interest
Momentum oscillators for trend validation and overbought/oversold detection
Smart Entry & Exit Logic: Buy and sell conditions are designed to avoid noise and false signals, focusing on periods of significant divergence and market inflection points.
Risk Management Built-In: Includes timing filters to prevent overtrading and optimize entry and exit timing.
Visual Insights: Key indicator levels and signals are clearly plotted for intuitive chart-based decision-making.
The full algorithmic logic remains proprietary, ensuring a competitive edge for early adopters. Experience the performance and transparency of the strategy in action—without revealing the core code.
Try it now and see how cross-asset crypto analytics—tailored for the BTCUSDT 2-hour timeframe—can elevate your trading decisions.
Available as a protected script—contact us for access or more information.
Note: This strategy is for educational and informational purposes only. Past performance does not guarantee future results.
