True Breakout Pattern [TradingFinder] Breakout Signal Indicator🔵 Introduction
In many market conditions, what initially appears to be a decisive breakout often turns out to be nothing more than a false breakout or fake breakout. Price breaks through a key swing level or an important support and resistance zone, only to quickly return to its previous range.
These failed breakouts, which are often the result of liquidity traps or market manipulation, serve more as a warning sign of structural weakness than confirmation of a new trend.
This indicator is designed around the concept of the fake breakout.
The logic is simple but precise : when price breaks a swing level and returns to that level within a maximum of five candles, the move is considered a false breakout. At this point, a Fibonacci retracement is applied to the recent price swing to evaluate the pullback area.
If price, within ten candles after the return to the breakout level, enters the Fibonacci zone between 0.618 and 1.0, the setup becomes valid for a potential entry. This area is identified as a long entry zone, with the stop loss placed just beyond the 1.0 level and the take profit defined based on the desired risk-to-reward ratio.
By combining accurate detection of false breakouts, analysis of price reaction to swing levels, and alignment with Fibonacci retracement logic, this framework allows traders to identify opportunities often missed by others. In a market where failed breakouts are a common and recurring phenomenon, this indicator aims to transform these traps into measurable trading opportunities.
Long Setup :
Short Setup :
🔵 How to Use
This indicator operates based on the recognition of false breakouts from structural levels in the market, specifically swing levels, and combines that with Fibonacci retracement analysis.
In this strategy, trades are only considered when price returns to the broken level within a defined time window and reacts appropriately inside a predefined Fibonacci range. Depending on the direction of the initial breakout, the system outlines two scenarios for long and short setups.
🟣 Long Setup
In the long setup, price initially breaks below a support level or swing low. If the price returns to the broken level within a maximum of five candles, the move is identified as a fake breakout.
At this stage, a Fibonacci retracement is drawn from the recent high to the low. If price, within ten candles of returning to the level, moves into the 0.618 to 1.0 Fibonacci zone, the conditions for a long entry are met.
The stop loss is placed slightly below the 1.0 level, while the take profit is set based on the trader’s preferred risk-reward ratio. This setup aims to capture deeply discounted entries at low risk, aligned with smart money reversals.
🟣 Short Setup
In the short setup, the price breaks above a resistance level or swing high. If the price returns to that level within five candles, the move is again treated as a false breakout. Fibonacci is then drawn from the recent low to the high to observe the retracement area.
Should price enter the 0.618 to 1.0 Fibonacci range within ten candles of returning, a short entry is considered valid. In this case, the stop loss is placed just above the 1.0 level, and the take profit is adjusted based on the intended risk-reward target. This method allows traders to identify high-probability short setups by focusing on failed breakouts and deep pullbacks.
🔵 Settings
🟣 Logical settings
Swing period : You can set the swing detection period.
Valid After Trigger Bars : Limits how many candles after a fake breakout the entry zone remains valid.
Max Swing Back Method : It is in two modes "All" and "Custom". If it is in "All" mode, it will check all swings, and if it is in "Custom" mode, it will check the swings to the extent you determine.
Max Swing Back : You can set the number of swings that will go back for checking.
🟣 Display settings
Displaying or not displaying swings and setting the color of labels and lines.
🟣 Alert Settings
Alert False Breakout : Enables alerts for Breakout.
Message Frequency : Determines the frequency of alerts. Options include 'All' (every function call), 'Once Per Bar' (first call within the bar), and 'Once Per Bar Close' (final script execution of the real-time bar). Default is 'Once per Bar'.
Show Alert Time by Time Zone : Configures the time zone for alert messages. Default is 'UTC'.
🔵 Conclusion
A sound understanding of the false breakout phenomenon and its relationship to structural price behavior is essential for technical traders aiming to improve precision and consistency. Many poor trading decisions stem from misinterpreting failed breakouts and entering too early into weak signals.
A structured approach, grounded in the analysis of swing levels and validated through specific price action and timing rules, can turn these misleading moves into valuable trade opportunities.
This indicator, by combining fake breakout detection with time filters and Fibonacci-based retracement zones, helps traders only engage with the market when multiple confirming factors are in alignment. The result is a strategy that emphasizes probability, risk control, and clarity in decision-making, offering a solid edge in navigating today’s volatile markets.
Trend Analizi

Support Resistance with Order BlocksIndicator Description
Professional Price Level Detection for Smart Trading. Master the Markets with Precision Support/Resistance and Order Block Analysis . It provides traders with clear visual cues for potential reversal and breakout areas, combining both retail and institutional trading concepts into one powerful tool.
The Support & Resistance with Order Blocks indicator is a versatile Pine Script tool designed to empower traders with clear, actionable insights into key market levels. By combining advanced pivot-based support and resistance (S/R) detection with order block (OB) filtering, this indicator delivers clean, high-probability zones for entries, exits, and reversals. With customizable display options (boxes or lines) and intuitive settings, it’s perfect for traders of all styles—whether you’re scalping, swing trading, or investing long-term. Overlay it on your TradingView chart and elevate your trading strategy today!
________________________________________
Key Features
✅ Dynamic Support/Resistance - Auto-adjusting levels based on price action
✅ Smart Order Block Detection - Identifies institutional buying/selling zones
✅ Dual Display Modes - Choose between Boxes or Clean Lines for different chart styles
✅ Customizable Sensitivity - Adjust detection parameters for different markets
✅ Broken Level Markers - Clearly shows when key levels are breached
✅ Timeframe-Adaptive - Automatically adjusts for daily/weekly charts
1. Dynamic Support & Resistance Detection
Identifies critical S/R zones using pivot high/low calculations with adjustable look back periods.
Visualizes active S/R zones with distinct colors and labels ("Support" or "Resistance" for boxes, lines for cleaner charts).
Marks broken S/R levels as "Br S" (broken support) or "Br R" (broken resistance) when historical display is enabled, aiding in breakout and reversal analysis.
2. Smart Order Block Identification
Detects bullish and bearish order blocks based on significant price movements (default: ±0.3% over 5 candles).
Highlights institutional buying/selling zones with customizable colors, displayed as boxes or lines.
Filters out overlapping OB zones to keep your chart clutter-free.
3. Dual Display Options
Boxes or Lines: Choose to display S/R and OB as boxes for detailed zones or lines for a minimalist view.
Line Width Customization: Adjust line widths for S/R and OB (1–5 pixels) for optimal visibility.
Color Customization: Tailor colors for active/broken S/R and bullish/bearish OB zones.
4. Advanced Overlap Filtering
Ensures S/R zones don’t overlap with OB zones or other S/R levels, providing only the most relevant levels.
Limits the number of active zones (default: 10) to maintain chart clarity.
5. Historical S/R Visualization
Optionally display broken S/R levels with distinct colors and labels ("Br S" or "Br R") to track historical price reactions.
Broken levels are dynamically updated and removed (or retained) based on user settings.
6. Timeframe Adaptability
Automatically adjusts pivot detection for daily/weekly timeframes (40-candle look back) versus shorter timeframes (20-candle look back).
Works seamlessly across all asset classes (stocks, forex, crypto, etc.) and timeframes.
________________________________________
How It Works
• Support & Resistance:
Uses ta.pivothigh and ta.pivotlow to detect significant price pivots, with a user-defined look back (default: 5 candles post-pivot).
Plots S/R as boxes (with labels "Support" or "Resistance") or lines, extending to the current bar for real-time relevance.
Broken S/R levels are marked with adjusted colors and labels ("S" or "R" for boxes, "Br S" or "Br R" for lines when historical display is enabled).
• Order Blocks:
Identifies OB based on strong price movements over 4 candles, plotted as boxes or lines at the candle’s midpoint.
Validates OB to prevent overlap, ensuring only significant zones are displayed.
Removes OB zones when price breaks through, keeping the chart focused on active levels.
• Customization:
Toggle S/R and OB visibility, adjust detection sensitivity, and set maximum active zones (4–50).
Fine-tune line widths and colors for a personalized chart experience.
________________________________________
Why Use This Indicator?
• Precision Trading: Pinpoint high-probability entry/exit zones with filtered S/R and OB levels.
• Clean Charts: Overlap filtering and zone limits reduce clutter, focusing on key levels.
• Versatile Display: Switch between boxes for detailed zones or lines for simplicity, with adjustable line widths.
• Institutional Edge: Leverage OB detection to align with institutional activity for smarter trades.
• User-Friendly: Intuitive settings and clear visuals make it accessible for beginners and pros alike.
________________________________________
Settings Overview________________________________________
⚙ Input Parameters
Settings Overview
Display Options:
Display Type: Choose "Boxes" or "Lines" for S/R and OB visualization.
S/R Line Width: Set line thickness for S/R lines (1–5 pixels, default: 2).
OB Line Width: Set line thickness for OB lines (1–5 pixels, default: 2).
Order Block Options:
Show Order Block: Enable/disable OB display.
Bull/Bear OB Colors: Customise border and fill colors for bullish and bearish OB zones.
Support/Resistance Options:
Show S/R: Toggle active S/R zones.
Show Historical S/R: Display broken S/R levels, marked as "Br S" or "Br R" for lines.
Detection Period: Set candle lookback for pivot detection (4–50, default: 5).
Max Active Zones: Limit active S/R and OB zones (4–50, default: 10).
Colors: Customise active and broken S/R colors for clear differentiation.
________________________________________
How to Use
1. Add to Chart: Apply the indicator to your TradingView chart.
2. Customize Settings:
o Select "Boxes" or "Lines" for your preferred display style.
o Adjust line widths, colors, and detection parameters to suit your trading style.
o Enable "Show Historical S/R" to track broken levels with "Br S" and "Br R" labels.
3. Analyze Levels:
o Use support zones (green) for buy entries and resistance zones (red) for sell entries.
o Monitor OB zones for institutional activity, signaling potential reversals or continuations.
o Watch for "Br S" or "Br R" labels to identify breakout opportunities.
4. Combine with Other Tools: Pair with trend indicators, volume analysis, or price action for a robust strategy.
5. Monitor Breakouts: Trade breakouts when price breaches S/R or OB zones, with historical labels providing context.
________________________________________
Example Use Cases
• Swing Trading: Use S/R and OB zones to identify entry/exit points, with historical broken levels for context.
• Breakout Trading: Trade price breaks through S/R or OB, using "Br S" and "Br R" labels to confirm reversals.
• Scalping: Adjust detection period for faster S/R and OB identification on lower timeframes.
________________________________________
• Performance: Optimized for all timeframes, with best results on 5M, 15M, 30M, 1H, 4H, or daily charts for swing trading.
• Compatibility: Works with any asset class and TradingView chart.
________________________________________
Get Started
Transform your trading with Support & Resistance with Order Blocks! Add it to your chart, customize it to your style, and trade with confidence. For questions or feedback, drop a comment on TradingView or message the author. Happy trading! 🚀
________________________________________
Disclaimer: This indicator is for educational and informational purposes only. Always conduct your own analysis and practice proper risk management before trading.

Smart Directional Fib Zone (Selectable Session)🎯 Overview
This indicator plots a dynamic Fibonacci zone between the 0.5 and 0.618 levels , calculated from the previous day’s price action , and is designed specifically for intraday traders.
It visually highlights key retracement or reaction areas where the market often pauses or reverses.
🔍 How it works
At the start of each day, the script automatically captures:
the previous day’s open (pdo),
high (pdh),
low (pdl),
and close (pdc).
It then determines if the previous day was bullish (Close > Open) or bearish (Close < Open).
Based on that:
If the previous day was bullish, it projects the Fibonacci levels down from the high (typical for expecting retracements).
If bearish, it projects them up from the low.
The two key levels are:
0.5 (50%) retracement / projection
0.618 (61.8%) retracement / projection
A colored zone is plotted between these levels to act as a leading guide for intraday setups.
⏰ Time filtering & session customization
A unique feature is the dynamic session filtering:
By default, the zone is only plotted during active market hours, keeping your chart clean outside trading hours.
The script provides a dropdown selector so you can quickly switch between:
India session (9:15 to 15:30)
Europe session (9:00 to 17:30)
US session (9:30 to 16:00)
Or even define your own custom session times.
This makes it ideal for intraday traders in any region.
🎨 Visual features
The fill zone changes color based on the previous day’s sentiment:
Green zone if the previous day was bullish
Red zone if the previous day was bearish
🚨 Alerts
The script includes an alert condition, so you can easily set up TradingView alerts to notify you when:
Price enters the Fibonacci zone.
This is extremely helpful for catching retracements or reversals without staring at the screen all day.
⚙️ How to use
✅ Works on any intraday timeframe (1 min, 5 min, 15 min, etc.).
✅ Simply add it to your chart, pick your session in the dropdown, and watch the Fibonacci zone automatically adjust to your selected market hours.
Use it as a confluence tool alongside other indicators like VWAP, EMAs, Bollinger Bands, or price action patterns to time entries and exits.
💪 Why this is powerful
This is more than a simple Fib retracement tool:
It dynamically adapts to the previous day’s sentiment, helping you trade in alignment with recent market psychology.
The session filtering ensures your charts are focused only on the periods

IU Engulfing Candlestick PatternDISCRIPTION
📈 The IU Engulfing Candlestick Pattern indicator spotlights both bullish and bearish engulfing formations in real‑time. It shades each pattern with a transparent box and drops a concise label so you can catch potential reversals at a glance—no clutter, no noise, just the candles that matter.
USER INPUTS :
1. Pattern Recognition Based on = “Both” | “Wicks” | “Body” ( Default Both )
• Both → only highlights candles that satisfy **both** wick‑and‑body engulfing rules
• Wicks → checks full candle range (high‑to‑low)
• Body → checks only the real bodies (open‑to‑close)
2. Show Labels ( Default true )
If ticked then it will show the text as "Bullish Engulfing" or "Bearish Engulfing".
3. Show The Box ( Default true)
if ticked then it will show the green or red boxes.
INDICATOR LOGIC:
🔹 Bullish Engulfing (green box)
– Current bar closes higher than it opens and fully “wraps” the prior bar per your chosen rule.
🔹 Bearish Engulfing (red box)
– Current bar closes lower than it opens and fully “wraps” the prior bar per your chosen rule.
🔸 When a pattern confirms:
1. The script records the local high/low range.
2. Draws a semi‑transparent box spanning the engulfing pair.
3. Prints a compact up/down label exactly at the reaction point.
4. Fires a once‑per‑bar alert (“Bullish Engulfing” / “Bearish Engulfing”) you can route to webhooks or notifications.
WHY IT IS UNIQUE:
✨ Combines classic body‑only engulfing with an optional wick filter, letting traders demand stricter confirmation when markets are noisy.
✨ Box overlays visually segment the engulfed range—clearer than single‑bar markers.
✨ Lightweight: one input, zero repaint, and capped at 500 boxes to keep charts responsive.
✨ Ready‑to‑use alerts—no extra code needed for automation.
HOW USER CAN BENIFIT FROM IT :
- Spot early reversal zones or continuation thrusts without scanning candle by candle.
- Pair the alerts with trading bots, TradingView strategy testers, or mobile push notifications.
- Adapt the strictness (Body vs. Wicks vs. Both) to suit different assets, timeframes, or volatility regimes.
- Use the colored range boxes as dynamic support/resistance references for entries, targets, and stop‑loss placement.
📌 Tip: Test on multiple instruments and timeframes to find the sweet spot that matches your risk profile. This script is for educational purposes—always combine with sound risk management and confirm signals with broader market context.
Disclaimer :
This Video is not financial advice, it's for educational purposes only highlighting the power of coding( pine script) in TradingView, I am not a SEBI-registered advisor. Trading and investing involve risk, and you should consult with a qualified financial advisor before making any trading decisions. I do not guarantee profits or take responsibility for any losses you may incur.

Fibonacci Optimal Entry ZoneFibonacci Optimal Entry Zone - Professional Market Structure Trading Tool
Overview
This indicator combines market structure analysis with dynamic Fibonacci retracement levels to identify optimal entry zones in trending markets. Unlike standard Fibonacci tools, this indicator automatically detects swing points, tracks market structure changes (CHoCH - Change of Character), and adapts Fibonacci levels in real-time as new market structure develops.
Key Innovation - Why This Combination Works
This tool merges two powerful concepts:
Smart Money Concepts (SMC) market structure detection
Automated Fibonacci retracement analysis
The synergy creates a systematic approach to finding high-probability reversal zones by waiting for structure breaks before drawing Fibonacci levels, ensuring you're always trading with the trend rather than against it.
How It Works
1. Market Structure Detection
Uses pivot high/low analysis to identify significant swing points
Detects "Change of Character" (CHoCH) when price breaks previous structure
Distinguishes between bullish (Higher Highs/Higher Lows) and bearish (Lower Highs/Lower Lows) market conditions
2. Dynamic Fibonacci Deployment
Automatically draws Fibonacci retracements between the most recent significant swings
Updates levels in real-time as new structure forms
Includes extended levels (-2.0 to 1.618) for both retracement and extension analysis
3. Optimal Entry Zone Identification
Highlights the "Golden Zone" (0.5-0.618 for bullish, 0.382-0.5 for bearish)
Provides visual fills between key levels to identify confluence zones
Shows exact price levels at each Fibonacci ratio
Trading Methodology
For Bullish Setups:
Wait for a bullish CHoCH (break above previous high)
Monitor price retracement to Fibonacci levels
Look for entries in the 0.5-0.618 zone (Golden Zone)
Use 0.786 as final support before trend invalidation
For Bearish Setups:
Wait for a bearish CHoCH (break below previous low)
Monitor price retracement to Fibonacci levels
Look for entries in the 0.382-0.5 zone
Use 0.236 as final resistance before trend invalidation
Unique Features
Swing Tracker Mode: Continuously updates Fibonacci levels with each new swing
Structure Period Optimization: Adjustable lookback period (default 10) to capture different market conditions
Visual Clarity: Customizable colors, line styles, and label positions
Fill Zones: Create visual zones between any two Fibonacci levels
Extended Levels: Includes negative Fibonacci levels for advanced harmonic patterns
Real-time Updates: Levels extend to current bar for immediate analysis
Best Practices
Timeframe Selection: Works best on H1 and above for swing trading, M15-H1 for intraday
Confluence: Combine with support/resistance, moving averages, or volume analysis
Risk Management: Use the 0.786 level (bullish) or 0.236 level (bearish) for stop-loss placement
Trend Confirmation: Only take trades in the direction of the CHoCH signal
Settings Guide
Structure Period: Higher values (15-20) for major swings, lower values (5-10) for minor swings
Swing Tracker: Enable for active markets, disable for cleaner historical analysis
Fibonacci Levels: Customize which levels to display based on your trading style
Golden Zone Fill: Highlights the optimal entry area for visual clarity
This indicator is designed for traders who understand market structure and want an automated, systematic approach to Fibonacci-based entries. It removes the subjectivity of manual Fibonacci placement while ensuring you're always aligned with the current market structure.
Chart Requirements:
Use a clean chart with only this indicator
Show at least one complete CHoCH signal with Fibonacci levels
Demonstrate how the levels update with new swings
Highlight the golden zone if enabled

Price × Volume Momentum (FSTO / RSI / Avg)decided to combine my PXVS and PXVR in to one script. user has the option to use FSTO, RSI, or the average between the two oscillators.
the oscillator components have been modified to range from -100 to +100 to express directional magnitude.
volume remains 0 to 100, so it can function as a direction-neutral amplifier.
The result is a bi-directional composite oscillator that:
>> Emphasizes congruent signals (e.g., strong price direction with strong volume).
>> Minimizes misleading or incongruent signals from high volume paired with neutral or conflicting price movement.
Ideal for identifying high-conviction breakouts and momentum divergences with volume support.

Silver Bullet🎯 Silver Bullet Macro Time & Bias Framework
The Silver Bullet script is a complete framework for identifying high-probability trading windows and directional bias, inspired by ICT concepts.
✅ Key Features:
• Macro Sessions Detection – Automatically identifies key time windows (ICT Killzones or custom hours) on any timeframe.
• Dynamic Session Boxes – Visual boxes marking each session’s high/low range.
• Bias Calculation – Determines Long or Short bias using price action within the session.
• Fibonacci Levels – Automatically draws Fibonacci retracements and extensions relative to session ranges.
• Adaptive Labels & Tables – Clear labels showing session range, bias, entry, target, and stop levels.
• Customizable Timezones & Styles – Supports all chart timezones, different text sizes, and flexible display positions.
⸻
📈 Optimized for the 5-Minute Chart, but can be applied to other intraday timeframes.
🌐 Learn more & contact support: www.macrobullet.trade

DAX Setup ScreenerPine Script – Setup Screener
This code detects:
Range trading zone
Breakout long & breakdown short signals
With visual overlay
Use it like this:
Adjust rangeHigh, rangeLow, and breakoutBuffer
Enabled: Draws signals on the live chart

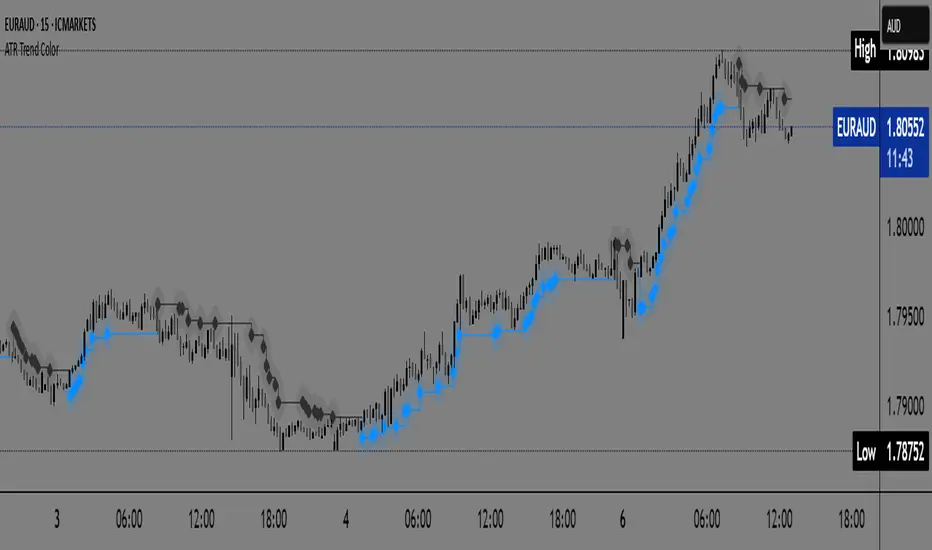
ATR Trend Color📌 ATR Trend Color — Visually clean trend-following tool based on adaptive ATR trailing stop
► Description
ATR Trend Color is a simple yet powerful indicator designed to visually identify and follow the market trend using an adaptive ATR-based trailing stop. Its main advantage lies in clarity — it uses just a single line that dynamically changes color based on trend direction:
✅ Blue line indicates price is above the trailing stop (bullish trend).
🔻 Black line indicates price is below the trailing stop (bearish trend).
This clean display allows for instant trend recognition and potential exit or reversal zones.
► How it works
The indicator uses the Average True Range (ATR) to calculate a dynamic trailing stop level. ATR measures volatility and adjusts the trailing line to match current market conditions:
When the price rises, the line moves up and acts as dynamic support.
When the price drops, the line moves down and acts as resistance.
This behavior makes it ideal for trend following and volatility-adjusted stop-loss placement.
► Key Features:
✅ Clean chart with just one ATR trailing line
✅ Dynamic color changes in real-time
✅ Great for trend confirmation and management
✅ Customizable ATR period and multiplier
✅ Step line with diamonds for high visual clarity
► How to use
Add the indicator to your chart.
Adjust ATR period and multiplier to your strategy (default: ATR 7 / multiplier 3.1).
Follow the line color:
Blue: Bullish trend — may signal to stay in long positions.
Black: Bearish trend — may suggest exit or short entries.
► Originality
Unlike typical ATR trailing stop indicators that display two lines or static colors, ATR Trend Color simplifies visualization by using a single smart line with real-time visual feedback on trend direction.
Additionally, it uses the “Step line with diamonds” display mode to enhance readability in fast or noisy markets.
Smart RSI Divergence PRO | Auto Lines + Alerts
**Smart RSI Divergence PRO**
This indicator automatically finds RSI divergences on price charts:
🔹 Regular & Hidden divergences
🔹 Auto trendlines connecting swing highs & lows
🔹 Clear triangle labels on the chart
🔹 Ready-to-use alerts for your strategy
Use it to spot potential trend reversals and hidden continuation signals.
---
**How it works**
- **Regular Divergence**: Price makes a higher high (or lower low) while RSI does not → possible reversal.
- **Hidden Divergence**: Price makes a lower high (or higher low) while RSI makes a higher high (or lower low) → possible trend continuation.
---
**Signal colors**
🔻 Red triangle — Regular Bearish Divergence (potential short)
🔻 Orange triangle — Hidden Bearish Divergence (possible trend continuation down)
🔺 Green triangle — Regular Bullish Divergence (potential long)
🔺 Blue triangle — Hidden Bullish Divergence (possible trend continuation up)
Works on any timeframe and market (crypto, forex, indices, stocks).
---
**💡 Want a custom version?**
I can build private Pine Script indicators & strategies **made just for you** — scalping tools, trend or reversal signals, custom filters for crypto, forex, stocks, or any pairs you trade.
I can also improve or fix your existing scripts.
If you want a unique, clean, and profitable setup — contact me anytime!
📩 Telegram 👉 t.me

YAS GROUPThis script is a powerful combination of Order Blocks (OB), market structure, and liquidity levels. It helps traders easily identify high-probability areas for entries and exits, detect trend shifts (BOS & CHoCH), and highlight strong support/resistance zones. The script is designed for both scalping and swing trading, offering flexibility and precision. Users can adjust OB sensitivity, show or hide structure labels, and customize visual settings to match their style. Alerts are also included for key signals. Perfect for traders looking to read the market like smart money.

YAS V1Use on chart
6
80
This advanced "All-in-One" indicator combines the most powerful smart money concepts (SMC), order blocks (OB), fair value gaps (FVG), support & resistance (SR), and liquidity voids, along with entry signals based on EMA and RSI filters.
💡 Key Features:
✅ Order Blocks (OB):
Highlights potential bullish and bearish order blocks to identify strong institutional zones where price might reverse.
✅ Fair Value Gaps (FVG):
Marks price gaps that indicate imbalance and possible zones for retracement or continuation.
✅ Support & Resistance (SR):
Automatically plots dynamic support and resistance levels using pivots, helping you to spot key reaction areas.
✅ Liquidity Voids:
Visualizes potential liquidity gaps or low-volume areas that can act as price magnets.
✅ Buy & Sell Signals:
Generates dynamic BUY and SELL signals based on a combination of EMA trend filters and RSI overbought/oversold levels.
✅ Fully Configurable:
Choose which features to display (OB, FVG, SR, Liquidity Voids, signals).
Adjust EMA and RSI settings to match your strategy.
Control the number of signals (reduce or increase) using a signal sensitivity filter.
⚙️ How it Works:
Trend Filter (EMA):
Price above EMA confirms a bullish environment, below EMA confirms bearish.
RSI Filter:
Signals are validated with RSI to avoid overtrading in ranging markets.
Zones & Gaps:
Institutional concepts (order blocks, gaps) help traders understand supply/demand and price inefficiencies.
🎯 Usage:
Perfect for:
Scalpers looking for intraday turning points.
Swing traders spotting high-probability levels.
Anyone interested in smart money concepts.
🚨 Alerts:
Includes built-in alerts for both BUY and SELL signals so you can react instantly without watching the screen all the time.
💬 Note:
This is a beta version designed to be improved with community feedback. Use it as a guide, and always confirm signals with your own analysis and risk management.
🔥 Ready to take your trading to the next level? Add this indicator to your chart, customize the settings, and start seeing the market like smart money!

Adaptive Causal Wavelet Trend FilterThe Adaptive Causal Wavelet Trend Filter is a technical indicator implementing causal approximations of wavelet transform properties for better trend detection with adaptive volatility response.
The Adaptive Causal Wavelet Trend Filter (ACWTF) applies mathematical principles derived from wavelet analysis to financial time series, providing robust trend identification with minimal lag. Unlike conventional moving averages, it preserves significant price movements while filtering market noise through signal processing that i describe below.
I was inspired to build this indicator after reading " Wavelet-Based Trend Identification in Financial Time Series " by In, F., & Kim, S. 2013 and reading about Mexican Hat wavelet filters.
The ACWTF maintains optimal performance across varying market regimes without requiring parameter adjustments by adapting filter characteristics to current volatility conditions.
Mathematical Foundation
Inspired by the Mexican Hat wavelet (Ricker wavelet), this indicator implements causal approximations of wavelet filters optimized for real-time financial analysis. The multi-resolution approach identifies features at different scales and the adaptive component dynamically adjusts filtering characteristics based on local volatility measurements.
Key mathematical properties include:
Non-linear frequency response adaptation
Edge-preserving signal extraction
Scale-space analysis through dual filter implementation
Volatility-dependent coefficient adjustment, which I love
Filter Methods
Adaptive: Implements a volatility-weighted combination of multiple filter types to optimize the time-frequency resolution trade-off
Hull: Provides a causal approximation of wavelet edge detection properties with forward-projection characteristics
VWMA: Incorporates volume information into the filtering process for enhanced signal detection
EMA Cascade: Creates a multi-pole filter structure that approximates certain wavelet scaling properties
Suggestion: try all as they will provide slightly different signals. Try also different time-frames.
Practical Applications
Trend Direction Identification: Clear visual trend direction with reduced noise and lag
Regime Change Detection: Early identification of significant trend reversals
Market Condition Analysis: Integrated volatility metrics provide context for current market behavior
Multi-timeframe Confirmation: Alignment between primary and secondary filters offers additional confirmation
Entry/Exit Timing: Filter crossovers and trend changes provide potential trading signals
The comprehensive information panel provides:
Current filter method and trend state
Trend alignment between timeframes
Real-time volatility assessment
Price position relative to filter
Overall trading bias based on multiple factors
Implementation Notes
Log returns option provides improved statistical properties for financial time series
Primary and secondary filter lengths can be adjusted to optimize for specific instruments and timeframes
The indicator performs particularly well during trend transitions and regime changes
The indicator reduces the need for using additional indicators to check trend reversion

Gold_Bulls | TP1+TP2 + Trailing SL + Clean Entry//@version=5
indicator("Gold_Bulls | TP1+TP2 + Trailing SL + Clean Entry", overlay=true)
// === INPUTS ===
lookbackDays = input.int(4, "Lookback Days (5m candles)")
pivotLen = input.int(5, "Pivot Strength")
rr1 = input.float(1.0, "TP1 Risk:Reward")
rr2 = input.float(1.5, "TP2 Risk:Reward")
trailATRmult = input.float(1.2, "Trailing SL ATR Multiplier")
// === TIME FILTER ===
inLastDays = time > (timenow - lookbackDays * 24 * 60 * 60 * 1000)
// === PIVOT S/R ===
pivotHigh = ta.pivothigh(high, pivotLen, pivotLen)
pivotLow = ta.pivotlow(low, pivotLen, pivotLen)
resistance = not na(pivotHigh) and inLastDays ? pivotHigh : na
support = not na(pivotLow) and inLastDays ? pivotLow : na
plotshape(resistance, location=location.abovebar, style=shape.triangledown, color=color.purple, size=size.tiny)
plotshape(support, location=location.belowbar, style=shape.triangleup, color=color.blue, size=size.tiny)
// === TRACK LAST LEVEL ===
var float lastSupport = na
var float lastResistance = na
if not na(support)
lastSupport := support
if not na(resistance)
lastResistance := resistance
// === ATR for Trailing SL ===
atr = ta.atr(14)
// === VARIABLES ===
var float entryBuy = na
var float slBuy = na
var float tp1Buy = na
var float tp2Buy = na
var float trailBuy = na
var float entrySell = na
var float slSell = na
var float tp1Sell = na
var float tp2Sell = na
var float trailSell = na
// === CONDITIONAL ENTRY ===
buyCond = na(entryBuy) and close > lastResistance and ta.barssince(close > lastResistance) == 0
sellCond = na(entrySell) and close < lastSupport and ta.barssince(close < lastSupport) == 0
// === BUY ENTRY ===
if buyCond
entryBuy := close
slBuy := ta.lowest(low, 6)
risk = entryBuy - slBuy
tp1Buy := entryBuy + risk * rr1
tp2Buy := entryBuy + risk * rr2
trailBuy := entryBuy - atr * trailATRmult
if not na(entryBuy)
trailBuy := math.max(trailBuy, close - atr * trailATRmult)
if close < trailBuy or close > tp2Buy
entryBuy := na
slBuy := na
tp1Buy := na
tp2Buy := na
trailBuy := na
// === SELL ENTRY ===
if sellCond
entrySell := close
slSell := ta.lowest(low, 6) // as per your request
risk = entrySell - slSell
tp1Sell := entrySell - risk * rr1
tp2Sell := entrySell - risk * rr2
trailSell := entrySell + atr * trailATRmult
if not na(entrySell)
trailSell := math.min(trailSell, close + atr * trailATRmult)
if close > trailSell or close < tp2Sell
entrySell := na
slSell := na
tp1Sell := na
tp2Sell := na
trailSell := na
// === PLOTS ===
plotshape(buyCond, location=location.belowbar, style=shape.labelup, color=color.green, text="BUY")
plot(entryBuy, title="Buy Entry", color=color.green)
plot(slBuy, title="Buy SL", color=color.orange)
plot(tp1Buy, title="Buy TP1", color=color.lime)
plot(tp2Buy, title="Buy TP2", color=color.teal)
plot(trailBuy, title="Buy Trailing SL", color=color.yellow)
plotshape(sellCond, location=location.abovebar, style=shape.labeldown, color=color.red, text="SELL")
plot(entrySell, title="Sell Entry", color=color.red)
plot(slSell, title="Sell SL", color=color.orange)
plot(tp1Sell, title="Sell TP1", color=color.green)
plot(tp2Sell, title="Sell TP2", color=color.teal)
plot(trailSell, title="Sell Trailing SL", color=color.yellow)
// === ALERTS ===
alertcondition(buyCond, title="BUY Signal", message="📈 BUY Signal Triggered!")
alertcondition(sellCond, title="SELL Signal", message="📉 SELL Signal Triggered!")

YAS V1This advanced "All-in-One" indicator combines the most powerful smart money concepts (SMC), order blocks (OB), fair value gaps (FVG), support & resistance (SR), and liquidity voids, along with entry signals based on EMA and RSI filters.
💡 Key Features:
✅ Order Blocks (OB):
Highlights potential bullish and bearish order blocks to identify strong institutional zones where price might reverse.
✅ Fair Value Gaps (FVG):
Marks price gaps that indicate imbalance and possible zones for retracement or continuation.
✅ Support & Resistance (SR):
Automatically plots dynamic support and resistance levels using pivots, helping you to spot key reaction areas.
✅ Liquidity Voids:
Visualizes potential liquidity gaps or low-volume areas that can act as price magnets.
✅ Buy & Sell Signals:
Generates dynamic BUY and SELL signals based on a combination of EMA trend filters and RSI overbought/oversold levels.
✅ Fully Configurable:
Choose which features to display (OB, FVG, SR, Liquidity Voids, signals).
Adjust EMA and RSI settings to match your strategy.
Control the number of signals (reduce or increase) using a signal sensitivity filter.
⚙️ How it Works:
Trend Filter (EMA):
Price above EMA confirms a bullish environment, below EMA confirms bearish.
RSI Filter:
Signals are validated with RSI to avoid overtrading in ranging markets.
Zones & Gaps:
Institutional concepts (order blocks, gaps) help traders understand supply/demand and price inefficiencies.
🎯 Usage:
Perfect for:
Scalpers looking for intraday turning points.
Swing traders spotting high-probability levels.
Anyone interested in smart money concepts.
🚨 Alerts:
Includes built-in alerts for both BUY and SELL signals so you can react instantly without watching the screen all the time.
💬 Note:
This is a beta version designed to be improved with community feedback. Use it as a guide, and always confirm signals with your own analysis and risk management.
🔥 Ready to take your trading to the next level? Add this indicator to your chart, customize the settings, and start seeing the market like smart money!

CQ_MTF Target Price Lines [BITCOIN HOY]Introducing the “BITCOIN HOY” Price Action Indicator
A Practical Tool Inspired by Esteban Perez for Efficient Market Tracking
Welcome to everyone subscribed to the YouTube channel “BITCOIN HOY”! Today, we are excited to present a specialized indicator designed for traders and enthusiasts following the guidance and strategies of Esteban Perez. This indicator was created in direct response to Esteban’s suggestion—providing the community with a more organized, digital alternative to the traditional trading notebook.
Purpose and Inspiration
The foundation of this indicator rests on a simple yet powerful concept: making it easier to track weekly and daily price action updates, along with calculated support, resistance, and target levels across different time frames. By digitizing the process, you no longer need to write each level by hand—the indicator does the plotting for you, presenting a clear, organized view directly on your chart.
Key Features
• Manual Entry for Multi-Time Frame Targets: Enter your own calculated price targets for intraday (1H), short-term (4H), daily (1D), and weekly (1W) charts.
• Visual Price Labels: Each inputted target draws a corresponding line and price label, making it easy to visualize and reference directly on your trading platform.
• Central Operations Axis: For each time frame, you can specify the central axis of operations, reflecting strategic zones or pivotal price points as described in Esteban Perez’s methodology.
• Related Event Tracking: Document and associate key market events with their respective price zones, helping contextualize market movements and decisions.
• Intuitive Organization: Adheres to the structure and terminology familiar to followers of “BITCOIN HOY,” ensuring everyone can use it with confidence.
How to Use the Indicator
• Step 1: Calculate your desired price targets for each time frame (1H, 4H, 1D, 1W) using your preferred methods or following Esteban’s recommendations.
• Step 2: Enter the targets into the indicator input fields, separated by commas for multiple entries on the same time frame.
• Step 3: Input individual prices for weekly targets and for the central operations axis in the dedicated fields.
• Step 4: Optionally, annotate related events or notes corresponding to particular levels, giving further clarity to your analysis.
• Step 5: Observe your chart—the indicator will draw lines and labels, offering a visual roadmap for your trading decisions.
Benefits
• Saves Time: No more repetitive manual note-taking—everything is streamlined and visible in one place.
• Reduces Errors: Visual price labels help minimize mistakes that can occur with hand-written notes or misreads.
• Enhances Consistency: Maintains the disciplined, methodical approach advocated on the “BITCOIN HOY” channel.
• Supports Strategic Planning: Easily reference central axes and event annotations to make informed decisions.
Acknowledgments
This tool is made possible through the dedication and insight of Esteban Perez. His commitment to educating and empowering the “BITCOIN HOY” community has inspired many, and his willingness to share both his knowledge and his strategies continues to elevate everyone following his channel. Thank you, Esteban, for your hard work and generosity.

Relative Strength Suite [BLC]📊 Relative Strength Suite
A powerful, all-in-one relative strength toolkit for traders and analysts. Whether you're a trend follower, momentum trader, or sector rotator, this script gives you the flexibility to analyze and screen assets using three distinct RS methodologies—all in one clean interface.
🔍 What It Does
Flexible Relative Strength allows you to compare any asset to a benchmark (like SP:SPX , NASDAQ:QQQ , AMEX:IWM , etc.) using one of four modes:
📈 Relative Strength – Classic price ratio comparison
📘 Dorsey Relative Strength – Smoothed trend-based RS using EMA
📒 Mansfield Relative Strength – Momentum-based RS normalized to its own average
🧮 Screener Mode – Load Indicator into Pine Screener to see all 3 values.
🛠️ Key Features & Settings
🧩 Relative Strength
Comparison Symbol: Select the ticker you want to use as a benchmark.
Highlights new highs/lows in Relative Strength with dynamic line coloring:
🟢 Green = New high (outperformance)
🔴 Red = New low (underperformance)
Optional moving average overlay (SMA, EMA, WMA, HMA) for trend smoothing.
✅ Use Case: Identify when a stock is gaining strength relative to the market or sector.
📘 2. Dorsey RS (Smoothed Trend)
Uses an EMA of the RS ratio to smooth out noise.
Rising Dorsey RS = consistent outperformance.
Falling Dorsey RS = consistent underperformance.
✅ Use Case: Spot long-term relative trends regardless of price volatility.
📒 3. Mansfield RS (Performance Momentum)
Compares RS ratio to its own long-term SMA (default 200).
Values above 0 = outperforming the benchmark.
Values below 0 = underperforming.
✅ Use Case: Ideal for momentum traders and Stan Weinstein-style stage analysis.
🧮 4. Screener Mode
Not for use on your chart. This is only to use in TradingView's Pine Screener.
Displays all three RS lines simultaneously.
Includes all 3 modes to act as screener signals
🛠️How to Use Screener Mode
Add this indicator to your favorites list.
Open Pine Screener and select this indicator.
Select your timeframe.
Click Settings & Change Strength Type to Screener > Click Apply
Hit Scan!
New High Low Signal: Finds stocks making a new RS high (1) or low (-1) over your lookback period.
Dorsey Trend Signal: Finds stocks where the smoothed RS trend is rising (1) or falling (-1).
Mansfield Zone Signal: Finds stocks where momentum is in the positive zone (1) or negative zone (-1)
✅ Use Case: Quickly scan multiple assets for relative strength breakouts, trend shifts, or momentum zones.
🧪 Pro Tip
Combine this indicator with volume, price structure, or moving averages to confirm breakouts and trend strength. Use Screener Mode on a watchlist to identify top RS candidates in seconds.
To clean up your screener table, click the column settings icon ( ⋮ ) and uncheck any columns you don't need to see. You can still filter by them even if they are hidden.
📝 Credits & Notes
Inspired by classic RS methods (including Dorsey and Mansfield).
Final, production-ready version with tooltips, labels, and screener outputs.
For educational and informational purposes—always test before live trading!
Let me know if you see any bugs, miscalculations, or any features you'd like to see added to it!

3Commas DCA Long Short3Commas DCA Long/Short Manager – SuperTrend-Powered
This script turns TradingView SuperTrend signals into fully-automated 3Commas actions. On each confirmed bar-close trend flip it:
• Starts the chosen Long or Short DCA bot
• Closes & stops the opposite bot to keep only one side running
Key features
• SuperTrend core – ATR Length & Factor are user-tunable
• Dual-bot control – independent IDs for Long and Short bots, each can be toggled on/off
• Safety first – ignores the very first bar to avoid repaint artefacts
• Email/webhook ready – alerts output compact JSON compatible with 3Commas; optional delay seconds parameter included
• One-click deployment – drop on any chart, set an “Any alert() function call” alert, paste your 3Commas email address / webhook, and trade hands-free.
Back-test thoroughly and use paper trading before going live. Happy automating!

AV BTC Pi Cycle Top (with ATH) OverlayPi Cycle Top Indicator
Created by Phillip Swift . It works by comparing the 111-day SMA (blue) and the 350-day SMA. The value of the 350-day SMA is multiplied by 2 and referred to as 2*350 SMA (purple). Note: The number of days is not multiplied; the 350-day SMA is not doubled to calculate a 700-day SMA.
These two moving averages were selected because 350 / 111 ≈ 3.153, an approximation of the number Pi.
When the 111-day SMA (blue) crosses over the 2*350 SMA (purple), it signals a market cycle peak. Historically, this has worked extremely well. However, with the growth of BTC Futures and ETFs, this indicator might lose its edge.
A label and a red circle signal crossover. The indicator also marks all ATH (All-Time High) bars with yellow diamonds. The ATH line is hidden by default but can be enabled in the style tab. Additionally, halving days are marked with grey vertical lines and labels. Feel free to hide certain elements in the style tab.
For marking overbought and oversold areas, I believe looking at the Pi Cycle Oscillator is a better choice. For this reason, this indicator does not highlight overbought or oversold areas; it only marks market tops.

Convergence [by Oberlunar]
The Convergence Indicator by Oberlunar is a multi-timeframe analysis tool that identifies and visualizes trend convergence across up to 10 configurable timeframes using advanced customizable moving averages, including Hull, OberX (a Hull mod), THMA, EMA, and SMA, with an optional pseudo-Hilbert Transform.
It provides a clear visual overlay through gradual fill areas that highlight bullish and bearish trends while offering a fully configurable dynamic table to monitor live trend states across all selected timeframes with user-defined colors and positioning.
This tool is designed for traders who seek to pinpoint multi-timeframe convergence points to enhance their decision-making process in trend-following and breakout strategies.
Oberlunar 👁️⭐

Micro Trend Start Signal (Up & Down)To compliment fast trends in the market, this strategy should be tried and tested on the 1 minute strategy. The 2nd alerts work also very well.

Objective Congestion Zones (Price Density)Automatically calculates congestion zones on multiple timezones and can be modified to add more zones

YAS V1This advanced "All-in-One" indicator combines the most powerful smart money concepts (SMC), order blocks (OB), fair value gaps (FVG), support & resistance (SR), and liquidity voids, along with entry signals based on EMA and RSI filters.
💡 Key Features:
✅ Order Blocks (OB):
Highlights potential bullish and bearish order blocks to identify strong institutional zones where price might reverse.
✅ Fair Value Gaps (FVG):
Marks price gaps that indicate imbalance and possible zones for retracement or continuation.
✅ Support & Resistance (SR):
Automatically plots dynamic support and resistance levels using pivots, helping you to spot key reaction areas.
✅ Liquidity Voids:
Visualizes potential liquidity gaps or low-volume areas that can act as price magnets.
✅ Buy & Sell Signals:
Generates dynamic BUY and SELL signals based on a combination of EMA trend filters and RSI overbought/oversold levels.
✅ Fully Configurable:
Choose which features to display (OB, FVG, SR, Liquidity Voids, signals).
Adjust EMA and RSI settings to match your strategy.
Control the number of signals (reduce or increase) using a signal sensitivity filter.
⚙️ How it Works:
Trend Filter (EMA):
Price above EMA confirms a bullish environment, below EMA confirms bearish.
RSI Filter:
Signals are validated with RSI to avoid overtrading in ranging markets.
Zones & Gaps:
Institutional concepts (order blocks, gaps) help traders understand supply/demand and price inefficiencies.
🎯 Usage:
Perfect for:
Scalpers looking for intraday turning points.
Swing traders spotting high-probability levels.
Anyone interested in smart money concepts.
🚨 Alerts:
Includes built-in alerts for both BUY and SELL signals so you can react instantly without watching the screen all the time.
💬 Note:
This is a beta version designed to be improved with community feedback. Use it as a guide, and always confirm signals with your own analysis and risk management.
🔥 Ready to take your trading to the next level? Add this indicator to your chart, customize the settings, and start seeing the market like smart money!
