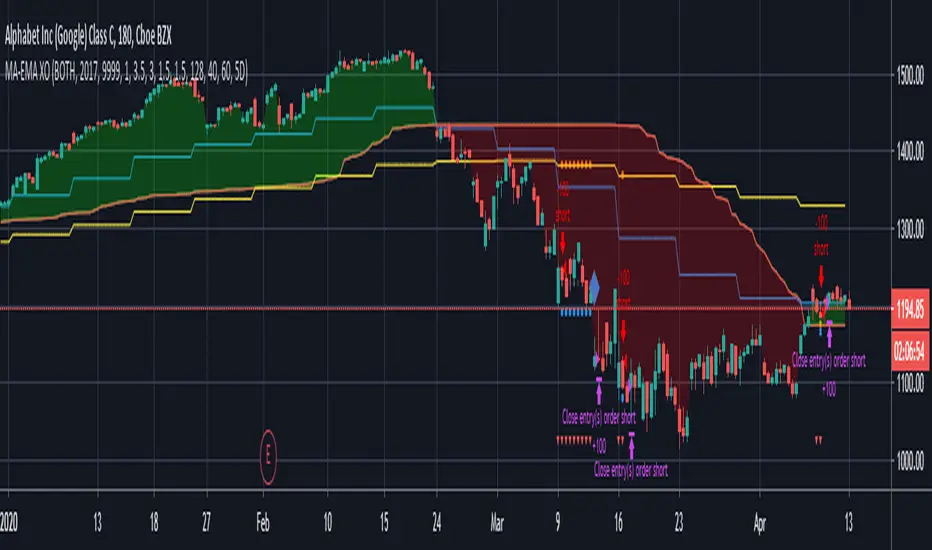
BlueFX Strategy GOLD M15We are releasing this separate script file for trading Gold on the M15 time frame using our strategy. This can now run independently from the main file instead of changing parameters and saving as a template - thus making the use of these specific settings even easier for our traders.
You can see the back testing profitability shown below, although you can not use back testing to predict the future, both the volume of trades, net profit, win rate and draw down demonstrate a solid foundation and data to move forward from.
The strategy itself is explained in the 'Blue FX Strategy' but see below too for more info.
Our strategy will help you identify the current trend in the markets and highlight when this is changing. The strategy itself is based upon 4 indicators lining up in total confluence to increase the probability of the trade being a success.
Absolutely no technical analysis is needed to trade this - this is a trading tool and has solid back testing results trading in isolation - although you may also use to support your own trading - the choice is yours.
When a trade is valid - a Buy or Sell label will appear with the Entry price, SL and multiple TP's shown on the chart.
IMPORTANT note, the test results show and confirm that the most profitable exit strategy with these Gold settings is 'FT&SL' this means we enter the trade with a Stop Loss (SL) and simply hold and follow the trend (Follow Trend = FT) until a reverse signal is printed.
In our supporting video (see related ideas) you can see the impact of changing this target between multiple TP's and the net effect on both win rate and overall net profitability.
The Lot size will also be displayed and this is based on the risk parameters you have set personally in the calculation section.
What is a Trading View Script?
A script is like an indicator but better, we can verify the success of our strategy by using Trading Views strategy tester function. As shown below and on the chart - you can see the 'Buy' and 'Close Buy' on the chart, supported by a live trading log showing you the entry, entry price date, volume and closing price.
This is a great function for numerous reasons; firstly, you know you are using a strategy that has provided a positive expectancy in back testing, secondly you can use this as a trading journal to support your trading too. This in itself can help you with your trading psychology - letting winning trades run is a prime example of this. Take confidence in the statistics and performance over time.
Ultimately, we believe we have saved YOU the need to firstly, find an edge and a strategy - and all of the time it takes to BACKTEST a strategy - to then find it may or may not work - and then you start again!
Disclaimer alert; Please remember past performance is exactly that - how our strategy performed over those dates tested, it is not obviously a guarantee of future performance.
Interested in access or more information?
No problem, simply drop us a DM via trading view for access information.
Thank you for reading.
Darren
Trend

M4x Rainbow V4i strat LINK-USDTGRID & TREND Multiplier Experiment
// "M4x Rainbow" is a Strategy Grid Trend Multiplier bot, who is following the trend.
// I built it as an experimental tool with Strategy implemented, even if that numbers are far out...!
// Because.....it not only depends on the bot setup, the timings of the TradingBot (eg.3Commas) are very relevant too!
// Like amount of Trades, Security Orders, Deviation and so on...
// Please feedback your experience with a Comment , as I would like to improve this bot.
// Updates will follow ;-)
//
// "M4x Rainbow" is not bound on FIFO, each trade get's his own exit.
// It is set for Pyramiding, which can be changed in the "Strategy" line
// Fees are set equal to Binance numbers at 0.1%, about...
// The coloring of the lines is:
//
// green = linestate is LONG
// blue = linestate is WAIT
// yellow = linestate is SHORT
//
// Give it a try and let me know.
//
// ...have fun ;-)

Grid System With Fake MartingaleThe proposed strategy is based on a grid system with a money management that tries to replicate the effect of a martingale without having to double your position size after each loss, hence the name "fake martingale". Note that a balance using this strategy is still subject to exponential decay, the risk is not minimized, as such, it would be dangerous to use this strategy.
For more information on the martingale and grid systems see:
Strategy Settings
Point determines the "grid" size and should be adjusted accordingly to the scale of the security you are applying the strategy to. Higher value would require larger price movements in order to trigger a trade, generating fewer trades as a result.
The order size determines the number of contracts/shares to purchase.
The martingale multiplier determines the factor by which the position size is multiplied after a loss, using values higher to 2 will "squarify" your balance, while a value of 1 would use a constant position sizing.
Finally, the anti-martingale parameter determines whether the strategy uses a reverse martingale or not, if set to true then the position size is multiplied after each win.
How It Works
Let's illustrate how we replicate a martingale without doubling our exposure with a simple casino example. Imagine you are playing roulette, and that you are betting on colors (black/red), your payout is 1 to 1, in the case you win, you will have your initial stake back plus a profit equal to your initial stake.
If your strategy is to recover any previous losses, you can double your stake each time you lose, once you win you will get back the previous losses plus a profit equal to your original stake, this is the martingale system. So how can we win back previous losses without having to double our stake? We could do that by doubling the payout ratio after a loss, so after a loss, we must use a payout ratio of 2:1, if we lose once again we must use a payout of 4:1...etc, our payout ratio would be subject to exponential growth instead of our stake.
Of course, the payout ratio is fixed with casino games, but in trading, we can manipulate the position of our take profit in order to replicate such effect, this is what this strategy is doing. So after a loss, we place our take profit such that a win recover our losses back plus generate a profit.
Advantages
The advantage of this approach is that unlike the martingale we don't double our position size, which instead can remain constant, this is a huge advantage as a martingale will require a significant capital in order to tank a series of losses.
Disadvantages
The main disadvantage of this method is that the price might never reach our take profit after a long losing streak, our balance would remain in the red and we couldn't do anything about it except reset the strategy.
Frictional costs are still a disadvantage, as such, we would need to place our take profits in order to account for them, while this is still better than purchasing additional shares, it minimizes the chances of the price reaching the take profit.
Conclusions
An alternative money management system replicating the effect of a martingale as been presented, we can see that such a system is far from being perfect, and it would be foolish to use it, however, it stills offer a convenient alternative to less aggressive progressive position sizing systems.
I have been receiving some messages from users criticizing me for exposing the martingale money management system, and I understand why but I can't agree, talking about it allow me to warn users against it, the grid-martingale methodology is will create more harm than anything else, the reward is only one side of the story and should always be compared against the risk, so always take a look at all the statics in a backtest.
Thanks for reading!
Shout-Out
This post was made possible thanks to my patrons:
@Happymono, @AmariMars, @kkhaial, @Nugehe, @LucF, @Nosmok, @iflostio, @DankBeans, @ecletv, @Neverstorm, @alex.crown.jr, @uk503, @xkingshotss, @vsov, @jbelka, @yatrader2, @hughza, @ganh

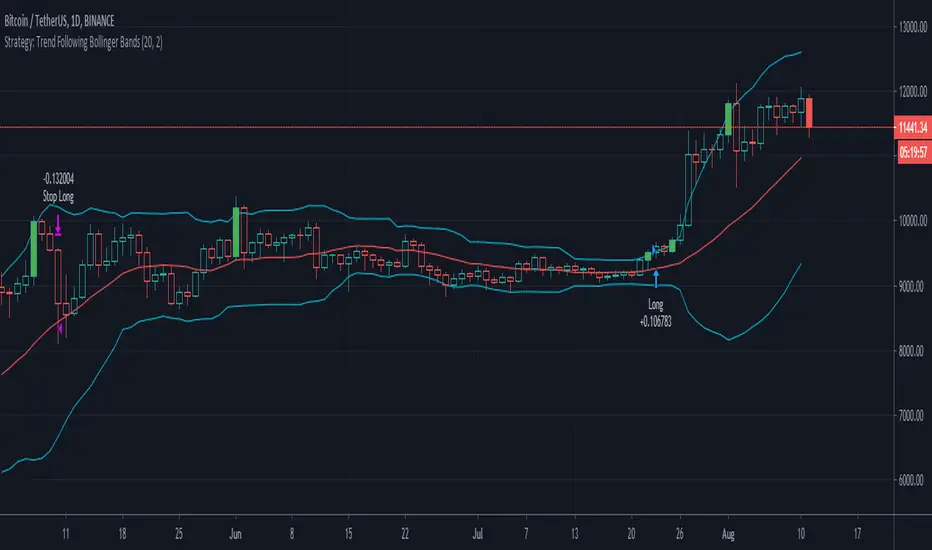
Setup Trend Following Bollinger Bands - ValenteBuy when the candle closes above upper BB
Sell when the candle closes bellow lower BB
Stop always on base line
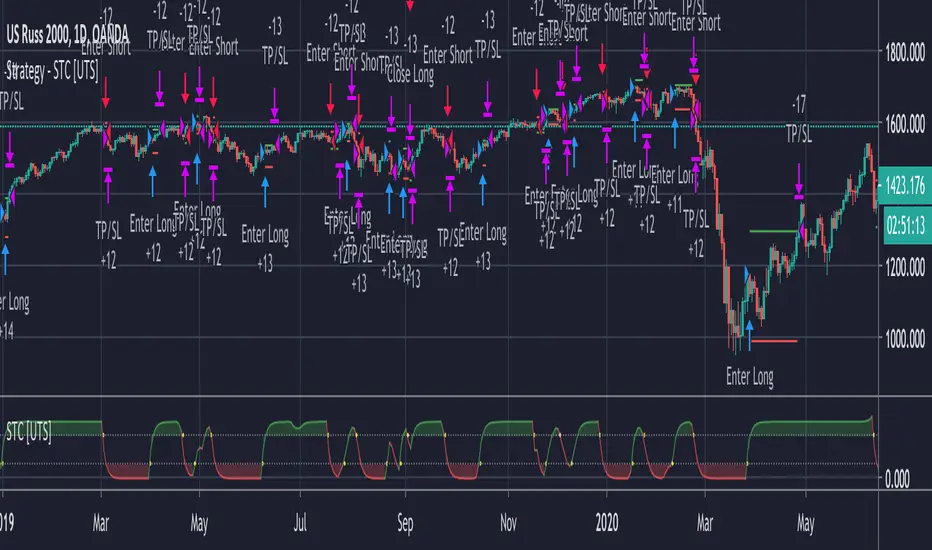
Strategy - Uber STC - Schaff Trend Cycle [UTS]Backtesting of Uber STC - Schaff Trend Cycle
Backtest with focus win/loss profitability.
Formula: profitability = win / (win+loss)
Default equity 100k USD
Default 2% Risk per trade
Default currency USD
Define backtest interval precisely by month, year, day
LONG and SHORT positions
Visualize SL and TP on chart
ATR (len: 14, smooth: SMA)
ATR based Stop-Loss, if hit trade will be closed and considered as loss
ATR based Take-Profit, if hit trade will be closed and considered as win
On TP or SL hit the trade is closed and marked as win/loss
TREND +SIDEWAYS OPTIMIZED algo signalsThis indicator will try to capture maximum trend of a stock
it will keep trailing stoploss to capture maximum trend
Works best in trendy markets
FEATURES:
Done and backtested on indian stocks.
Trade session and exit session can be specified as inputs.
Optional Stoploss
Specially developed for intraday trading
It would be good to use on normal candlesticks and time frame between (3 to 15 min)
INPUTS:
TRADE FREQUENCY: it can be an integer from from 1 to 5 , Frequency denotes the trading frequency,
low frequency will take less number of trades and will have HIGHER risk rewads (to use lowest frequency 1 )
High freqency it will take more trades and with less profits good for scalpers , it will have low risk and low reward)
Frequency requirement can be given between 1 to 5 , 1 is the lowest and 5 is the Highest frequency
Sideways Bias:
This is an extra filter to reduce the loss in sideways movement,
Your sideways bias can be given between 0 to 3
0 if No bias on sideways
3 if biased on sideways
Reduce the risk filter:
This would try to bok profit quickly and begginers can use this
Optional stoploss:
you can define your risk in points
Trade Quantity:This is quantity you want to trade on particular day, it is used to plot buy or sell quantity on chart (quantity is not taken into consideration in backtest)
Trade session: Session for entries can be specified
Exit session: session for exit can be specified
Custom Bactesting:
This is to provide backtesting results of a stock in given range of dates

Combo Backtest 123 Reversal & Extracting The Trend This is combo strategies for get a cumulative signal.
First strategy
This System was created from the Book "How I Tripled My Money In The
Futures Market" by Ulf Jensen, Page 183. This is reverse type of strategies.
The strategy buys at market, if close price is higher than the previous close
during 2 days and the meaning of 9-days Stochastic Slow Oscillator is lower than 50.
The strategy sells at market, if close price is lower than the previous close price
during 2 days and the meaning of 9-days Stochastic Fast Oscillator is higher than 50.
Second strategy
Extracting The Trend
The related article is copyrighted material from Stocks & Commodities Mar 2010
WARNING:
- For purpose educate only
- This script to change bars colors.

Grid Like StrategyIt is possible to use progressive position sizing in order to recover from past losses, a well-known position sizing system being the "martingale", which consists of doubling your position size after a loss, this allows you to recover any previous losses in a losing streak + winning an extra. This system has seen a lot of attention from the trading community (mostly from beginners), and many strategies have been designed around the martingale, one of them being "grid trading strategies".
While such strategies often shows promising results on paper, they are often subjects to many frictions during live trading that makes them totally unusable and dangerous to the trader. The motivations behind posting such a strategy isn't to glorify such systems, but rather to present the problems behind them, many users come to me with their ideas and glorious ways to make money, sometimes they present strategies using the martingale, and it is important to present the flaws of this methodology rather than blindly saying "you shouldn't use it".
Strategy Settings
Point determines the "grid" size and should be adjusted accordingly to the scale of the symbol you are applying the strategy to. Higher value would require larger price movements in order to trigger a trade, as such higher values will generate fewer trades.
The order size determines the number of contracts/shares to purchase.
The martingale multiplier determines the factor by which the position size is multiplied after a loss, using values higher to 2 will "squarify" your balance, while a value of 1 would use a constant position sizing.
Finally, the anti-martingale parameter determines whether the strategy uses a reverse martingale or not, if set to true then the position size is multiplied after any wins.
The Grid
Grid strategies are commons and do not present huge problems until we use certain position sizing methods such as the martingale. A martingale is extremely sensitive to any kind of friction (frictional costs, slippage...etc), the grid strategy aims to provide a stable and simple environment where a martingale might possibly behave well.
The goal of a simple grid strategy is to go long once the price crossover a certain level, a take profit is set at the level above the current one and stop loss is placed at the level below the current one, in a winning scenario the price reach the take profit, the position is closed and a new one is opened with the same setup. In a losing scenario, the price reaches the stop loss level, the position is closed and a short one is opened, the take profit is set at the level below the current one, and a stop loss is set at the level above the current one. Note that all levels are equally spaced.
It follows from this strategy that wins and losses should be constant over time, as such our balance would evolve in a linear fashion. This is a great setup for a martingale, as we are theoretically assured to recover all the looses in a losing streak.
Martingale - Exponential Decays - Risk/Reward
By using a martingale we double our position size (exposure) each time we lose a trade, if we look at our balance when using a martingale we see significant drawdowns, with our balance peaking down significantly. The martingale sequence is subject to exponential growth, as such using a martingale makes our balance exposed to exponential decays, that's really bad, we could basically lose all the initially invested capital in a short amount of time, it follows from this that the theoretical success of a martingale is determined by what is the maximum losing streak you can endure
Now consider how a martingale affects our risk-reward ratio, assuming unity position sizing our martingale sequence can be described by 2^(x-1) , using this formula we would get the amount of shares/contracts we need to purchase at the x trade of a losing streak, we would need to purchase 256 contracts in order to recover from a losing streak of size 9, this is enormous when you take into account that your wins are way smaller, the risk-reward ratio is totally unfair.
Of course, some users might think that a losing streak of size 9 is pretty unlikely, if the probability of winning and losing are both equal to 0.5, then the probability of 9 consecutive losses is equal to 0.5^9 , there are approximately 0.2% of chance of having such large losing streak, note however that under a ranging market such case scenario could happen, but we will see later that the length of a losing streak is not the only problem.
Other Problems
Having a capital large enough to tank 9any number of consecutive losses is not the only thing one should focus on, as we have to take into account market prices and trading dynamics, that's where the ugly part start.
Our first problem is frictional costs, one example being the spread, but this is a common problem for any strategy, however here a martingale is extra sensitive to it, if the strategy does not account for it then we will still double our positions costs but we might not recover all the losses of a losing streak, instead we would be recovering only a proportion of it, under such scenario you would be certain to lose over time.
Another problem are gaps, market price might open under a stop-loss without triggering it, and this is a big no-no.
Equity of the strategy on AMD, in a desired scenario the equity at the second arrow should have been at a higher position than the equity at the first arrow.
In order for the strategy to be more effective, we would need to trade a market that does not close, such as the cryptocurrency market. Finally, we might be affected by slippage, altho only extreme values might drastically affect our balance.
The Anti Martingale
The strategy lets you use an anti-martingale, which double the position size after a win instead of a loss, the goal here is not to recover from a losing strike but instead to profit from a potential winning streak.
Here we are exposing your balance to exponential gross but you might also lose a trade at the end a winning streak, you will generally want to reinitialize your position size after a few wins instead of waiting for the end of a streak.
Alternative
You can use other-kind of progressions for position sizing, such as a linear one, increasing your position size by a constant number each time you lose. More gentle progressions will recover a proportion of your losses in a losing streak.
You can also simulate the effect of a martingale without doubling your position size by doubling your target profit, if for example you have a 10$ profit-target/stop-loss and lose a trade, you can use a 20$ profit target to recover from the lost trade + gain a profit of 10$. While this approach does not introduce exponential decay in your balance, you are betting on the market reaching your take profits, considering the fact that you are doubling their size you are expecting market volatility to increase drastically over time, as such this approach would not be extremely effective for high losing streak.
Conclusion
You will see a lot of auto-trading strategies that are based on a grid approach, they might even use a martingale. While the backtests will look appealing, you should think twice before using such kind of strategy, remember that frictional costs will be a huge challenge for the strategy, and that it assumes that the trader has an important initial capital. We have also seen that the risk/reward ratio is theoretically the worst you can have on a strategy, having a low reward and a high risk. This does not mean that progressive position sizing is bad, but it should not be pushed to the extreme.
It is nice to note that the martingale is originally a betting system designed for casino games, which unlike trading are not subject to frictional costs, but even casino players don't use it, so why would you?
Thx for reading

Optimized Trend Tracker - Strategy VersionA brand new indicator from the developer of MOST (Moving Stop Loss) indicator Anıl Özekşi.
Optimized Trend Tracker OTT is an indicator that provides traders to find an existing trend or in another words to ser which side of the current trend we are on.
The original indicator was coded and published by Kıvanç Özbilgiç. You can access it from this link:
I transformed the indicator into a strategy and made some changes:
- You can run two different strategies. In the Settings section, you can test two different strategies, "Support Line Crossing Signals" and "Price / OTT Crossing Signals".
- Fixed the issue where BUY/SELL labels from the indicator script would hang in the air.
- I added a setting where you can hide BUY/SELL labels if you want.
- I painted the bars for BUY/SELL states, you can open and close in the settings section.
- As I do with every strategy script, I added a start and end date for the strategy test. You can specify the range you want to see working in the Settings section.
In addition, there were cases when the OTT line was reduced to zero in non-voluminous symbols; I changed this situation by making a small change in the code. I asked Kıvanç about the subject, I can update according to his answer.
Note : Strategy BUY / SELL tags and indicator BUY / SELL tags do not operate in the same bar because indicator tags are added when the next bar occurs. If you replay bars, you can observe label formations.
TÜRKÇE AÇIKLAMA
Orjinal indikatör Kıvanç Özbilgiç tarafından kodlanmış ve yayımlanmıştır. Bu linkten erişebilirsiniz:
İndikatörü strateji dönüştürdüm ve bazı değişiklikler yaptım:
- İki farklı strateji çalıştırabilirsiniz. Ayarlar kısmında Condition bölümünde "Support Line Crossing Signals" ve "Price/OTT Crossing Signals" olarak iki farklı stratejiyi test edebilirsiniz.
- İndikatör scriptinden gelen BUY/SELL etiketlerinin havada durması sorununu düzelttim.
- İsterseniz BUY/SELL etiketleri gizleyebileceğiniz bir ayar ekledim.
- BUY/SELL durumları için barları boyadım, ayarlar bölümünden açıp kapatabilirsiniz.
- Her strateji scriptinde yaptığım gibi, strateji testi için başlangıç ve bitiş tarihi ekledim. Ayarlar bölümünden çalışmasını görmek istediğiniz aralığı belirleyebilirsiniz.
- Ek olarak hacimsiz sembollerde OTT çizgisinin sıfıra indiği durumlar mevcuttu; kodda ufak bir değişiklik yaparak bu durumu değiştirdim. Kıvanç Bey'e konu ile ilgili soru sordum, cevabına göre güncelleme yapabilirim.
Not : Strateji BUY/SELL etiketleri ile indikatör BUY/SELL etiketleri aynı barda işlem yapmamaktadır çünkü indikatör etiketleri kendisinden sonraki bar oluşunca eklenmektedir. Barları replay yaptırırsanız oluşumlarını gözlemleyebilirsiniz.

Strategy Smart Forex Buy Sell Signal by LukasHi, I just convert my Smart Forex Buy Sell Signal into strategy.
BUY and SELL signal base on Price action, RSI , and Correlation between Forex Major Pairs.
It's only work for Forex Major Pairs because I only took their data.
Included alert : Spec, Buy, Strong
Recommended to wait for double signal :
Spec Buy > Buy or Spec Sell > Sell
Buy > Strong Buy or Sell > Strong Sell
So execute after the second signal triggered.
On this strategy I exclude Spec Sell/Buy on strategy test.
I use simple Profit/Loss 200/100 and 5 pyramid, you can play around with the setting.
And to improve the odds, simply use my Currency Strength Indicator to pick what pairs to trade. Choose Strong Vs. Weakness to get maximal profit. It help me to stay away from ranging pairs.
Any feedback are welcome :)

EMA Slope Cross Trend Follower StrategyThis strategy uses the cross of the slopes of two EMAs having different lengths to generate trend follower signals. By default, I use 130 and 400, which behave very well.
The conditions which make the strat enter the market are:
- Fast Slope > Slow Slope and price > EMA 200 : go Long
- Fast Slope < Slow Slope and price < EMA200 : go Short
The simple slopes cross in the opposite direction, closes the position.
The strategy performs best on Bitcoin and the most liquid and capitalized Altcoins, but works greatly on volatile assets as well, in particular if they often go trending.
Works best on 4h time frame.
There's also an optional Volatility filter, which opens the position only if the difference between the two slopes is more than a specific value, which can be set in the strategy inputs. The purpose is not opening positions if price is going sideways and the noise is way > than the signal.
Enjoy it!

[HTI2] Hiubris Trend Indicator 2 StrategyThis is the Strategy version of the HTI2 Indicator
After testing several strategies for months and comparing them to the standard 'Buy and Hold' method, we've found the best performing strategy for BTCUSDT
We simplified it to make it more user-friendly (We've only added 1 optional exit: a % SL) and left all the inputs adjustable, so it can be optimized for ANY pair!
This is a Trend Indicator! This means that the '% Profitable Trades' is not the main focus, but catching every trend swing. When trying to catch every trend swing, naturally alot of the them might be unprofitable, especially in sideways markets. The idea behind this strategy is to catch all the significant trend movements, which are alot more profitable than all the 'sideway market' losses
For that reason, we recomment backtesting on Timeframes greater than 15min. Initially we suggest you backtest without a Stop-Loss, trying multiple combinations of the 2 inputs (Length 9 to 32 / Multiplier 2 to 12)
After you found a profitable enough combination, you should look at the 'Average Losing Trade' and the 'Largest Losing Trade', then try further improving the results by setting up a Stop-Loss accordingly (if needed)
In our case, we've found that having a 2% SL (on BTCUSDT) really helps alot with those sideways market trend swings. This also allows us to comfortably us a 10x leverage
*** When using the Re-Entry feature, make sure to change the order size to contracts! Do not leave is as '% of Account' !!! ***
Some of our backtesting results
BTCUSDT 30-5 30min, 2% SL vs 'Buy and Hold'
2019 - present 697.42% vs 250%
2018 - 2019 119.42% vs -75%
EURUSD 18-6 30min, 0.6% SL
2019 - present 12.4%
AMZN 13-2 30min, 2% SL
2019- present 279.44%
XAUUSD 18-3 30min, 1.75% SL
2019- present 53.43%
BA 20-6 30min, 1.5% SL
2019- present 251.35%

cATRpillar Strategy**This is my first strategy on the Pine editor, any tips or tricks from the community would be awesome!
This strategy was developed from my indicator "cATRpillar". it uses the ATR range values to determine entry, and uses EMA values to determine an exit if the market goes against it.

EMA Slope Trend Follower StrategyThis strategy is based on the slope of the EMA130.
Over that slope, the script calculates two EMAs (9,21) which are used to generate the main entry and exit signal.
In particular, the strategy enters a LONG position when EMA9 > EMA21. On the contrary, it closes the LONG and opens a SHORT when EMA9 < EMA21.
When the slope of the EMA130 is rising, it means that the price is accelerating upwards, fueling an uptrend. Conversely, when the slope is falling, it means that the price is slowing down, falling into a possible downtrend.
Calculating and analyzing two EMAs (fast and slow) over the slope of a medium length EMA instead of the price anticipates a lot the signal. In this way, the strategy never miss a trend.
In order to minimize false positives (entering useless positions), I included two filters, which can be optionally turned on:
- Trend Filter: When the price is above EMA200, the strategy opens ONLY LONG positions. If price < EMA200, only shorts allowed. If the slope gives a long signal and price is below EMA200, for example, the eventual SHORT position is closed, but the LONG entry is postponed to the moment when both conditions (slope uptrending and price > ema200) are met.
I recommend always turning on this filter, as it dramatically decreases drawdown.
- Volatility Filter: When the standard deviation of the last 20 candles is below its 50 samples moving average, no positions are opened, as market is going sideways. The purpose of this filter is to prevent false positives (positions which open and close in a matter of candles due to false signals in sideways market).
I recommend turning on this filter only on low time frames.
This strategy works great on medium time frames (like 4h, 6h, daily), since it spends way less in fees, opening less positions.
It works good on low TFs too (up to 1h, didn't test lower ones), provided Volatility filter is turned on and parameters are set according to the asset.
Commission included in calculations: 0.06% (it's the taker commission on BitMEX with the 10% discount obtainable with any referral link)
Slippage included in calculations: 2 ticks (BitMEX has very liquid order books, and slippage doesn't happen very often unless a huge position size is used).

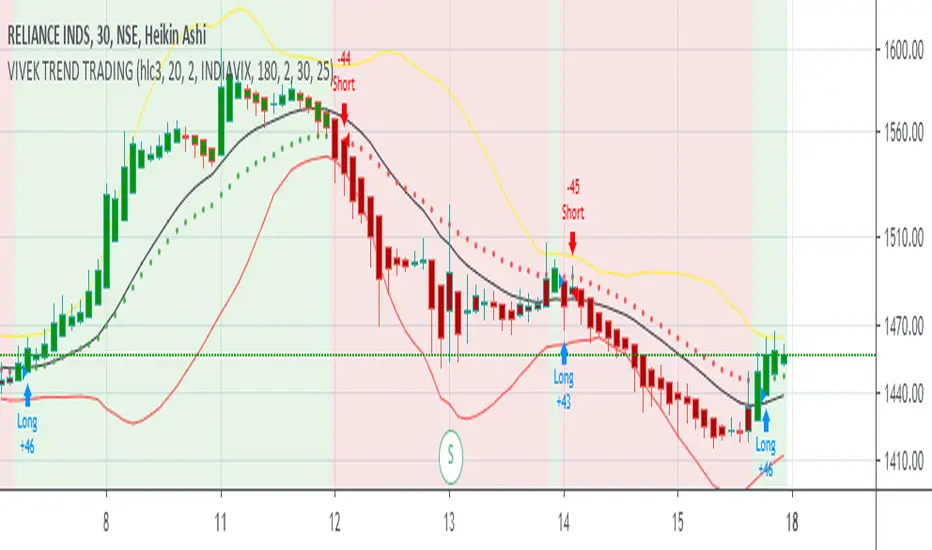
[VBOSE]Astra Trend Trading (Nifty,Crude,Reliance)Astra Trend Trading Strategy is based on unique combination of WMA based Bollinger bands and INDIA VIX based Adaptive Moving Averages combination for trading NIFTY 50 Stocks, Global Indices, Commodity Futures and CFDs.
It Shows Bull/Bear Background (Green color or Red Color showing VIX and Bollinger based Trend Strength in that time period) customized with bollinger parameters.
Barcolors with WHITE Colour shows Trendless movements (Threshold <25)
Green Barcolor:BULL Powerful
RED Barcolor:BEAR Dominant
WHITE:TRENDLESS/SIDEWAYS
Highly Volatile Nifty Stocks like Reliance , HDFCBANK , BANKNIFTY Futures , NIFTY Futures , Crude Oil can be traded.
CRUDEOIL Traders can Change VIX to OVX
Intraday Scalpers use 3,5 and 15 min Time frame on heikenashi charts
Warning:Script changes bar colours and background colours
Default Order Settings:20% of Equity and 0.2% Commission
Strategy - Backtest Uber WAE - Waddah Attar Explosion [UTS]Backtest of WAE - Waddah Attar Explosion
Backtest with focus win/loss profitability.
Formula: profitability = win / (win+loss)
Default equity 100k USD
Default 2% Risk per trade
Default currency USD
Define backtest interval precisely by month, year, day
LONG and SHORT positions
Visualize SL and TP on chart
ATR (len: 14, smooth: SMA)
ATR based Stop-Loss, if hit trade will be closed and considered as loss
ATR based Take-Profit, if hit trade will be closed and considered as win
On TP or SL hit the trade is closed and marked as win/loss

Strategy - Backtest Uber Kuskus Starlight [UTS]Backtest of Uber Kuskus Starlight
Backtest with focus win/loss profitability.
Formula: profitability = win / (win+loss)
Default equity 100k USD
Default 2% Risk per trade
Default currency USD
Define backtest interval precisely by month, year, day
LONG and SHORT positions
Visualize SL and TP on chart
ATR (len: 14, smooth: SMA)
ATR based Stop-Loss, if hit trade will be closed and considered as loss
ATR based Take-Profit, if hit trade will be closed and considered as win
On TP or SL hit the trade is closed and marked as win/loss
TS - Long Term Trading Algorithm - StrategyStrategy to the bespoke TS - Trading Algorithm. Highly profitable cryptocurrency trading model.
This script is long only profitable strategy- there is a script coming in the next few days for shorter timeframe long & short trading.
- Backtesting is from 2017.
- 0.05% commission
- 100% capital allocation per trade.
Access to both the backtesting strategy & indicator is paid - PM me for details.

FTSMA - Trend is your frendThis my new solid strategy: if you belive that "TREND IS YOUR FRIEND" this is for you!
I have tested with many pairs and at many timeframes and have profit with just minor changes in settings.
I suggest to use it for intraday trading .
VERY IMPORTANT NOTE: this is a trend following strategy, so the target is to stay in the trade as much as possible. If your trading style is more focused on scalping and/or pullbaks, this strategy is not for you.
This strategy uses moving averages applied to Fourier waves for forecasting trend direction.
How strategy works:
- Buy when fast MA is above mid MA and price is above slow MA, which acts as a trend indicator.
- Sell when fast MA is below mid MA and price is below slow MA, which acts as a trend indicator.
Strategy uses a lot of pyramiding orders because when you are in a flat market phase it will close 1 or 2 orders with a loss, but when a big trend starts, it will have profit in a lot of orders.
So, if you analize carefully the strategy results, you will note that "Percent Profitable" is very low (30% in this case) because strategy opened a lot of orders also in flat markets with small losses, BUT "Avg # bars in winning trades" is very high and overall Profit is very high: when a big trend starts, orders are kept open for long time generating big profits.
Thanks to all pinescripters mentioned in the code for their snippets.
I have also a study with alerts. Next improvement (only to whom is interested to this script and follows me): study with alerts on multiple tickers all at one. Leave a comment if you want to have access to study.
HOW TO USE STRATEGY AND STUDY TOGHETER:
1- Add to chart the strategy first, so your workspace will be as clean as possible.
2- Open the Strategy Tester tab at footer of the page.
3- Modify settings to get best results (Profit, Profit Factor, Drawdown).
4- Add study with alerts to your chart with same setting of strategy.
I WILL PROVIDE A DETAILED QUICK INSTALLATION GUIDE WITH THE STUDY!
Please use comment section for any feedback or contact me if you need support.

TARI FX USOILHi guys,
this is my new strategy for USOIL WTI!
It works in Daily chart, so you need just a few seconds per day to work with it, very short time to get nice profit!
Stop Loss is set in 500 pips, Take Profit in 600 pips, but for OANDA TP 6.000 and SL 5.000.
The backtest started 36 years ago, so the equity is very solid!
I used 1.000$ as initial capital, and 30 contracts per trade, getting 18% of income per year, and a Max DD of 30% only.
Ask for a free trial, and check by yourself what income whould have been generated investin 100% of the equity!!
Enjoy your wallet!
Tari.

TARI FX USOILHi guys,
this is a brand new strategy for USOIL, WTI.
It works on daily chart, so basically you can watch it just a few seconds per day. Not much time, but consistent profit.
Stop Loss is set on 500 pips, Take Profit on 600 pips, for USOIL on TVC, if you prefer OANDA set 5.000 and 6.000 pips each.
This strategy has been backtested since 1983, almost 36 years, and had nice results, 18% return per year and Max DD 30% with initial capital 1.000$ and 30 contracts size per trade.
Ask for a free trial to enjoy! And look yourself how much whould have been the profit using 100% of the equity!
Enjoy your wallet!
Tari.

Crypto Tipster Pro===========
Crypto Tipster Pro Strategy
===========
Crypto Tipster Pro is a trading strategy with indicators based on Technical Analysis , Price Action and Momentum Swings for TradingView's charting platform.
We've compiled and continue to maintain a trading strategy that adapts to changes in the market; with custom indicator settings, fixed SL/TP, Trailing Stop, Safe Mode, Heikin Ashi Confirmation, Multi-Time Frame Analysis and more!
Our efforts have been focused towards the 1D time frame - using a larger time frame benefits most part-time or evening traders in multiple ways, catching bigger swings and earning a higher percentage per trade, the ability to reduce or remove any leverage associated with the trade, and only having to place a trade or move a stop loss ONCE per day ~ Meaning you are still able to go to work, tidy the house, play with the kids AND be a successful trader.
-----------
What's Included?
Crypto Tipster Pro comes with a host of features and is being continually updated, these features include (but are not limited to):
- Date Range Settings
Setting custom Start/End dates can help hone your strategy to suit the current times, or get a general overview of the market over the years.
- Heikin Ashi Confirmation
We added HA confirmation for both Entry & Exit of trades. This started as a form of "Safe Mode", we have since adapted this mode beyond Heikin Ashi; but kept this confirmation as an added extra.
- Variable Indicator Settings
As well as our Fixed Indicators and Price Action analysis going on in the background of the strategy, we've also included some Variable Indicators that you have access to edit.
Trend Detection Length for detecting trend over a given length! Higher numbers detect longer trends, but will inevitably make fewer trades and possibly miss the start of a new trend; a lower length will create more opportunities to trade but may get confused when in choppy markets.
Range Short/Long Lengths are used for detecting percentage price movements over a given number of bars back. This enables you to effectively "zoom in" on market data and catch trends within trends.
- Safe Mode
Enabling Safe Mode will add a couple more confirmation indicators to the strategy - the aim of Safe Mode is, in essence, to remove any trading signals that would end of being false/bad moves. Usually resulting in less Overall Trades, a higher Net Profit, higher % Profitable, higher Profit Factor AND a lower Drawdown. Use Safe Mode to help eliminate orders that would otherwise be placed in choppy markets.
- Stop Loss/Take Profit Settings
This is where Crypto Tipster Pro really proves itself, Money Management. We have an editable Fixed SL/TP, as well as Trailing Stops for Long or Short orders, all of which you can use on their own, or combined with each other. Playing with these settings can turn an un-profitable system into a very-profitable trading plan!
- Custom Stop Loss Indicator
This is a little extra indicator that we have found very useful over the years of trading markets, a custom Stop Loss Indicator. Simply turn it on, enter the price you want to calculate from, tick Long or Short, enter a % movement and see your new stop loss level plotted on the chart. This is especially useful for when the strategy doesn't marry up with the prices you've actually obtained (for better or for worse!)
We've tried to make this strategy as comprehensive and as accurate as possible, it works consistently over many trading pairs on many time frames. We would however Love your assistance! -please forward any notes or helpful tips to us either by commenting below, on Twitter or a direct message through our website.
-----------
For more information and a FREE 7-Day Trial with the Crypto Tipster Pro Strategy visit the link in our signature.
Good Luck and Happy Trading!
MA-EMA Crossover LTJust a simple strategy based on dynamic zones by Allenster. Still a work in progress.