Hash Ratings EngineHash Ratings Engine - Technical Consensus Strategy
A systematic trading strategy that harnesses TradingView's Technical Ratings to generate high-conviction entries with institutional-grade risk management.
What It Does
This strategy aggregates the consensus of 26+ technical indicators (RSI, MACD, Stochastics, multiple Moving Averages, etc.) into a single actionable signal. When enough indicators align bullish or bearish, the engine triggers an entry. Built-in trend filtering and ATR-based exits keep you on the right side of the market.
Key Features
Trend Filter - Only takes longs in uptrends, shorts in downtrends. This single filter typically improves results by 20-40% by avoiding counter-trend trades.
ATR-Based Risk Management - Stop loss and trailing stops adapt to current market volatility. Tight stops in calm markets, wider stops in volatile conditions.
Cooldown System - After a losing trade, the strategy waits before re-entering. This prevents the consecutive loss streaks that destroy accounts.
Clean Visuals - Fluorescent entry/exit signals with price level references. See exactly where you got in and out.
Settings Guide
Indicator Timeframe: Leave blank for current chart. Use higher timeframe for fewer, higher-quality signals.
Rating Source: "All" for balanced approach. "MAs" for trend-following. "Oscillators" for mean-reversion.
Entry Thresholds
Strong Signal Threshold: Higher = fewer trades but better conviction. Start at 0.5, test 0.4-0.6.
Risk Management
ATR Period: 12 is responsive, 14 is standard, 20+ is smoother.
Stop Loss: 2-3x ATR for tight stops, 3.5-4x for moderate, 5x+ for wide.
Trail Activation: How far price must move in profit before trailing begins.
Trail Offset: How closely the trail follows price.
Trend Filter
EMA Length: 150 works well on 4H charts. Use 100 for lower timeframes, 200 for daily.
Trade Timing
Cooldown: Keep enabled. 5 bars is a good starting point.
Best Practices
Start with default settings and backtest on your preferred instrument. Adjust the Strong Signal Threshold first - this has the biggest impact on trade frequency. Then tune the EMA length to match your timeframe. Finally, optimize the ATR multipliers for your risk tolerance.
Works on any liquid market - crypto, forex, stocks, futures. Higher timeframes (4H, Daily) tend to produce cleaner signals than lower timeframes.
Disclaimer
Past performance does not guarantee future results. Always backtest thoroughly and use proper position sizing. This strategy is for educational purposes - trade at your own risk.
Trading

Profitable Pair Correlation Divergence Scanner v6This strategy identifies divergence opportunities between two correlated assets using a combination of Z-Score spread analysis, trend confirmation, RSI & MACD momentum checks, correlation filters, and ATR-based stop-loss/take-profit management. It’s optimized for positive P&L and realistic trade execution.
Key Features:
Pair Divergence Detection:
Measures deviation between returns of two assets and identifies overbought/oversold spread conditions using Z-Score.
Trend Alignment:
Trades only in the direction of the primary asset’s trend using a fast EMA vs slow EMA filter.
Momentum Confirmation:
Confirms trades with RSI and MACD to reduce false signals.
Correlation Filter:
Ensures the pair is strongly correlated before taking trades, avoiding noisy signals.
Risk Management:
Dynamic ATR-based stop-loss and take-profit ensures proper reward-to-risk ratio.
Exit Conditions:
Automatically closes positions when Z-Score normalizes, or ATR-based exits are hit.
How It Works:
Calculate Returns:
Computes returns for both assets over the selected timeframe.
Z-Score Spread:
Calculates the spread between returns and normalizes it using moving average and standard deviation.
Trend Filter:
Only takes long trades if the fast EMA is above the slow EMA, and short trades if the fast EMA is below the slow EMA.
Momentum Confirmation:
Confirms trade direction with RSI (>50 for longs, <50 for shorts) and MACD alignment.
Correlation Check:
Ensures the pair’s recent correlation is strong enough to validate divergence signals.
Trade Execution:
Opens positions when Z-Score crosses thresholds and all conditions align. Positions close when Z-Score normalizes or ATR-based SL/TP is hit.
Plot Explanation:
Z-Score: Blue line shows divergence magnitude.
Entry Levels: Red/Green lines mark long/short thresholds.
Exit Zone: Gray lines show normalization zone.
EMA Trend Lines: Purple (fast), Orange (slow) for trend alignment.
Correlation: Teal overlay shows current correlation strength.
Usage Tips:
Use highly correlated pairs for best results (e.g., EURUSD/GBPUSD).
Run on higher timeframe charts (1h or 4h) to reduce noise.
Adjust ATR multiplier based on volatility to avoid premature stops.
Combine with alerts for automated notifications or webhook execution.
Conclusion:
The Profitable Pair Correlation Divergence Scanner v6 is designed for traders who want systematic, low-risk, positive P&L trading opportunities with minimal manual monitoring. By combining trend alignment, momentum confirmation, correlation filters, and dynamic exits, it reduces false signals and improves execution reliability.
Run it on TradingView and watch how it captures divergence opportunities while maintaining positive P&L across trades.

RSI Risk | AlgoFy TraderRSI Risk | AlgoFy Trader
Overview
The RSI Risk | AlgoFy Trader is a trading system that combines RSI-based entry signals with automated capital management. This strategy identifies potential momentum shifts while controlling risk through calculated position sizing.
Key Features
Dynamic Risk Management:
Fixed Risk Per Trade: Users set maximum risk percentage per trade.
Automatic Position Sizing: Calculates position size based on stop-loss distance.
Capital Protection: Limits each trade's risk to user-defined percentage.
RSI Entry System:
Momentum Detection: Uses RSI crossovers above/below defined thresholds.
Clear Signals: Provides long/short entries on momentum transitions.
Multiple Exit Layers:
Dynamic Stop Loss: Stop based on recent price structure.
Fixed Safety Stop: Optional percentage-based stop loss.
Partial Take Profit: Optional early profit-taking.
Trailing Stop: Optional dynamic profit protection.
Performance Tracking:
Trade Statistics: Tracks win/loss streaks and performance metrics.
Monthly Dashboard: Shows monthly/yearly P&L with equity views.
Trade Details: Displays risk percentage and position size.
How It Works
Signal Detection: Monitors RSI for crossover events.
Risk Calculation: Determines stop-loss based on recent volatility.
Position Sizing: Calculates exact position to match risk percentage.
Example:
Account: $10,000 | Risk: 2% ($200 max)
Stop loss at 4% distance
Position size: $5,000
Result: 4% loss on $5,000 = $200 (2% of account)
Recommended Settings
Risk: 1-2% per trade
Enable fixed stop at 3-4%
Consider trailing stop activation
This script provides disciplined RSI trading with automated risk control, adjusting exposure while maintaining strict risk limits.

Session Opening Range Breakout (ORBO)This strategy automates a classic Opening Range Breakout (ORBO) approach: it builds a price range for the first minutes after the market opens, then looks for strong breakouts above or below that range to catch early directional moves.
Concept
The idea behind ORBO is simple:
The first minutes after the session open are often highly informative.
Price forms an “opening range” that acts as a mini support/resistance zone.
A clean breakout beyond this zone can lead to high-momentum moves.
This script turns that logic into a fully backtestable strategy in TradingView.
How the strategy works
Opening Range Session
Default session: 09:30–09:50 (exchange time)
During this window, the script tracks:
orHigh → highest high within the session
orLow → lowest low within the session
This forms your Opening Range for the day.
Breakout Logic (after the window ends)
Once the defined session ends:
Long Entry:
If the close crosses above the Opening Range High (orHigh),
→ strategy.entry("OR Long", strategy.long) is triggered.
Short Entry:
If the close crosses below the Opening Range Low (orLow),
→ strategy.entry("OR Short", strategy.short) is triggered.
Only one opening range per day is considered, which keeps the logic clean and easy to interpret.
Daily Reset
At the start of a new trading day, the script resets:
orHigh := na
orLow := na
A fresh Opening Range is then built using the next session’s 09:30–09:50 candles.
This ensures entries are always based on today’s structure, not yesterday’s.
Visuals & Inputs
Inputs:
Opening range session → default: "0930-0950"
Show OR levels → toggle visibility of OR High / Low lines
Fill range body → optional shaded zone between OR High and OR Low
Chart visuals:
A green line marks the Opening Range High.
A red line marks the Opening Range Low.
Optional yellow fill highlights the entire OR zone.
Background shading during the session shows when the range is currently being built.
These visuals make it easy to see:
Where the OR sits relative to current price
How clean / noisy the breakout was
How often price respects or rejects the opening zone
Backtesting & Optimization
Because this is written as a strategy():
You can use TradingView’s Strategy Tester to view:
Win rate
Net profit
Drawdown
Profit factor
Equity curve
Ideas to experiment with:
Change the session window (e.g., 09:15–09:45, 10:00–10:30)
Apply to different:
Markets: indices, FX, crypto, stocks
Timeframes: 1m / 5m / 15m
Add your own:
Stop Loss & Take Profit levels
Time filters (only trade certain days / times)
Volatility filters (e.g., ATR, range size thresholds)
Higher-timeframe trend filter (e.g., only take longs above 200 EMA)

RSI Strategy [PrimeAutomation]⯁ OVERVIEW
The RSI Strategy is a momentum-driven trading system built around the behavior of the Relative Strength Index (RSI).
Instead of using traditional overbought/oversold zones, this strategy focuses on RSI breakouts with volatility-based trailing stops, adaptive profit-targets, and optional early-exit logic.
It is designed to capture strong continuation moves after momentum shifts while protecting trades using ATR-based dynamic risk management.
⯁ CONCEPTS
RSI Breakout Momentum: Entries happen when RSI breaks above/below custom thresholds, signaling a shift in momentum rather than mean reversion.
Volatility-Adjusted Risk: ATR defines both stop-loss and profit-target distances, scaling positions based on market volatility.
Dynamic Trailing Stop: The strategy maintains an adaptive trailing level that tightens as price moves in the trade’s favor.
Single-Position System: Only one trade at a time (no pyramiding), maximizing clarity and simplifying execution.
⯁ KEY FEATURES
RSI Signal Engine
• Long when RSI crosses above Upper threshold
• Short when RSI crosses below Lower threshold
These levels are configurable and optimized for trend-momentum detection.
ATR-Based Stop-Loss
A custom ATR multiplier defines the initial stop.
• Long stop = price – ATR × multiplier
• Short stop = price + ATR × multiplier
Stops adjust continuously using a trailing model.
ATR-Based Take Profit (Optional)
Profit targets scale with volatility.
• Long TP = entry + ATR × TP-multiplier
• Short TP = entry – ATR × TP-multiplier
Users can disable TP and rely solely on trailing stops.
Real-Time Trailing Logic
The stop updates bar-by-bar:
• In a long trade → stop moves upward only
• In a short trade → stop moves downward only
This keeps the stop tight as trends develop.
Early Exit Module (Optional)
After X bars in a trade, opposite RSI signals trigger exit.
This reduces holding time during weak follow-through phases.
Full Visual Layer
• RSI plotted with threshold fills
• Entry/TP/Stop visual lines
• Color-coded zones for clarity
⯁ HOW TO USE
Look for RSI Breakouts:
Focus on RSI crossing above the upper boundary (long) or below the lower boundary (short). These moments identify fresh momentum surges.
Use ATR Levels to Manage Risk:
Because stops and targets scale with volatility, the strategy adapts well to both quiet and explosive market phases.
Monitor Trailing Stops for Trend Continuation:
The trailing stop is the primary driver of exits—often outperforming fixed targets by catching larger runs.
Use on Liquid Markets & Mid-Higher Timeframes:
The system performs best where RSI and ATR signals are clean—crypto majors, FX, and indices.
⯁ CONCLUSION
The RSI Strategy is a modern RSI breakout system enhanced with volatility-adaptive risk management and flexible exit logic. It is designed for traders who prefer momentum confirmation over mean reversion, offering a disciplined framework with robust protections and dynamic trend-following capability.
Its blend of ATR-based stops, optional profit targets, and RSI-driven entries makes it a reliable strategy across a wide range of market conditions.

Anchor SafeSwing Gold StrategyOverview:
The Anchor SafeSwing Gold Strategy is designed for users who prefer structured, rule-based swing trading on XAUUSD. It focuses on identifying high-quality trade setups rather than frequent entries.
This strategy analyzes the market using multiple technical indicators and methods—including trend analysis, multi-chart confirmation, and support/resistance evaluation—to identify potential swing points. It also incorporates a dynamic approach to risk management through adaptive stop-loss and take-profit logic.
How the Strategy Works
1. Multi-Chart & Trend Analysis:
The strategy evaluates trend direction using several indicators and multiple charts. This helps determine whether the trend favors long or short setups.
2. Buy/Sell Conditions:
a. Buy Conditions: When the broader trend is identified as bullish, the strategy waits for the formation of a strong support zone before considering a long position.
b. Sell Conditions: When the trend is bearish, it waits for a confirmed resistance zone before initiating short positions.
3. Dynamic Take-Profit Logic
The strategy uses adaptive take-profit behavior based on evolving market conditions. It monitors new support/resistance structures and various overbought/oversold signals to dynamically exit trades.
4. Dynamic and Configurable Stop-Loss:
A flexible stop-loss system adjusts according to volatility and market structure.
Users can modify the stop-loss threshold in the settings based on their own risk tolerance and account size.
Trading Frequency :
This strategy focuses on select, high-quality setups. As a result, trade frequency is relatively low and may vary depending on market conditions. Backtesting may show roughly several trades per month, but actual live performance can differ.
Important Notes
All trading involves risk, and users should evaluate the strategy and adjust settings according to their own risk management preferences.

Safe Supertrend Strategy (No Repaint)Overview
The Safe Supertrend is a repaint-free version of the popular Supertrend trend-following indicator.
Most Supertrend indicators appear perfect on historical charts because they flip intrabar and then repaint after the candle closes.
This version fixes that by using close-of-bar confirmation only, making every trend flip 100% stable, safe, and non-repainting.
Why This Supertrend Doesn’t Repaint
Most Supertrend indicators calculate their trend direction using the current bar’s data.
But during a live candle:
ATR expands and contracts
The upper/lower bands move
Price moves above/below the band temporarily
A false flip appears → then disappears when the candle closes
That is classic repainting.
This indicator avoids all of that by using:
close > upper
close < lower
This means:
Trend direction flips only based on the previous candle,
No intrabar calculations,
No flickering signals,
No “perfect but fake” historical performance.
Every signal you see on the chart is exactly what was available in real-time.
How It Works
Calculates ATR (Average True Range) and SMA centerline
Builds upper and lower volatility bands
Confirms trend flips only after the previous bar closes
Plots clear bull and bear reversal signals
Works on all markets (crypto, stocks, forex, indices)
No repainting, no recalc, no misleading flips.
Bullish Signal (Trend Up)
A bullish trend begins only when:
The previous candle closes above the upper ATR band,
And this flip is fully confirmed.
A green triangle marks the start of a new uptrend.
Bearish Signal (Trend Down)
A bearish trend begins only when:
The previous candle closes below the lower ATR band,
And the downtrend is confirmed.
A red triangle signals the start of a new downtrend.
Inputs
ATR Length - default 10
ATR Multiplier - default 3.0
Works on all timeframes and market
Simple, but powerful.
Why Use This Version Instead of a Regular Supertrend?
Most Supertrends:
Look great historically
But repaint continuously on live charts
Give false trend flips intrabar
Cannot be reliably used in strategies
This version:
Uses strict previous-bar logic
Never repaints trend direction
Works perfectly in live trading
Backtests accurately
Is ideal for algorithmic strategies
Ideal For:
Trend-following strategies
Breakout trading
Algo trading systems
Reversal detection
Filtering market noise
Swing trading & scalping
Final Note
This is a safer, more reliable Supertrend designed for real-world use — not perfect-looking repaint illusions.
If you use Supertrend in your trading system, this no-repaint version ensures your signals are trustworthy and consistent.

XRP CrossChain Momentum EngineThis is a strategy with stop loss 3% , leverage 4 and no pyramiding. It works great with XRP and other coins with similar price, but i suggest XRP. Profit in 1 year around 900% and profit in 2 years around 2000% as you can see in the pictures. I have initial capital 1000 but it can change.

EMA Velocity Dual TF Momentum 1h (v2)BINANCE:SOLUSDT
The result is calculated on futures x10
### EMA Velocity Dual TF Momentum (v2) – Public Description
**Overview**
EMA Velocity Dual TF Momentum (v1) is a trend-following momentum strategy that uses the *speed of change* of Exponential Moving Averages (EMA) on two timeframes: the chart timeframe 1h.
The strategy looks for moments when both timeframes point in the same direction and the short‑term momentum is significantly stronger than usual, then manages trades with configurable ATR filtering, stop‑loss / take‑profit and early exit logic.
---
### Core Idea (high level, without formulas)
- On the **lower timeframe** (LTF), the strategy tracks how fast the EMA is moving (its “velocity”) and detects **impulse bars** where this velocity is unusually strong compared to its recent history.
- On the **higher timeframe** (HTF), it also measures EMA velocity and requires that the HTF trend direction is **aligned** with the LTF (both bullish or both bearish), if enabled.
- A **long trade** is opened when:
- LTF EMA velocity is positive (upward momentum),
- LTF momentum is strong enough (impulse),
- HTF EMA velocity is also upwards (if HTF filter is enabled),
- and ATR‑based volatility is above the minimum threshold.
- A **short trade** is opened in the symmetric situation (downward momentum on both timeframes).
- Positions are closed using configurable stop‑loss and take‑profit, and can be partially exited, moved to break‑even and trailed using early‑exit options.
---
### Inputs and Parameters
#### Trend & Momentum (Lower Timeframe)
- **`LTF EMA length (emaLenLTF)`**
Length of the EMA on the chart timeframe used to measure short‑term trend and momentum. Smaller values react faster; larger values are smoother and slower.
- **`LTF velocity lookback (velKLTF)`**
Lookback for computing EMA “velocity” on LTF. Controls how sensitive the momentum calculation is to recent price changes.
- **`LTF impulse lookback bars (impLookback)`**
Window size used to estimate the “normal” average absolute velocity. The strategy compares current momentum against this baseline to detect strong impulse moves.
- **`LTF |velocity| multiplier vs average (impMult)`**
Multiplier for defining what counts as a strong impulse. Higher values = fewer but stronger signals; lower values = more frequent, weaker impulses.
#### Trend & Momentum (Higher Timeframe)
- **`Use higher timeframe alignment (useHTF)`**
If enabled, trades are only taken when the higher‑timeframe EMA velocity confirms the same direction as the lower timeframe.
- **`HTF timeframe (htf_tf)`**
Higher timeframe used for confirmation (e.g. 60 minutes). Defines the “macro” context above the chart timeframe.
- **`HTF EMA length (emaLenHTF)`**
Length of the EMA on the higher timeframe. Controls how smooth and slow the higher‑timeframe trend filter is.
- **`HTF velocity lookback (velKHTF)`**
Lookback for the EMA velocity on HTF. Smaller values react quicker to changes in the higher‑timeframe trend.
#### Volatility / ATR Filter
- **`Use ATR filter (useAtrFilter)`**
Enables a volatility filter based on Average True Range. When active, trades are allowed only if market volatility is not too low.
- **`ATR Period (atrPeriod)`**
Lookback period for ATR calculation. Shorter periods react faster to recent volatility shifts; longer ones are more stable.
- **`ATR Min % for trading (atrMinPerc)`**
Minimum ATR as a percentage of price required to trade. Filters out very quiet, choppy periods where the strategy is more likely to be whipsawed.
#### Risk Management
- **`Use stops (SL/TP) (useStops)`**
Enables fixed stop‑loss and take‑profit exits. If disabled, positions are managed only by early exit logic and manual closing.
- **`Stop Loss % (stopLossPerc)`**
Distance of the protective stop from entry, in percent. Higher values give trades more room but increase risk per trade.
- **`Take Profit % (takeProfitPerc)`**
Distance of the primary profit target from entry, in percent. Controls the reward‑to‑risk profile of each trade.
#### Early Exit / Break‑Even / Trailing
- **`Enable early exit module (useEarlyExit)`**
Master switch for all early exit features: partial profit taking, break‑even stops and trailing exits.
- **`Take partial profit at +% (close 50%) (partialTP)`**
Profit level (in %) at which the strategy closes a partial portion of the position (e.g. 50%), locking in gains while leaving a runner.
- **`Trailing TP distance (%) (trailTP)`**
Distance (in %) for dynamic trailing stop after entry. When positive, the strategy trails the price to protect profits as the move extends.
- **`Break-even stop after +% profit (useBreakEven)`**
Enables automatic move of the stop to the entry price once a certain profit threshold is reached.
- **`Break-even activation (+%) (breakEvenPerc)`**
Profit level (in %) at which the stop is moved to break‑even. Higher values require a larger unrealized profit before break‑even protection kicks in.
#### Visuals
- **`Show labels (showLabels)`**
Toggles on‑chart labels that mark long and short entry signals for easier visual analysis.
- **`Label offset (labelOffset)`**
Horizontal offset (in bars) for placing labels relative to the signal bar. Used only for visual clarity; does not affect trading logic.
---
Если нужно, могу на основе этого текста сразу подготовить компактную версию (ограниченную по символам) специально под поле описания публичного скрипта в TradingView.

ATR Trend + RSI Pullback Strategy [Profit-Focused]This strategy is designed to catch high-probability pullbacks during strong trends using a combination of ATR-based volatility filters, RSI exhaustion levels, and a trend-following entry model.
Strategy Logic
Rather than relying on lagging crossovers, this model waits for RSI to dip into oversold zones (below 40) while price remains above a long-term EMA (default: 200). This setup captures pullbacks in strong uptrends, allowing traders to enter early in a move while controlling risk dynamically.
To avoid entries during low-volatility conditions or sideways price action, it applies a minimum ATR filter. The ATR also defines both the stop-loss and take-profit levels, allowing the model to adapt to changing market conditions.
Exit logic includes:
A take-profit at 3× the ATR distance
A stop-loss at 1.5× the ATR distance
An optional early exit if RSI crosses above 70, signaling overbought conditions
Technical Details
Trend Filter: 200 EMA – must be rising and price must be above it
Entry Signal: RSI dips below 40 during an uptrend
Volatility Filter: ATR must be above a user-defined minimum threshold
Stop-Loss: 1.5× ATR below entry price
Take-Profit: 3.0× ATR above entry price
Exit on Overbought: RSI > 70 (optional early exit)
Backtest Settings
Initial Capital: $10,000
Position Sizing: 5% of equity per trade
Slippage: 1 tick
Commission: 0.075% per trade
Trade Direction: Long only
Timeframes Tested: 15m, 1H, and 30m on trending assets like BTCUSD, NAS100, ETHUSD
This model is tuned for positive P&L across trending environments and volatile markets.
Educational Use Only
This strategy is for educational purposes only and should not be considered financial advice. Past performance does not guarantee future results. Always validate performance on multiple markets and timeframes before using it in live trading.

EMA Cross + RSI + ADX - Autotrade Strategy V2Overview
A versatile trend-following strategy combining EMA 9/21 crossovers with RSI momentum filtering and optional ADX trend strength confirmation. Designed for both cryptocurrency and traditional futures/options markets with built-in stop loss management and automated position reversals.
Key Features
Multi-Market Compatibility: Works on both crypto futures (Bitcoin, Ethereum) and traditional markets (NIFTY, Bank NIFTY, S&P 500 futures, equity options)
Triple Confirmation System: EMA crossover + RSI filter + ADX strength (optional)
Automated Risk Management: 2% stop loss with wick-touch detection
Position Auto-Reversal: Opposite signals automatically close and reverse positions
Webhook Ready: Six distinct alert messages for automation (Entry Buy/Sell, Close Long/Short, SL Hit Long/Short)
Performance Metrics
NIFTY Futures (15min): 50%+ win rate with ADX filter OFF
Crypto Markets: Requires extensive backtesting before live deployment
Optimal Timeframes: 15-minute to 1-hour charts (patience required for higher timeframes)
Strategy Logic
Entry Signals:
LONG: EMA 9 crosses above EMA 21 + RSI > 55 + ADX > 20 (if enabled)
SHORT: EMA 9 crosses below EMA 21 + RSI < 45 + ADX > 20 (if enabled)
Exit Signals:
Opposite EMA crossover (auto-closes current position)
Stop loss hit at 2% from entry price (tracks candle wicks)
Technical Indicators:
Fast EMA: 9-period (short-term trend)
Slow EMA: 21-period (primary trend)
RSI: 14-period with 55/45 thresholds (momentum confirmation)
ADX: 14-period with 20 threshold (trend strength filter - optional)
Market-Specific Settings
Traditional Markets (NIFTY, Bank NIFTY, S&P Futures, Options)
Recommended Settings:
ADX Filter: Turn OFF (less choppy, cleaner trends)
Timeframe: 15-minute chart
Win Rate: 50%+ on NIFTY Futures
Why No ADX: Traditional markets have more institutional participation and smoother price action, making ADX unnecessary
Cryptocurrency Markets (BTC, ETH, Altcoins)
Recommended Settings:
ADX Filter: Turn ON (ADX > 20)
Timeframe: 15-minute to 1-hour
Extensive backtesting required before live trading
Why ADX: Crypto markets are highly volatile and prone to false breakouts; ADX filters low-quality chop
Best Practices
✅ Backtest thoroughly on your specific instrument and timeframe
✅ Use larger timeframes (1H, 4H) for higher quality signals and better risk/reward
✅ Adjust RSI thresholds based on market volatility (try 52/48 for more signals, 60/40 for fewer but stronger)
✅ Monitor ADX effectiveness - disable for traditional markets, enable for crypto
✅ Proper position sizing - adjust default_qty_value based on your capital and instrument price
✅ Paper trade first - test for 2-4 weeks before risking real capital
Risk Management
Fixed 2% stop loss per trade (adjustable)
Stop loss tracks candle wicks for accurate execution
Positions auto-reverse on opposite signals (no manual intervention needed)
0.075% commission built into backtest (adjust for your broker)
Customization Options
All parameters are adjustable via inputs:
EMA periods (default: 9/21)
RSI length and thresholds (default: 14-period, 55/45 levels)
ADX length and threshold (default: 14-period, 20 threshold)
Stop loss percentage (default: 2%)
Webhook Automation
This strategy includes six distinct alert messages for automated trading:
"Entry Buy" - Long position opened
"Entry Sell" - Short position opened
"Close Long" - Long position closed on opposite crossover
"Close Short" - Short position closed on opposite crossover
"SL Hit Long" - Long stop loss triggered
"SL Hit Short" - Short stop loss triggered
Compatible with Delta Exchange, Binance Futures, 3Commas, Alertatron, and other webhook platforms.
Important Notes
⚠️ Crypto markets require extensive backtesting - volatility patterns differ significantly from traditional markets
⚠️ Higher timeframes = better results - 15min works but 1H/4H provide cleaner signals
⚠️ ADX toggle is critical - OFF for traditional markets, ON for crypto
⚠️ Not financial advice - always conduct your own research and use proper risk management
⚠️ Past performance ≠ future results - backtest results may not reflect live trading conditions
Disclaimer
This strategy is for educational and informational purposes only. Trading futures and options involves substantial risk of loss. Always backtest thoroughly, start with paper trading, and never risk more than you can afford to lose. The author assumes no responsibility for any trading losses incurred using this strategy.

Signalgo Strategy ISignalgo Strategy I: Technical Overview
Signalgo Strategy I is a systematically engineered TradingView strategy script designed to automate, test, and manage trend-following trades using multi-timeframe price/volume logic, volatility-based targets, and multi-layered exit management. This summary covers its operational structure, user inputs, entry and exit methodology, unique technical features, and practical application.
Core Logic and Workflow
Multi-Timeframe Data Synthesis
User-Defined Timeframe: The user chooses a timeframe (e.g., 1H, 4H, 1D, etc.), on which all strategy signals are based.
Cross-Timeframe Inputs: The strategy imports closing price, volume, and Average True Range (ATR) for the selected interval, independently from the chart’s native timeframe, enabling robust multi-timeframe analysis.
Price Change & Volume Ratio: It calculates the percent change of price per bar and computes a volume ratio by comparing current volume to its 20-bar moving average—enabling detection of true “event” moves vs. normal market noise.
Hype Filtering
Anti-Hype Mechanism: An entry is automatically filtered out if abnormal high volume occurs without corresponding price movement, commonly observed during manipulation or announcement periods. This helps isolate genuine market-driven momentum.
User Inputs
Select Timeframe: Choose which interval drives signal generation.
Backtest Start Date: Specify from which date historical signals are included in the strategy (for precise backtests).
Take-Profit/Stop-Loss Configuration: Internally, risk levels are set as multiples of ATR and allow for three discrete profit targets.
Entry Logic
Trade Signal Criteria:
Price change magnitude in the current bar must exceed a fixed sensitivity threshold.
Volume for the bar must be significantly elevated compared to average, indicating meaningful participation.
Anti-hype check must not be triggered.
Bullish/Bearish Determination: If all conditions are met and price change direction is positive, a long signal triggers. If negative, a short signal triggers.
Signal Debouncing: Ensures a signal triggers only when a new condition emerges, avoiding duplicate entries on flat or choppy bars.
State Management: The script tracks whether an active long or short is open to avoid overlapping entries and to facilitate clean reversals.
Exit Strategy
Take-Profits: Three distinct profit targets (TP1, TP2, TP3) are calculated as fixed multiples of the ATR-based stop loss, adapting dynamically to volatility.
Reversals: If a buy signal appears while a short is open (or vice versa), the existing trade is closed and reversed in a single step.
Time-Based Exit: If, 49 bars after entry, the trade is in-profit but hasn’t reached TP1, it exits to avoid stagnation risk.
Adverse Move Exit: The position is force-closed if it suffers a 10% reversal from entry, acting as a catastrophic stop.
Visual Feedback: Each TP/SL/exit is plotted as a clear, color-coded line on the chart; no hidden logic is used.
Alerts: Built-in TradingView alert conditions allow automated notification for both entries and strategic exits.
Distinguishing Features vs. Traditional MA Strategies
Event-Based, Not Just Slope-Based: While classic moving average strategies enter trades on MA crossovers or slope changes, Signalgo Strategy I demands high-magnitude price and volume confirmation on the chosen timeframe.
Volume Filtering: Very few MA strategies independently filter for meaningful volume spikes.
Real Market Event Focus: The anti-hype filter differentiates organic market trends from manipulated “high-volume, no-move” sessions.
Three-Layer Exit Logic: Instead of a single trailing stop or fixed RR, this script manages three profit targets, time-based closures, and hard adverse thresholds.
Multi-Timeframe, Not Chart-Dependent: The “main” analytical interval can be set independently from the current chart, allowing for in-depth cross-timeframe backtests and system runs.
Reversal Handling: Automatic handling of signal reversals closes and flips positions precisely, reducing slippage and manual error.
Persistent State Tracking: Maintains variables tracking entry price, trade status, and target/stop levels independently of chart context.
Trading Application
Strategy Sandbox: Designed for robust backtesting, allowing users to simulate performance across historical data for any major asset or interval.
Active Risk Management: Trades are consistently managed for both fixed interval “stall” and significant loss, not just via trailing stops or fixed-day closes.
Alert Driven: Can power algorithmic trading bots or notify discretionary traders the moment a qualifying market event occurs.

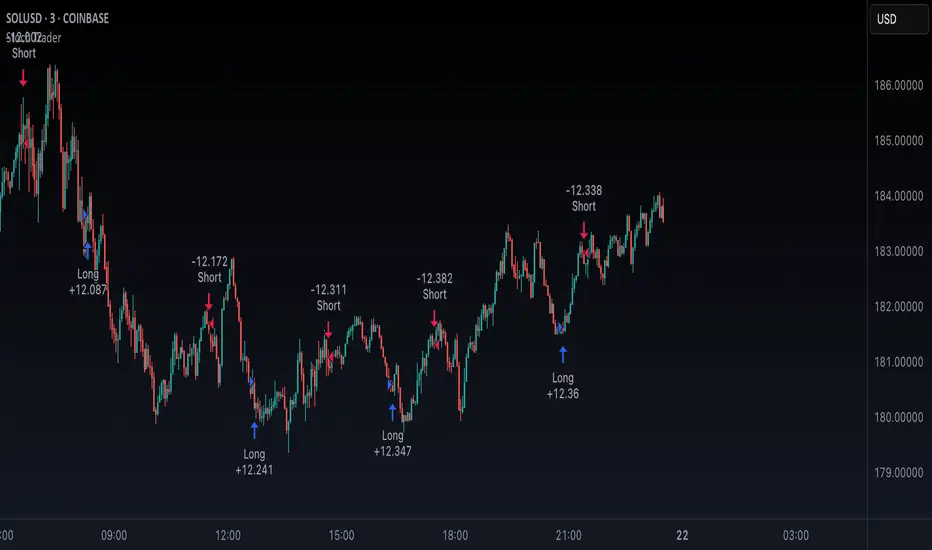
Stoch TraderSimple example strategy that has greater than 60% win rate on 1m, 3m, and 5m views. Using something as simple as this with leverage can produce decent returns within 15-30min. It's also very easy to lose money doing this.
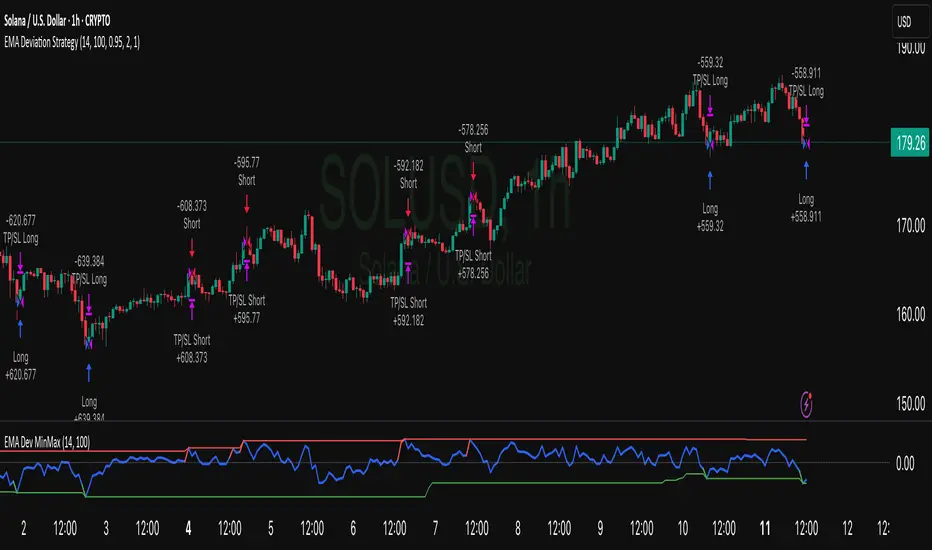
EMA Deviation Strategy📌 Strategy: EMA Deviation Strategy
The EMA Deviation Strategy identifies potential reversal points by measuring how far the current price deviates from its Exponential Moving Average (EMA). It dynamically tracks the minimum and maximum deviation levels over a user-defined lookback period, and enters trades when price reaches extreme zones.
🔍 Core Logic:
• Buy Entry: When price deviates significantly below the EMA, approaching the historical minimum deviation — signaling a potential rebound.
• Sell Entry: When price deviates significantly above the EMA, nearing the historical maximum deviation — signaling a possible pullback.
• Optional Take Profit / Stop Loss: Manage risk with customizable exit levels.
⚙️ Customizable Inputs:
• EMA length and lookback period
• Threshold sensitivity for entry signals
• Take profit and stop loss percentages
📈 Best Used For:
• Mean reversion setups
• Assets with cyclical or range-bound behavior
• Identifying short-term overbought/oversold conditions
Trading Report Generator from CSVMany people use the Trading Panel. Unfortunately, it doesn't have a Performance Report. However, TradingView has strategies, and they have a Performance Report :-D
What if we combine the first and second? It's easy!
This script is a special strategy that parses transactions in csv format from Paper Trading (and it will also work for other brokers) and “plays” them. As a result, we get a Performance Report for a specific instrument based on our real trades in Paper or another broker.
How to use it :
First, we need to get a CSV file with transactions. To do this, go to the Trading Panel and connect the desired broker. Select the History tab, then the Filled sub-tab, and configure the columns there, leaving only: Side, Qty, Fill Price, Closing Time. After that, open the Export data dialog, select History, and click Export. Open the downloaded CSV file in a regular text editor (Notepad or similar). It will contain a text like this:
Symbol,Side,Qty,Fill Price,Closing Time
FX:EURUSD,Buy,1000,1.0938700000000001,2023-04-05 14:29:23
COINBASE:ETHUSD,Sell,1,1332.05,2023-01-11 17:41:33
CME_MINI:ESH2023,Sell,1,3961.75,2023-01-11 17:30:40
CME_MINI:ESH2023,Buy,1,3956.75,2023-01-11 17:08:53
Next select all the text (Ctrl+A) and copy it to the clipboard.
Now apply the "Trading Report Generator from CSV" strategy to the chart with the desired symbol and TF, open the settings/input dialog, paste the contents of the clipboard into the single text input field of the strategy, and click Ok.
That's it.
In the Strategy Tester, we see a detailed Performance Report based on our real transactions.
P.S. The CSV file may contain transactions for different instruments, for example, you may have transactions for CRYPTO:BTCUSD and NASDAQ:AAPL. To view the report is based on CRYPTO:BTCUSD trades, simply change the symbol on the chart to CRYPTO:BTCUSD. To view the report is based on NASDAQ:AAPL trades, simply change the symbol on the chart to NASDAQ:AAPL. No changes to the strategy are required.
How it works :
At the beginning of the calculation, we parse the csv once, create trade objects (Trade) and sort them in chronological order. Next, on each bar, we check whether we have trades for the time period of the next bar. If there are, we place a limit order for each trade, with limit price == Fill Price of the trade. Here, we assume that if the trade is real, its execution price will be within the bar range, and the Pine strategy engine will execute this order at the specified limit price.

Buy The Dip - ENGThis script implements a grid trading strategy for long positions in the USDT market. The core idea is to place a series of buy limit orders at progressively lower prices below an initial entry point, aiming to lower the average entry price as the price drops. It then aims to exit the entire position when the price rises a certain percentage above the average entry price.
Here's a detailed breakdown:
1. Strategy Setup (`strategy` function):
`'거미줄 자동매매 250227'`: The name of the strategy.
`overlay = true`: Draws plots and labels directly on the main price chart.
`pyramiding = 15`: Allows up to 15 entries in the same direction (long). This is essential for grid trading, as it needs to open multiple buy orders.
`initial_capital = 600`: Sets the starting capital for backtesting to 600 USDT.
`currency = currency.USDT`: Specifies the account currency as USDT.
`margin_long/short = 0`: Doesn't define specific margin requirements (might imply spot trading logic or rely on exchange defaults if used live).
`calc_on_order_fills = false`: Strategy calculations happen on each bar's close, not just when orders fill.
2. Inputs (`input`):
Core Settings:
`lev`: Leverage (default 10x). Used to calculate position sizes.
`Investment Percentage %`: Percentage of total capital to allocate to the initial grid (default 80%).
`final entry Percentage %`: Percentage of the *remaining* capital (100 - `Investment Percentage %`) to use for the "semifinal" entry (default 50%). The rest goes to the "final" entry.
`Price Adjustment Length`: Lookback period (default 4 bars) to determine the initial `maxPrice`.
`price range`: The total percentage range downwards from `maxPrice` where the grid orders will be placed (default -10%, meaning 10% down).
`tp`: Take profit percentage above the average entry price (default 0.45%).
`semifinal entry price percent`: Percentage drop from `maxPrice` to trigger the "semifinal" larger entry (default -12%).
`final entry price percent`: Percentage drop from `maxPrice` to trigger the "final" larger entry (default -15%).
Rounding & Display:
`roundprice`, `round`: Decimal places for rounding price and quantity calculations.
`texts`, `label_style`: User interface preferences for text size and label appearance on the chart.
Time Filter:
`startTime`, `endTime`: Defines the date range for the backtest.
3. Calculations & Grid Setup:
`maxPrice`: The highest price point for the grid setup. Calculated as the lowest low of the previous `len` bars only if no trades are open. If trades are open, it uses the entry price of the very first order placed in the current sequence (`strategy.opentrades.entry_price(0)`).
`minPrice`: The lowest price point for the grid, calculated based on `maxPrice` and `range1`.
`totalCapital`: The amount of capital (considering leverage and `per1`) allocated for the main grid orders.
`coinRatios`: An array ` `. This defines the *relative* size ratio for each of the 11 grid orders. Later orders (at lower prices) will be progressively larger.
`totalRatio`: The sum of all ratios (66).
`positionSizes`: An array calculated based on `totalCapital` and `coinRatios`. It determines the actual quantity (size) for each of the 11 grid orders.
4. Order Placement Logic (`strategy.entry`):
Initial Grid Orders:
Runs only if within the specified time range and no position is currently open (`strategy.opentrades == 0`).
A loop places 11 limit buy orders (`Buy 1` to `Buy 11`).
Prices are calculated linearly between `maxPrice` and `minPrice`.
Order sizes are taken from the `positionSizes` array.
Semifinal & Final Entries:
Two additional, larger limit buy orders are placed simultaneously with the grid orders:
`semifinal entry`: At `maxPrice * (1 - semifinal / 100)`. Size is based on `per2`% of the capital *not* used by the main grid (`1 - per1`).
`final entry`: At `maxPrice * (1 - final / 100)`. Size is based on the remaining capital (`1 - per2`% of the unused portion).
5. Visualization (`line.new`, `label.new`, `plot`, `plotshape`, `plotchar`):
Grid Lines & Labels:
When a position is open (`strategy.opentrades > 0`), horizontal lines and labels are drawn for each of the 11 grid order prices and the "final" entry price.
Lines extend from the bar where the *first* entry occurred.
Labels show the price and planned size for each level.
Dynamic Coloring: If the price drops below a grid level, the corresponding line turns green, and the label color changes, visually indicating that the level has been reached or filled.
Plotted Lines:
`maxPrice` (initial high point for the grid).
`strategy.position_avg_price` (current average entry price of the open position, shown in red).
Target Profit Price (`strategy.position_avg_price * (1 + tp / 100)`, shown in green).
Markers:
A flag marks the `startTime`.
A rocket icon (`🚀`) appears below the bar where the `final entry` triggers.
A stop icon (`🛑`) appears below the bar where the `semifinal entry` triggers.
6. Exit Logic (`strategy.exit`, `strategy.entry` with `qty=0`):
Main Take Profit (`Full Exit`):
Uses `strategy.entry('Full Exit', strategy.short, qty = 0, limit = target2)`. This places a limit order to close the entire position (`qty=0`) at the calculated take profit level (`target2 = avgPrice * (1 + tp / 100)`). Note: Using `strategy.entry` with `strategy.short` and `qty=0` is a way to close a long position, though `strategy.exit` is often clearer. This exit seems intended to apply whenever any part of the grid position is open.
First Order Trailing Stop (`1st order Full Exit`):
Conditional: Only active if `trail` input is true AND the *last* order filled was "Buy 1" (meaning only the very first grid level was entered).
Uses `strategy.exit` with `trail_points` and `trail_offset` based on ATR values to implement a trailing stop loss/profit mechanism for this specific scenario.
This trailing stop order is cancelled (`strategy.cancel`) if any subsequent grid orders ("Buy 2", etc.) are filled.
Final/Semifinal Take Profit (`final Full Exit`):
Conditional: Only active if more than 11 entries have occurred (meaning either the "semifinal" or "final" entry must have triggered).
Uses `strategy.exit` to place a limit order to close the entire position at the take profit level (`target3 = avgPrice * (1 + tp / 100)`).
7. Information Display (Tables & UI Label):
`statsTable` (Top Right):
A comprehensive table displaying grouped information:
Market Info (Entry Point, Current Price)
Position Info (Avg Price, Target Price, Unrealized PNL $, Unrealized PNL %, Position Size, Position Value)
Strategy Performance (Realized PNL $, Realized PNL %, Initial/Total Balance, MDD, APY, Daily Profit %)
Trade Statistics (Trade Count, Wins/Losses, Win Rate, Cumulative Profit)
`buyAvgTable` (Bottom Left):
* Shows the *theoretical* entry price and average position price if trades were filled sequentially up to each `buy` level (buy1 to buy10). It uses hardcoded percentage drops (`buyper`, `avgper`) based on the initial `maxPrice` and `coinRatios`, not the dynamically changing actual average price.
`uiLabel` (Floating Label on Last Bar):
Updates only on the most recent bar (`barstate.islast`).
Provides real-time context when a position is open: Size, Avg Price, Current Price, Open PNL ($ and %), estimated % drop needed for the *next* theoretical buy (based on `ui_gridStep` input), % rise needed to hit TP, and estimated USDT profit at TP.
Shows "No Position" and basic balance/trade info otherwise.
In Summary:
This is a sophisticated long-only grid trading strategy. It aims to:
1. Define an entry range based on recent lows (`maxPrice`).
2. Place 11 scaled-in limit buy orders within a percentage range below `maxPrice`.
3. Place two additional, larger buy orders at deeper percentage drops (`semifinal`, `final`).
4. Calculate the average entry price as orders fill.
5. Exit the entire position for a small take profit (`tp`) above the average entry price.
6. Offer a conditional ATR trailing stop if only the first order fills.
7. Provide extensive visual feedback through lines, labels, icons, and detailed information tables/UI elements.
Keep in mind that grid strategies can perform well in ranging or slowly trending markets but can incur significant drawdowns if the price trends strongly against the position without sufficient retracements to hit the take profit. The leverage (`lev`) input significantly amplifies both potential profits and losses.

ThinkTech AI SignalsThink Tech AI Strategy
The Think Tech AI Strategy provides a structured approach to trading by integrating liquidity-based entries, ATR volatility thresholds, and dynamic risk management. This strategy generates buy and sell signals while automatically calculating take profit and stop loss levels, boasting a 64% win rate based on historical data.
Usage
The strategy can be used to identify key breakout and retest opportunities. Liquidity-based zones act as potential accumulation and distribution areas and may serve as future support or resistance levels. Buy and sell zones are identified using liquidity zones and ATR-based filters. Risk management is built-in, automatically calculating take profit and stop loss levels using ATR multipliers. Volume and trend filtering options help confirm directional bias using a 50 EMA and RSI filter. The strategy also allows for session-based trading, limiting trades to key market hours for higher probability setups.
Settings
The risk/reward ratio can be adjusted to define the desired stop loss and take profit calculations. The ATR length and threshold determine ATR-based breakout conditions for dynamic entries. Liquidity period settings allow for customized analysis of price structure for support and resistance zones. Additional trend and RSI filters can be enabled to refine trade signals based on moving averages and momentum conditions. A session filter is included to restrict trade signals to specific market hours.
Style
The strategy includes options to display liquidity lines, showing key support and resistance areas. The first 15-minute candle breakout zones can also be visualized to highlight critical market structure points. A win/loss statistics table is included to track trade performance directly on the chart.
This strategy is intended for descriptive analysis and should be used alongside other confluence factors. Optimize your trading process with Think Tech AI today!

Ultimate T3 Fibonacci for BTC Scalping. Look at backtest report!Hey Everyone!
I created another script to add to my growing library of strategies and indicators that I use for automated crypto trading! This strategy is for BITCOIN on the 30 minute chart since I designed it to be a scalping strategy. I calculated for trading fees, and use a small amount of capital in the backtest report. But feel free to modify the capital and how much per order to see how it changes the results:)
It is called the "Ultimate T3 Fibonacci Indicator by NHBprod" that computes and displays two T3-based moving averages derived from price data. The t3_function calculates the Tilson T3 indicator by applying a series of exponential moving averages to a combined price metric and then blending these results with specific coefficients derived from an input factor.
The script accepts several user inputs that toggle the use of the T3 filter, select the buy signal method, and set parameters like lengths and volume factors for two variations of the T3 calculation. Two T3 lines, T3 and T32, are computed with different parameters, and their colors change dynamically (green/red for T3 and blue/purple for T32) based on whether the lines are trending upward or downward. Depending on the selected signal method, the script generates buy signals either when T32 crosses over T3 or when the closing price is above T3, and similarly, sell signals are generated on the respective conditions for crossing under or closing below. Finally, the indicator plots the T3 lines on the chart, adds visual buy/sell markers, and sets alert conditions to notify users when the respective trading signals occur.
The user has the ability to tune the parameters using TP/SL, date timerames for analyses, and the actual parameters of the T3 function including the buy/sell signal! Lastly, the user has the option of trading this long, short, or both!
Let me know your thoughts and check out the backtest report!

Statistical Arbitrage Pairs Trading - Long-Side OnlyThis strategy implements a simplified statistical arbitrage (" stat arb ") approach focused on mean reversion between two correlated instruments. It identifies opportunities where the spread between their normalized price series (Z-scores) deviates significantly from historical norms, then executes long-only trades anticipating reversion to the mean.
Key Mechanics:
1. Spread Calculation: The strategy computes Z-scores for both instruments to normalize price movements, then tracks the spread between these Z-scores.
2. Modified Z-Score: Uses a robust measure combining the median and Median Absolute Deviation (MAD) to reduce outlier sensitivity.
3. Entry Signal: A long position is triggered when the spread’s modified Z-score falls below a user-defined threshold (e.g., -1.0), indicating extreme undervaluation of the main instrument relative to its pair.
4. Exit Signal: The position closes automatically when the spread reverts to its historical mean (Z-score ≥ 0).
Risk management:
Trades are sized as a percentage of equity (default: 10%).
Includes commissions and slippage for realistic backtesting.

Phase Cross Strategy with Zone### Introduction to the Strategy
Welcome to the **Phase Cross Strategy with Zone and EMA Analysis**. This strategy is designed to help traders identify potential buy and sell opportunities based on the crossover of smoothed oscillators (referred to as "phases") and exponential moving averages (EMAs). By combining these two methods, the strategy offers a versatile tool for both trend-following and short-term trading setups.
### Key Features
1. **Phase Cross Signals**:
- The strategy uses two smoothed oscillators:
- **Leading Phase**: A simple moving average (SMA) with an upward offset.
- **Lagging Phase**: An exponential moving average (EMA) with a downward offset.
- Buy and sell signals are generated when these phases cross over or under each other, visually represented on the chart with green (buy) and red (sell) labels.
2. **Phase Zone Visualization**:
- The area between the two phases is filled with a green or red zone, indicating bullish or bearish conditions:
- Green zone: Leading phase is above the lagging phase (potential uptrend).
- Red zone: Leading phase is below the lagging phase (potential downtrend).
3. **EMA Analysis**:
- Includes five commonly used EMAs (13, 26, 50, 100, and 200) for additional trend analysis.
- Crossovers of the EMA 13 and EMA 26 act as secondary buy/sell signals to confirm or enhance the phase-based signals.
4. **Customizable Parameters**:
- You can adjust the smoothing length, source (price data), and offset to fine-tune the strategy for your preferred trading style.
### What to Pay Attention To
1. **Phases and Zones**:
- Use the green/red phase zone as an overall trend guide.
- Avoid taking trades when the phases are too close or choppy, as it may indicate a ranging market.
2. **EMA Trends**:
- Align your trades with the longer-term trend shown by the EMAs. For example:
- In an uptrend (price above EMA 50 or EMA 200), prioritize buy signals.
- In a downtrend (price below EMA 50 or EMA 200), prioritize sell signals.
3. **Signal Confirmation**:
- Consider combining phase cross signals with EMA crossovers for higher-confidence trades.
- Look for confluence between the phase signals and EMA trends.
4. **Risk Management**:
- Always set stop-loss and take-profit levels to manage risk.
- Use the phase and EMA zones to estimate potential support/resistance areas for exits.
5. **Whipsaws and False Signals**:
- Be cautious in low-volatility or sideways markets, as the strategy may generate false signals.
- Use additional indicators or filters to avoid entering trades during unclear market conditions.
### How to Use
1. Add the strategy to your chart in TradingView.
2. Adjust the input settings (e.g., smoothing length, offsets) to suit your trading preferences.
3. Enable the strategy tester to evaluate its performance on historical data.
4. Combine the signals with your own analysis and risk management plan for best results.
This strategy is a versatile tool, but like any trading method, it requires proper understanding and discretion. Always backtest thoroughly and trade with discipline. Let me know if you need further assistance or adjustments to the strategy!

Unlock the Power of Seasonality: Monthly Performance StrategyThe Monthly Performance Strategy leverages the power of seasonality—those cyclical patterns that emerge in financial markets at specific times of the year. From tax deadlines to industry-specific events and global holidays, historical data shows that certain months can offer strong opportunities for trading. This strategy was designed to help traders capture those opportunities and take advantage of recurring market patterns through an automated and highly customizable approach.
The Inspiration Behind the Strategy:
This strategy began with the idea that market performance is often influenced by seasonal factors. Historically, certain months outperform others due to a variety of reasons, like earnings reports, holiday shopping, or fiscal year-end events. By identifying these periods, traders can better time their market entries and exits, giving them an advantage over those who solely rely on technical indicators or news events.
The Monthly Performance Strategy was built to take this concept and automate it. Instead of manually analyzing market data for each month, this strategy enables you to select which months you want to focus on and then executes trades based on predefined rules, saving you time and optimizing the performance of your trades.
Key Features:
Customizable Month Selection: The strategy allows traders to choose specific months to test or trade on. You can select any combination of months—for example, January, July, and December—to focus on based on historical trends. Whether you’re targeting the historically strong months like December (often driven by the 'Santa Rally') or analyzing quieter months for low volatility trades, this strategy gives you full control.
Automated Monthly Entries and Exits: The strategy automatically enters a long position on the first day of your selected month(s) and exits the trade at the beginning of the next month. This makes it perfect for traders who want to benefit from seasonal patterns without manually monitoring the market. It ensures precision in entering and exiting trades based on pre-set timeframes.
Re-entry on Stop Loss or Take Profit: One of the standout features of this strategy is its ability to re-enter a trade if a position hits the stop loss (SL) or take profit (TP) level during the selected month. If your trade reaches either a SL or TP before the month ends, the strategy will automatically re-enter a new trade the next trading day. This feature ensures that you capture multiple trading opportunities within the same month, instead of exiting entirely after a successful or unsuccessful trade. Essentially, it keeps your capital working for you throughout the entire month, not just when conditions align perfectly at the beginning.
Built-in Risk Management: Risk management is a vital part of this strategy. It incorporates an Average True Range (ATR)-based stop loss and take profit system. The ATR helps set dynamic levels based on the market’s volatility, ensuring that your stops and targets adjust to changing market conditions. This not only helps limit potential losses but also maximizes profit potential by adapting to market behavior.
Historical Performance Testing: You can backtest this strategy on any period by setting the start year. This allows traders to analyze past market data and optimize their strategy based on historical performance. You can fine-tune which months to trade based on years of data, helping you identify trends and patterns that provide the best trading results.
Versatility Across Asset Classes: While this strategy can be particularly effective for stock market indices and sector rotation, it’s versatile enough to apply to other asset classes like forex, commodities, and even cryptocurrencies. Each asset class may exhibit different seasonal behaviors, allowing you to explore opportunities across various markets with this strategy.
How It Works:
The trader selects which months to test or trade, for example, January, April, and October.
The strategy will automatically open a long position on the first trading day of each selected month.
If the trade hits either the take profit or stop loss within the month, the strategy will close the current position and re-enter a new trade on the next trading day, provided the month has not yet ended. This ensures that the strategy continues to capture any potential gains throughout the month, rather than stopping after one successful trade.
At the start of the next month, the position is closed, and if the next month is also selected, a new trade is initiated following the same process.
Risk Management and Dynamic Adjustments:
Incorporating risk management with this strategy is as easy as turning on the ATR-based system. The strategy will automatically calculate stop loss and take profit levels based on the market’s current volatility, adjusting dynamically to the conditions. This ensures that the risk is controlled while allowing for flexibility in capturing profits during both high and low volatility periods.
Maximizing the Seasonal Edge:
By automating entries and exits based on specific months and combining that with dynamic risk management, the Ultimate Monthly Performance Strategy takes advantage of seasonal patterns without requiring constant monitoring. The added re-entry feature after hitting a stop loss or take profit ensures that you are always in the game, maximizing your chances to capture profitable trades during favorable seasonal periods.
Who Can Benefit from This Strategy?
This strategy is perfect for traders who:
Want to exploit the predictable, recurring patterns that occur during specific months of the year.
Prefer a hands-off, automated trading approach that allows them to focus on other aspects of their portfolio or life.
Seek to manage risk effectively with ATR-based stop losses and take profits that adjust to market conditions.
Appreciate the ability to re-enter trades when a take profit or stop loss is hit within the month, ensuring that they don't miss out on multiple opportunities during a favorable period.
In summary, the Ultimate Monthly Performance Strategy provides traders with a comprehensive tool to capitalize on seasonal trends, optimize their trading opportunities throughout the year, and manage risk effectively. The built-in re-entry system ensures you continue to benefit from the market even after hitting targets within the same month, making it a robust strategy for traders looking to maximize their edge in any market.
Risk Disclaimer:
Trading financial markets involves significant risk and may not be suitable for all investors. The Monthly Performance Strategy is designed to help traders identify seasonal trends, but past performance does not guarantee future results. It is important to carefully consider your risk tolerance, financial situation, and trading goals before using any strategy. Always use appropriate risk management and consult with a professional financial advisor if necessary. The use of this strategy does not eliminate the risk of losses, and traders should be prepared for the possibility of losing their entire investment. Be sure to test the strategy on a demo account before applying it in live markets.

Fibonacci-Only StrategyFibonacci-Only Strategy
This script is a custom trading strategy designed for traders who leverage Fibonacci retracement levels to identify potential trade entries and exits. The strategy is versatile, allowing users to trade across multiple timeframes, with built-in options for dynamic stop loss, trailing stops, and take profit levels.
Key Features:
Custom Fibonacci Levels:
This strategy calculates three specific Fibonacci retracement levels: 19%, 82.56%, and the reverse 19% level. These levels are used to identify potential areas of support and resistance where price reversals or breaks might occur.
The Fibonacci levels are calculated based on the highest and lowest prices within a 100-bar period, making them dynamic and responsive to recent market conditions.
Dynamic Entry Conditions:
Touch Entry: The script enters long or short positions when the price touches specific Fibonacci levels and confirms the move with a bullish (for long) or bearish (for short) candle.
Break Entry (Optional): If the "Use Break Strategy" option is enabled, the script can also enter positions when the price breaks through Fibonacci levels, providing more aggressive entry opportunities.
Stop Loss Management:
The script offers flexible stop loss settings. Users can choose between a fixed percentage stop loss or an ATR-based stop loss, which adjusts based on market volatility.
The ATR (Average True Range) stop loss is multiplied by a user-defined factor, allowing for tailored risk management based on market conditions.
Trailing Stop Mechanism:
The script includes an optional trailing stop feature, which adjusts the stop loss level as the market moves in favor of the trade. This helps lock in profits while allowing the trade to run if the trend continues.
The trailing stop is calculated as a percentage of the difference between the entry price and the current market price.
Multiple Take Profit Levels:
The strategy calculates seven take profit levels, each at incremental percentages above (for long trades) or below (for short trades) the entry price. This allows for gradual profit-taking as the market moves in the trade's favor.
Each take profit level can be customized in terms of the percentage of the position to be closed, providing precise control over exit strategies.
Strategy Backtesting and Results:
Realistic Backtesting:
The script has been backtested with realistic account sizes, commission rates, and slippage settings to ensure that the results are applicable to actual trading scenarios.
The backtesting covers various timeframes and markets to ensure the strategy's robustness across different trading environments.
Default Settings:
The script is published with default settings that have been optimized for general use. These settings include a 15-minute timeframe, a 1.0% stop loss, a 2.0 ATR multiplier for stop loss, and a 1.5% trailing stop.
Users can adjust these settings to better fit their specific trading style or the market they are trading.
How It Works:
Long Entry Conditions:
The strategy enters a long position when the price touches the 19% Fibonacci level (from high to low) or the reverse 19% level (from low to high) and confirms the move with a bullish candle.
If the "Use Break Strategy" option is enabled, the script will also enter a long position when the price breaks below the 19% Fibonacci level and then moves back up, confirming the break with a bullish candle.
Short Entry Conditions:
The strategy enters a short position when the price touches the 82.56% Fibonacci level and confirms the move with a bearish candle.
If the "Use Break Strategy" option is enabled, the script will also enter a short position when the price breaks above the 82.56% Fibonacci level and then moves back down, confirming the break with a bearish candle.
Stop Loss and Take Profit Logic:
The stop loss for each trade is calculated based on the selected method (fixed percentage or ATR-based). The strategy then manages the trade by either trailing the stop or taking profit at predefined levels.
The take profit levels are set at increments of 0.5% above or below the entry price, depending on whether the position is long or short. The script gradually exits the trade as these levels are hit, securing profits while minimizing risk.
Usage:
For Fibonacci Traders:
This script is ideal for traders who rely on Fibonacci retracement levels to find potential trade entries and exits. The script automates the process, allowing traders to focus on market analysis and decision-making.
For Trend and Swing Traders:
The strategy's flexibility in handling both touch and break entries makes it suitable for trend-following and swing trading strategies. The multiple take profit levels allow traders to capture profits in trending markets while managing risk.
Important Notes:
Originality: This script uniquely combines Fibonacci retracement levels with dynamic stop loss management and multiple take profit levels. It is not just a combination of existing indicators but a thoughtful integration designed to enhance trading performance.
Disclaimer: Trading involves risk, and it is crucial to test this script in a demo account or through backtesting before applying it to live trading. Users should ensure that the settings align with their individual risk tolerance and trading strategy.
