Trendline Breakouts With Volume Strength [TradeDots]Trendline Breakouts With Volume Strength is an innovative indicator designed to identify potential market turning points using pivot-based trendline detection and volume confirmation. By merging dynamic trendline analysis with multi-tiered volume filters, this tool helps traders quickly spot breakouts or breakdowns that may signal significant shifts in price action.
📝 HOW IT WORKS
1. Pivot-Based Trendline Detection
The script automatically scans for recent pivot highs and lows over a user-defined lookback period.
When it finds higher pivot lows, it plots green uptrend lines; when it finds lower pivot highs, it plots red downtrend lines.
These dynamic lines update as new pivots form, providing continuously refreshed trend guidance.
2. Volume Ratio Analysis
A moving average of volume is compared against the current bar’s volume to calculate a ratio (e.g., 1.5×, 2×).
Higher ratios suggest above-average volume, often interpreted as stronger participation.
The script applies color-coded cues to highlight the intensity of volume surges.
3. Breakout & Breakdown Detection
Each trendline is monitored for a defined “break threshold,” which helps avoid minor penetrations that can trigger premature signals.
When price closes beyond a threshold below an uptrend line, the indicator labels it a “BREAKDOWN.” If it closes above a threshold on a downtrend line, it labels it a “BREAKOUT.”
Volume surges accompanying these breaks are highlighted with contextual emojis and distinct color gradients for quick visual reference.
4. Trend Direction Table
A small on-chart table provides a snapshot of the current market trend—Uptrend, Downtrend, or Sideways—based on a simple moving average slope and the number of active uptrend or downtrend lines.
This table also displays quick stats on how many lines are actively tracked, helping traders assess the broader market posture at a glance.
🛠️ HOW TO USE
1. Choose a Timeframe
This script works on multiple timeframes. Intraday traders can monitor minute or hourly charts for frequent pivot updates, while swing and position traders may prefer daily or weekly intervals to reduce noise.
2. Observe Trendlines & Labels
Watch for newly drawn green/red lines connecting pivots.
When you see a “BREAKOUT” or “BREAKDOWN” label, confirm whether volume was abnormally high based on the ratio or color-coded bars.
3. Consult the Trend Table
Use the table in the bottom-right corner to quickly check if the market is trending or range-bound.
Look at the count of active uptrend vs. downtrend lines to gauge broader sentiment.
4. Employ Additional Analysis
Combine these signals with other tools (e.g., candlestick patterns, oscillators, or fundamental analysis).
Validate potential breakouts using standard techniques like retests or support/resistance checks.
❗️LIMITATIONS
Delayed Pivots: Trendlines only adjust once new pivot highs or lows form, which can introduce a slight lag in highly volatile environments.
Choppy Markets: Rapid, back-and-forth price moves may produce conflicting trendline signals and frequent breakouts/breakdowns.
Volume Data Reliability: Gaps in volume data or unusual market conditions (holidays, low-liquidity sessions) can skew ratio readings.
RISK DISCLAIMER
Trading any financial instrument involves substantial risk, and this indicator does not guarantee profits or prevent losses. All signals and visual cues are for educational and informational purposes only; past performance does not assure future outcomes. You retain full responsibility for your trading decisions, including proper risk management, position sizing, and the use of additional confirmation methods. Always consider the possibility of losing some or all of your original investment.
Tradedots

Options Volatility Strategy Analyzer [TradeDots]The Options Volatility Strategy Analyzer is a specialized tool designed to help traders assess market conditions through a detailed examination of historical volatility, market benchmarks, and percentile-based thresholds. By integrating multiple volatility metrics (including VIX and VIX9D) with color-coded regime detection, the script provides users with clear, actionable insights for selecting appropriate options strategies.
📝 HOW IT WORKS
1. Historical Volatility & Percentile Calculations
Annualized Historical Volatility (HV): The script automatically computes the asset’s historical volatility using log returns over a user-defined period. It then annualizes these values based on the chart’s timeframe, helping you understand the asset’s typical volatility profile.
Dynamic Percentile Ranks: To gauge where the current volatility level stands relative to past behavior, historical volatility values are compared against short, medium, and long lookback periods. Tracking these percentile ranks allows you to quickly see if volatility is high or low compared to historical norms.
2. Multi-Market Benchmark Comparison
VIX and VIX9D Integration: The script tracks market volatility through the VIX and VIX9D indices, comparing them to the asset’s historical volatility. This reveals whether the asset’s volatility is outpacing, lagging, or remaining in sync with broader market volatility conditions.
Market Context Analysis: A built-in term-structure check can detect market stress or relative calm by measuring how VIX compares to shorter-dated volatility (VIX9D). This helps you decide if the present environment is risk-prone or relatively stable.
3. Volatility Regime Detection
Color-Coded Background: The analyzer assigns a volatility regime (e.g., “High Asset Vol,” “Low Asset Vol,” “Outpacing Market,” etc.) based on current historical volatility percentile levels and asset vs. market ratios. A color-coded background highlights the regime, enabling traders to quickly interpret the market’s mood.
Alerts on Regime Changes & Spikes: Automated alerts warn you about any significant expansions or contractions in volatility, allowing you to react swiftly in changing conditions.
4. Strategy Forecast Table
Real-Time Strategy Suggestions: At the close of each bar, an on-chart table generates suggested options strategies (e.g., selling premium in high volatility or buying premium in low volatility). These suggestions provide a quick summary of potential tactics suited to the current regime.
Contextual Market Data: The table also displays key statistics, such as VIX levels, asset historical volatility percentile, or ratio comparisons, helping you confirm whether volatility conditions warrant more conservative or more aggressive strategies.
🛠️ HOW TO USE
1. Select Your Timeframe: The script supports multiple timeframes. For short-term trading, intraday charts often reveal faster shifts in volatility. For swing or position trading, daily or weekly charts may be more stable and produce fewer false signals.
2. Check the Volatility Regime: Observe the background color and on-chart labels to identify the current regime (e.g., “HIGH ASSET VOL,” “LOW VOL + LAGGING,” etc.).
3. Review the Forecast Table: The table suggests strategy ideas (e.g., iron condors, long straddles, ratio spreads) depending on whether volatility is elevated, subdued, or spiking. Use these as a starting point for designing trades that match your risk tolerance.
4. Combine with Additional Analysis: For optimal results, confirm signals with your broader trading plan, technical tools (moving averages, price action), and fundamental research. This script is most effective when viewed as one component in a comprehensive decision-making process.
❗️LIMITATIONS
Directional Neutrality: This indicator analyzes volatility environments but does not predict price direction (up/down). Traders must combine with directional analysis for complete strategy selection.
Late or Missed Signals: Since all calculations require a bar to close, sharp intrabar volatility moves may not appear in real-time.
False Positives in Choppy Markets: Rapid changes in percentile ranks or VIX movements can generate conflicting or premature regime shifts.
Data Sensitivity: Accuracy depends on the availability and stability of volatility data. Significant gaps or unusual market conditions may skew results.
Market Correlation Assumptions: The system assumes assets generally correlate with S&P 500 volatility patterns. May be less effective for:
Small-cap stocks with unique volatility drivers
International stocks with different market dynamics
Sector-specific events disconnected from broad market
Cryptocurrency-related assets with independent volatility patterns
RISK DISCLAIMER
Options trading involves substantial risk and is not suitable for all investors. Options strategies can result in significant losses, including the total loss of premium paid. The complexity of options strategies requires thorough understanding of the risks involved.
This indicator provides volatility analysis for educational and informational purposes only and should not be considered as investment advice. Past volatility patterns do not guarantee future performance. Market conditions can change rapidly, and volatility regimes may shift without warning.
No trading system can guarantee profits, and all trading involves the risk of loss. The indicator's regime classifications and strategy suggestions should be used as part of a comprehensive trading plan that includes proper risk management, directional analysis, and consideration of broader market conditions.

Session-Based Sentiment Oscillator [TradeDots]Track, analyze, and monitor market sentiment across global trading sessions with this advanced multi-session sentiment analysis tool. This script provides session-specific sentiment readings for Asian (Tokyo), European (London), and US (New York) markets, combining price action, volume analysis, and volatility factors into a comprehensive sentiment oscillator. It is an original indicator designed to help traders understand regional market psychology and capitalize on cross-session sentiment shifts directly on TradingView.
📝 HOW IT WORKS
1. Multi-Component Sentiment Engine
Price Action Momentum : Calculates normalized price movement relative to recent trading ranges, providing directional sentiment readings.
Volume-Weighted Analysis : When volume data is available, incorporates volume flow direction to validate price-based sentiment signals.
Volatility-Adjusted Factors : Accounts for changing market volatility conditions by comparing current ATR against historical averages.
Weighted Combination : Merges all components using optimized weightings (Price: 1.0, Volume: 0.3, Volatility: 0.2) for balanced sentiment readings.
2. Session-Segregated Tracking
Automatic Session Detection : Precisely identifies active trading sessions based on user-configured time parameters.
Independent Calculations : Maintains separate sentiment accumulation for each major session, updated only during respective active hours.
Historical Preservation : Stores session-specific sentiment values even when sessions are closed, enabling cross-session comparison.
Real-Time Updates : Continuously processes sentiment during active sessions while preserving inactive session data.
3. Cross-Session Transition Analysis
Sentiment Differential Detection : Monitors sentiment changes when transitioning between trading sessions.
Configurable Thresholds : Generates signals only when sentiment shifts exceed user-defined minimum thresholds.
Directional Signals : Provides distinct bullish and bearish transition alerts with visual markers.
Smart Filtering : Applies smoothing algorithms to reduce false signals from minor sentiment variations.
⚙️ KEY FEATURES
1. Session-Specific Dashboard
Real-Time Status Display : Shows current session activity (ACTIVE/CLOSED) for all three major sessions.
Sentiment Percentages : Displays precise sentiment readings as percentages for easy interpretation.
Strength Classification : Automatically categorizes sentiment as HIGH (>50%), MEDIUM (20-50%), or LOW (<20%).
Customizable Positioning : Place dashboard in any corner with adjustable size options.
2. Advanced Signal Generation
Transition Alerts : Triangle markers indicate significant sentiment shifts between sessions.
Extreme Conditions : Diamond markers highlight overbought/oversold threshold breaches.
Configurable Sensitivity : Adjust signal thresholds from 0.05 to 0.50 based on trading style.
Alert Integration : Built-in TradingView alert conditions for automated notifications.
3. Forex Currency Strength Analysis
Base/Quote Decomposition : For forex pairs, separates sentiment into individual currency strength components.
Major Currency Support : Analyzes USD, EUR, GBP, JPY, CHF, CAD, AUD, NZD strength relationships.
Relative Strength Display : Shows which currency is driving pair movement during active sessions.
4. Visual Enhancement System
Session Background Colors : Distinct background shading for each active trading session.
Overbought/Oversold Zones : Configurable extreme sentiment level visualization with colored zones.
Multi-Timeframe Compatibility : Works across all timeframes while maintaining session accuracy.
Customizable Color Schemes : Full color customization for dashboard, signals, and plot elements.
🚀 HOW TO USE IT
1. Add the Script
Search for "Session-Based Sentiment Oscillator " in the Indicators tab or manually add it to your chart. The indicator will appear in a separate pane below your main chart.
2. Configure Session Times
Asian Session : Set Tokyo market hours (default: 00:00-09:00) based on your chart timezone.
European Session : Configure London market hours (default: 07:00-16:00) for European analysis.
US Session : Define New York market hours (default: 13:00-22:00) for American markets.
Timezone Adjustment : Ensure session times match your broker's specifications and account for daylight saving changes.
3. Optimize Analysis Parameters
Sentiment Period : Choose 5-50 bars (default: 14) for sentiment calculation lookback period.
Smoothing Settings : Select 1-10 bars smoothing (default: 3) with SMA, EMA, or RMA options.
Component Selection : Enable/disable volume analysis, price action, and volatility factors based on available data.
Signal Sensitivity : Adjust threshold from 0.05-0.50 (default: 0.15) for transition signal generation.
4. Interpret Readings and Signals
Positive Values : Indicate bullish sentiment for the active session.
Negative Values : Suggest bearish sentiment conditions.
Dashboard Status : Monitor which session is currently active and their respective sentiment strengths.
Transition Signals : Watch for triangle markers indicating significant cross-session sentiment changes.
Extreme Alerts : Note diamond markers when sentiment reaches overbought (>70%) or oversold (<-70%) levels.
5. Set Up Alerts
Configure TradingView alerts for:
- Bullish session transitions
- Bearish session transitions
- Overbought condition alerts
- Oversold condition alerts
❗️LIMITATIONS
1. Data Dependency
Volume Requirements : Volume-based analysis only functions when volume data is provided by your broker. Many forex brokers do not supply reliable volume data.
Price Action Focus : In absence of volume data, sentiment calculations rely primarily on price movement and volatility factors.
2. Session Time Sensitivity
Manual Adjustment Required : Session times must be manually updated for daylight saving time changes.
Broker Variations : Different brokers may have slightly different session definitions requiring time parameter adjustments.
3. Ranging Market Limitations
Trend Bias : Sentiment calculations may be less reliable during extended sideways or low-volatility market conditions.
Lag Consideration : As with all sentiment indicators, readings may lag during rapid market transitions.
4. Regional Market Focus
Major Session Coverage : Designed primarily for major global sessions; may not capture sentiment from smaller regional markets.
Weekend Gaps : Does not account for weekend gap effects on sentiment calculations.
⚠️ RISK DISCLAIMER
Trading and investing carry significant risk and can result in financial loss. The "Session-Based Sentiment Oscillator " is provided for informational and educational purposes only. It does not constitute financial advice.
- Always conduct your own research and analysis
- Use proper risk management and position sizing in all trades
- Past sentiment patterns do not guarantee future market behavior
- Combine this indicator with other technical and fundamental analysis tools
- Consider overall market context and your personal risk tolerance
This script is an original creation by TradeDots, published under the Mozilla Public License 2.0.
Session-based sentiment analysis should be used as part of a comprehensive trading strategy. No single indicator can predict market movements with certainty. Exercise proper risk management and maintain realistic expectations about indicator performance across varying market conditions.

ETF Builder & Backtest System [TradeDots]Create, analyze, and monitor your own custom “ETF-like” portfolio directly on TradingView. This script merges up to 10 different assets with user-defined weightings into a single composite chart, allowing you to see how your personalized portfolio would have performed historically. It is an original tool designed to help traders and investors quickly gauge risk and return profiles without leaving the TradingView platform.
📝 HOW IT WORKS
1. Custom Portfolio Construction
Multiple Assets : Combine up to 10 different stocks, ETFs, cryptocurrencies, or other symbols.
User-Defined Weights : Allocate each asset a percentage weight (e.g., 15% in AAPL, 10% in MSFT, etc.).
Single Composite Value : The script calculates a weighted “ETF-style” price, effectively simulating a merged portfolio curve on your chart.
2. Performance Tracking & Return Analysis
Automatic History Capture : The indicator records each asset’s starting price when it first appears in your chosen date range.
Rolling Updates : As time progresses, all asset prices are continually evaluated and the portfolio value is updated in real time.
Buy & Hold Returns : See how each asset—and the overall portfolio—performed from the “start” date to the most recent bar.
Annualized Return : Automatically calculates CAGR (Compound Annual Growth Rate) to help visualize performance over varying timescales.
3. Table & Visual Output
Performance Table : A comprehensive table displays individual asset returns, annualized returns, and portfolio totals.
Normalized Chart Plot : The composite ETF value is scaled to 100 at the start date, making it easy to compare relative growth or decline.
Optional Time Filter : You can define a specific date range (Start/End Dates) to focus on a particular period or to limit historical data.
⚙️ KEY FEATURES
1. Flexible Asset Selection
Choose any symbols from multiple asset classes. The script will only run calculations when data is available—no need to worry about missing quotes.
2. Dynamic Table Reporting
Start Price for each asset
Percentage Weight in the portfolio
Total Return (%) and Annualized Return (%)
3. Simple Backtesting Logic
This script takes a straightforward Buy & Hold perspective. Once the start date is reached, the portfolio remains static until the end date, so you can quickly assess hypothetical growth.
4. Plot Customization
Toggle the main “ETF” plot on/off.
Alter the visual style for tables and text.
Adjust the time filter to limit or extend your performance measurement window.
🚀 HOW TO USE IT
1. Add the Script
Search for “ETF Builder & Backtest System ” in the Indicators & Strategies tab or manually add it to your chart after saving it in your Pine Editor.
2. Configure Inputs
Enable Time Filter : Choose whether to restrict the analysis to a particular date range.
Start & End Date : Define the period you want to measure performance over (e.g., from 2019-12-31 to 2025-01-01).
Assets & Weights : Enter each symbol and specify a percentage weight (up to 10 assets).
Display Options : Pick where you want the Table to appear and choose background/text colors.
3. Interpret the Table & Plots
Asset Rows : Each asset’s ticker, weighting, start price, and performance metrics.
ETF Total Row : Summarizes total weighting, composite starting value, and overall returns.
Normalized Plot : Tracks growth/decline of the combined portfolio, starting at 100 on the chart.
4. Refine Your Strategy
Compare how different weights or a new mix of assets would have performed over the same period.
Assess if certain assets contribute disproportionately to your returns or volatility.
Use the results to guide allocations in your real trading or paper trading accounts.
❗️LIMITATIONS
1. Buy & Hold Only
This script does not handle rebalancing or partial divestments. Once the portfolio starts, weights remain fixed throughout the chosen timeframe.
2. No Reinvestment Tracking
Dividends or other distributions are not factored into performance.
3. Data Availability
If historical data for a particular asset is unavailable on TradingView, related results may display as “N/A.”
4. Market Regimes & Volatility
Past performance does not guarantee similar future behavior. Markets can change rapidly, which may render historical backtests less predictive over time.
⚠️ RISK DISCLAIMER
Trading and investing carry significant risk and can result in financial loss. The “ETF Builder & Backtest System ” is provided for informational and educational purposes only. It does not constitute financial advice.
Always conduct your own research.
Use proper risk management and position sizing.
Past performance does not guarantee future results.
This script is an original creation by TradeDots, published under the Mozilla Public License 2.0.
Use this indicator as part of a broader trading or investment approach—consider fundamental and technical factors, overall market context, and personal risk tolerance. No trading tool can assure profits; exercise caution and responsibility in all financial decisions.

Price & Volume Breakout Fibonacci Probability [TradeDots]📝 OVERVIEW
The "Price & Volume Breakout Fibonacci Probability" indicator is designed to detect the probability of the maximum run-up and drawdown of each breakout trade on an asset, assisting traders in optimizing their take profit and stop loss strategies.
🧮 CALCULATIONS
The algorithm detects price and volume breakouts to activate the Fibonacci levels displayed on the chart. It calculates these levels using the period pivot high and low, with the close price of the breakout bar as the reference price.
The indicator then forward-tests within an user-selected number of bars, detecting the maximum run-up and drawdown during that period. Consequently, it calculates the probability of the price hitting either side of the Fibonacci levels, showing the likelihood of reaching take profit and stop loss targets for each breakout trade.
📊 EXAMPLE
The above example shows two breakout trades, circled within the yellow rectangle zone.
The first trade has a maximum run-up above the +0.382 Fibonacci level zone and a maximum drawdown below the -0.618 Fibonacci level zone.
When the price reaches the maximum run-up, it only has a ~45% probability of moving further upward into the last two zones (25% + 19.44%). This indicates that setting a take profit at a higher level may have less than a 50% chance of success.
Conversely, when the price reaches its maximum drawdown, there is only an ~8% probability of moving further downward into the last drawdown zone. This could indicate a potential reversal.
⚙️ SETTINGS
Breakout Condition: Determines the type of breakout condition to track: "Price", "Volume", "Price & Volume".
Backtest Period: The maximum run-up and drawdown are detected within this bar period.
Price Breakout Period: Specifies the number of bars the price needs to break out from.
Volume Breakout Period: Specifies the number of bars the volume needs to break out from.
Trendline Confirmation: Confirms that the close price needs to be above the trendline.
📈 HOW TO USE
By understanding the probabilities of price movements to both the upside and downside, traders can set take profit and stop loss targets with greater accuracy.
For instance, placing a stop loss order below the zone with the highest probability minimizes the chances of being stopped out of a profitable trade. Conversely, setting a take profit target at the zone with the highest probability increases the win rate.
Additionally, if the price breaches multiple Fibonacci levels during the breakout period, it may indicate an abnormal state, signaling a potential reversal or pullback. This can help traders exit trades in a timely manner.
Traders can adjust their take profit and stop loss levels based on their individual risk tolerance.
RISK DISCLAIMER
Trading entails substantial risk, and most day traders incur losses. All content, tools, scripts, articles, and education provided by TradeDots serve purely informational and educational purposes. Past performances are not definitive predictors of future results.

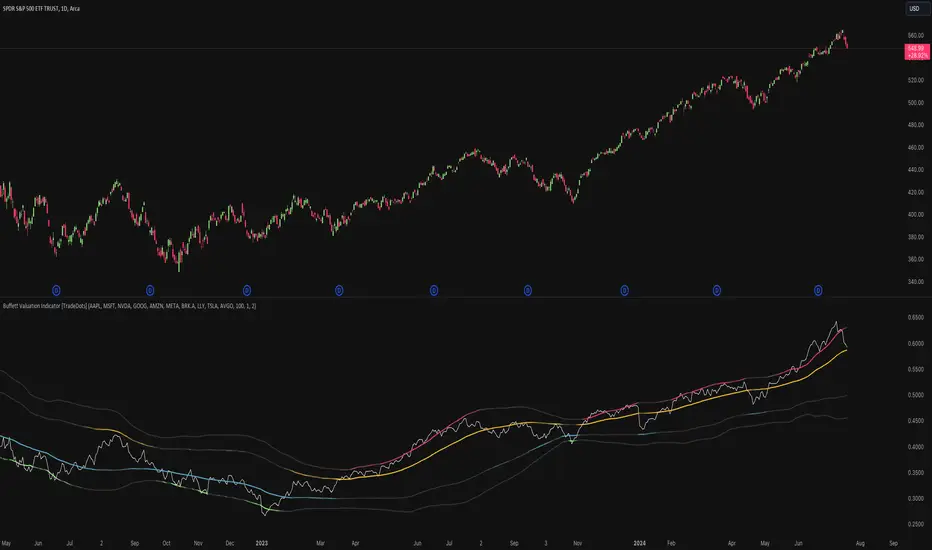
Buffett Valuation Indicator [TradeDots]The Buffett Valuation Indicator (also known as the Buffett Index or Buffett Ratio) measures the ratio of the total United States stock market to GDP.
This indicator helps determine whether the valuation changes in US stocks are justified by the GDP level.
For example, the ratio is calculated based on the standard deviations from the historical trend line. If the value exceeds +2 standard deviations, it suggests that the stock market is overvalued relative to GDP, and vice versa.
This "Buffett Valuation Indicator" is an enhanced version of the original indicator. It applies a Bollinger Band over the Valuation/GDP ratio to identify overvaluation and undervaluation across different timeframes, making it efficient for use in smaller timeframes, e.g. daily or even hourly intervals.
HOW DOES IT WORK
The Buffett Valuation Indicator measures the ratio between US stock valuation and US GDP, evaluating whether stock valuations are overvalued or undervalued in GDP terms.
In this version, the total valuation of the US stock market is represented by considering the top 10 market capitalization stocks.
Users can customize this list to include other stocks for a more balanced valuation ratio. Alternatively, users may use S&P 500 ETFs, such as SPY or VOO, as inputs.
The ratio is plotted as a line chart in a separate panel below the main chart. A Bollinger Band with a default 100-period and multiples of 1 and 2 is used to identify overvaluation and undervaluation.
For instance, if the ratio line moves above the +2 standard deviation line, it indicates that stocks are overvalued, signaling a potential selling opportunity.
APPLICATION
When the indicator is applied to a chart, we observe the ratio line's movements relative to the standard deviation lines. The further the line deviates from the standard deviation lines, the more extreme the overvaluation or undervaluation.
We look for buying opportunities when the Buffett Index moves below the first and second standard deviation lines and sell opportunities when it moves above these lines. This indicator is used as a microeconomic confirmation tool, in combination with other indicators, to achieve higher win-rate setups.
RISK DISCLAIMER
Trading entails substantial risk, and most day traders incur losses. All content, tools, scripts, articles, and education provided by TradeDots serve purely informational and educational purposes. Past performances are not definitive predictors of future results.
Tic Tac Toe Game [TradeDots]Feeling bored with trading?
Time to inject some fun into your decision-making process with our Tic Tac Toe Indicator!
The Tic Tac Toe game transforms your chart into a competitive playground where trading pairs face off in a classic game of Tic Tac Toe.
HOW TO PLAY
Our Tic Tac Toe game invites you to pit one trading pair against another directly on your chart. Choose the competitors and watch as they battle it out in a traditional grid setup.
Navigate to settings and select your competitor pair.
Choose who kicks off the game.
After the close of each new bar, the algorithm will utilize the closing prices of both symbols. These numbers feed into a random number generator which alternates the turns for placing marks on the grid.
The game progresses until one pair aligns three consecutive symbols and wins, or the board fills up. After that, the game resets every three bars, offering continual engagement during active market hours.
MANUAL PLAYING MODE
Currently, due to PineScript's limitations, a fully interactive manual mode is not supported, as all previous data will be lost with each new user input, preventing the replication of existing game states.
However, users can input a sequence at the start, guiding the placement of symbols throughout the game.
Stay tuned for future updates!

Multi Timeframe Trend Screener [TradeDots]The "Multi Timeframe Trend Screener" is a trading indicator designed to assist traders in identifying the market trends of multiple assets within a single panel. This tool is invaluable for detecting shifts in trends, enabling traders to easily adjust their strategies under different market conditions.
HOW DOES IT WORK
Upon initialization, the indicator requires users to input two key pieces of information:
The assets to be monitored.
The timeframes to be analyzed.
The tool is capable of simultaneously tracking up to four assets across five distinct timeframes.
By specifying the type and length of the moving average, the indicator uses this data as a baseline to determine the current market trend.
A price movement below the moving average triggers a downward trend symbol (📉), indicating bearish conditions.
Conversely, a movement above the moving average displays an upward trend symbol (📈), signaling bullish conditions.
The aggregation of moving averages across various timeframes provides a comprehensive view of the overall market sentiment.
APPLICATION
In scenarios where the market consistently demonstrates an upward trend, each timeframe will display a bullish symbol. Shifts in market sentiment typically start in the shorter timeframes and can progressively affect longer ones if the trend continues.
This cascading effect allows the indicator to show all timeframes transitioning to a bearish orientation when the trend reverses.
The indicator also facilitates comparison between different assets. For assets with high correlation, a trend shift in one can often predict similar movements in correlated assets, thus allowing traders to swiftly adapt their strategies to align with new market conditions.
RISK DISCLAIMER
Trading entails substantial risk, and most day traders incur losses. All content, tools, scripts, articles, and education provided by TradeDots serve purely informational and educational purposes. Past performances are not definitive predictors of future results.

Sector Rotation Hedging With Volatility Index [TradeDots]The "Sector Rotation Hedging Strategy With Volatility Index" is a comprehensive trading indicator developed to optimally leverage the S&P500 volatility index. It is designed to switch between distinct ETF sectors, strategically hedging to moderate risk exposure during harsh market volatility.
HOW DOES IT WORK
The core of this indicator is grounded on the S&P500 volatility index (VIX) close price and its 60-day moving average. This serves to determine whether the prevailing market volatility is above or below the quarterly average.
In periods of elevated market volatility, risk exposure escalates significantly. Traders retaining stocks in sectors with disproportionately high volatility face increased vulnerability to negative returns. To tackle this, our indicator employs a two-pronged approach utilizing two sequential candlestick close prices to confirm if volatility surpasses the average value.
Upon confirming above-average volatility, a hedging table is deployed to spotlight ETFs with low volatility, such as the Utilities Select Sector SPDR Fund (XLU), to derisk the overall portfolio.
Conversely, in low-volatility conditions, sectors yielding higher returns like the Technology Select Sector SPDR Fund (XLK) are preferred. The hedging table is utilized to earmark high-return sector ETFs.
Thus, during highly volatile market periods, the strategy recommends enhancing portfolio allocation to low-volatility ETFs. During low-volatility windows, the portfolio is calibrated towards high-volatility ETFs for heightened returns.
IMPORTANT CONSIDERATION
In real trading, additional considerations encompassing trading commissions, management fees, and ancillary rotation costs should be factored in. False signals may arise, potentially leading to losses from these fees.
RISK DISCLAIMER
Trading entails substantial risk, and most day traders incur losses. All content, tools, scripts, articles, and education provided by TradeDots serve purely informational and educational purposes. Past performances are not definitive predictors of future results.

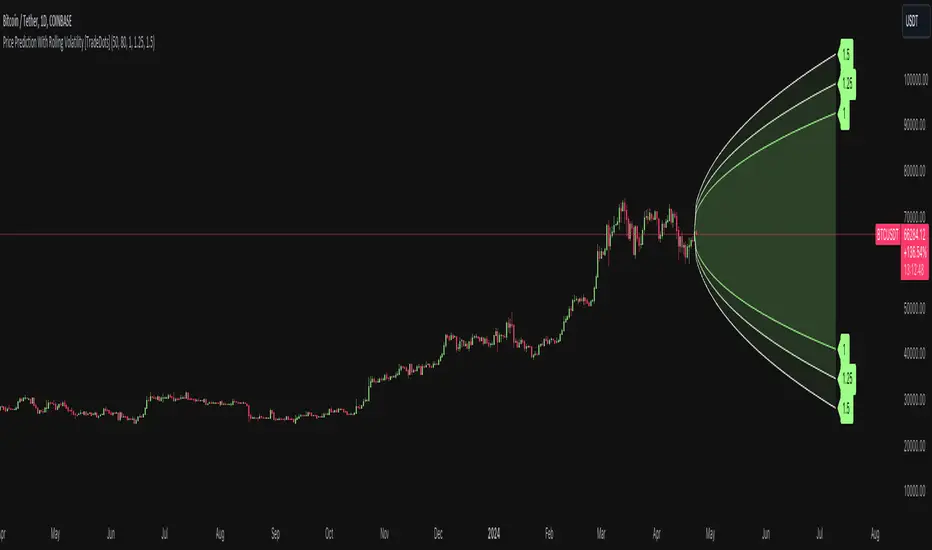
Price Prediction With Rolling Volatility [TradeDots]The "Price Prediction With Rolling Volatility" is a trading indicator that estimates future price ranges based on the volatility of price movements within a user-defined rolling window.
HOW DOES IT WORK
This indicator utilizes 3 types of user-provided data to conduct its calculations: the length of the rolling window, the number of bars projecting into the future, and a maximum of three sets of standard deviations.
Firstly, the rolling window. The algorithm amasses close prices from the number of bars determined by the value in the rolling window, aggregating them into an array. It then calculates their standard deviations in order to forecast the prospective minimum and maximum price values.
Subsequently, a loop is initiated running into the number of bars into the future, as dictated by the second parameter, to calculate the maximum price change in both the positive and negative direction.
The third parameter introduces a series of standard deviation values into the forecasting model, enabling users to dictate the volatility or confidence level of the results. A larger standard deviation correlates with a wider predicted range, thereby enhancing the probability factor.
APPLICATION
The purpose of the indicator is to provide traders with an understanding of the potential future movement of the price, demarcating maximum and minimum expected outcomes. For instance, if an asset demonstrates a substantial spike beyond the forecasted range, there's a significantly high probability of that price being rejected and reversed.
However, this indicator should not be the sole basis for your trading decisions. The range merely reflects the volatility within the rolling window and may overlook significant historical price movements. As with any trading strategies, synergize this with other indicators for a more comprehensive and reliable analysis.
Note: In instances where the number of predicted bars is exceedingly high, the lines may become scattered, presumably due to inherent limitations on the TradingView platform. Consequently, when applying three SD in your indicator, it is advised to limit the predicted bars to fewer than 80.
RISK DISCLAIMER
Trading entails substantial risk, and most day traders incur losses. All content, tools, scripts, articles, and education provided by TradeDots serve purely informational and educational purposes. Past performances are not definitive predictors of future results.
Bullish Candlestick Patterns With Filters [TradeDots]The "Bullish Candlestick Patterns With Filters" is a trading indicator that identifies 6 core bullish candlestick patterns. This is further enhanced by applying channel indicator as filters, designed to further increase the accuracy of the recognized patterns.
6 CANDLESTICK PATTERNS
Hammer
Inverted Hammer
Bullish Engulfing
The Piercing Line
The Morning Star
The 3 White Soldiers
SIGNAL FILTERING
The indicator incorporates with 2 primary methodologies aimed at filtering out lower accuracy signals.
Firstly, it comes with a "Lowest period" parameter that examines whether the trough of the bullish candlestick configuration signifies the lowest point within a specified retrospective bar length. The longer the period, the higher the probability that the price will rebound.
Secondly, the channel indicators, the Keltner Channels or Bollinger Bands. This indicator examines whether the lowest point of the bullish candlestick pattern breaches the lower band, indicating an oversold signal. Users have the flexibility to modify the length and band multiplier, enabling them to custom-tune signal sensitivity.
Without Filtering:
With Filtering
RISK DISCLAIMER
Trading entails substantial risk, and most day traders incur losses. All content, tools, scripts, articles, and education provided by TradeDots serve purely informational and educational purposes. Past performances are not definitive predictors of future results.
