Screener Potential 312 / 212 / 122Based on the teachings of Rob Smith
1= Inside Candle
2= Goes past the previous candle's price up or down
3= Goes past the previous candle's price on both sides
Ability to change the timeframe and the symbols this indicator is scanning through in the input tab under settings of this indicator. Maximum symbols 40.
Looking for short or long setups within 40 symbols. By default some symbols are entered in the indicator already. They cannot be left empty. If left empty, an error comes up and the script doesn't load.
The reversal setups this indicator is looking for
212
312
122
Can look through many timeframes like monthly, weekly, daily, intraday by changing the timeframe in the input tab under settings.
Default timeframe is set to 1 Day.
First label is for all of the symbols the indicator is scanning.
Second label is the result of the scan. Text is bigger than in this label than the first label to differentiate from the first label and for ease of use.
Please DM me on how to access this indicator.
Thestrat

Screener Inside BarsBased on the teachings of Rob Smith
1= Inside Candle
2= Goes past the previous candle's price up or down
3= Goes past the previous candle's price on both sides
Ability to change the timeframe and the symbols this indicator is scanning through in the input tab under settings of this indicator. Maximum symbols 40.
Looking for inside bars within 40 symbols. By default some symbols are entered in the indicator already. They cannot be left empty. If left empty, an error comes up and the script doesn't load.
By changing the timeframe, inside bars can be looked under many timeframes like Monthly, Weekly, Dialy, Intraday, etc.
First label is for all of the symbols the indicator is scanning.
Second label is the result of the scan. Text is bigger than in this label than the first label to differentiate from the first label and for ease of use.
Please DM me on how to access this indicator.

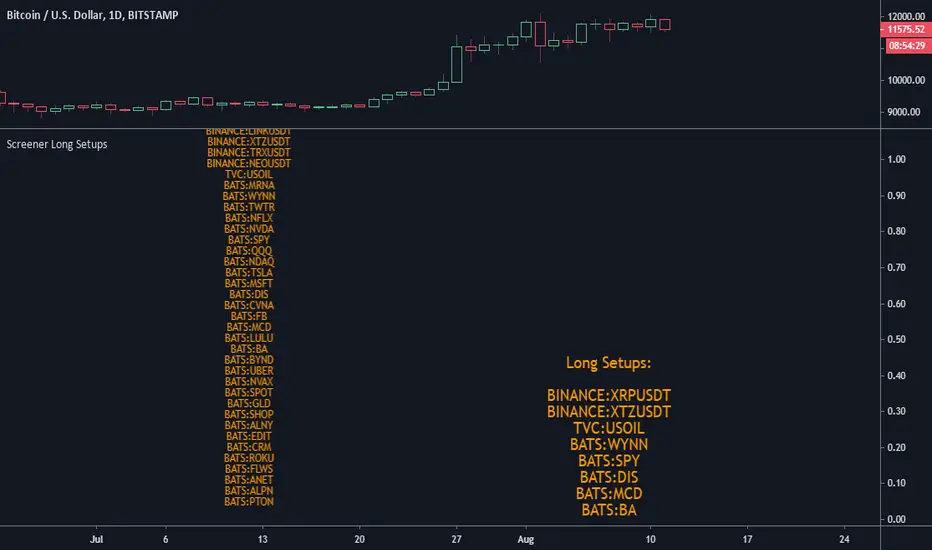
Screener Long SetupsBased on the teachings of Rob Smith
1= Inside Candle
2= Goes past the previous candle's price up or down
3= Goes past the previous candle's price on both sides
Ability to change the timeframe and the symbols this indicator is scanning through in the input tab under settings of this indicator. Maximum symbols 40.
Looking for long setups within 40 symbols. By default some symbols are entered in the indicator already. They cannot be left empty. If left empty, an error comes up and the script doesn't load.
Some of the reversal short setups this indicator is looking for
e.g.
212 = 2down 1inside 2up
22 = 2down 2up
33.. 3down 3up
etc
It is also looking for continuous setups as well
e.g.
22 = 2down 2down
212 = 2down 1inside 2down
etc
First label is for all of the symbols the indicator is scanning.
Second label is the result of the scan. Text is bigger than in this label than the first label to differentiate from the first label and for ease of use.
Please DM me on how to access this indicator.
Screener: Shorts SetupsBased on the teachings of Rob Smith
1= Inside Candle
2= Goes past the previous candle's price up or down
3= Goes past the previous candle's price on both sides
Ability to change the timeframe and the symbols this indicator is scanning through in the input tab under settings of this indicator. Maximum symbols 40.
Looking for short setups within 40 symbols. By default some symbols are entered in the indicator already. They cannot be left empty. If left empty, an error comes up and the script doesn't load.
Some of the reversal short setups this indicator is looking for
e.g.
212 = 2up 1inside 2down
22 = 2up 2down
33 = 3up 3down
etc
It's also looking for the continuous short setups as well
e.g.
212 = 2down 1inside 2down
22 = 2down 2down
etc
First label is for all of the symbols the indicator is scanning.
Second label is the result of the scan. Text is bigger than in this label than the first label to differentiate from the first label and for ease of use.
Please DM me on how to access this indicator.

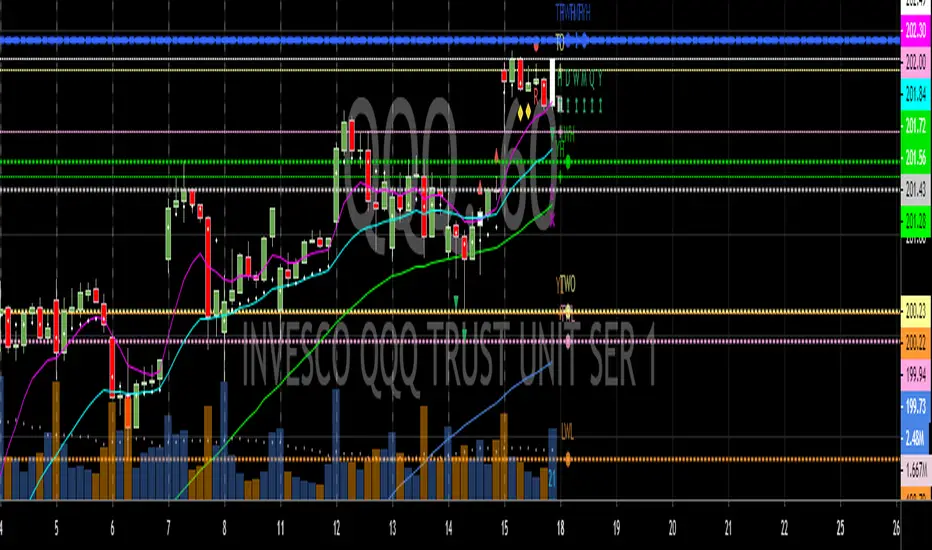
TheStratHelper-Short Reversalsbased on the teachings of Rob Smith
1= Inside Candle
2= Break on one side
3= Englufing Candle/Outside Candle
Identifies short setups like 212, 312, 122 and 22
My potential entry is marked with a green line and a label that tells you the price as well. I typically enter 1 or 2 cents belowthe marked entry.
My potential target (magnitude) is marked with yellow lines and a label that tells you the price as well.
212, 312 and 122 has entry and magnitudes marked. If there are multiple magnitudes, those are marked with yellow lines which has the price written right above them. The program looks at potentially 4 or 5 magnitudes.
No magnitudes marked for a reversal 22.
Most of the colors can be customized
PM me for more info on how to access this indicator

TheStratHelper-Long Reversalsbased on the teachings of Rob Smith
1= Inside Candle
2= Break on one side
3= Englufing Candle/Outside Candle
Identifies long setups like 212, 312, 122 and 22
My potential entry is marked with a green line and a label that tells you the price as well. I typically enter 1 or 2 cents above the marked entry.
My potential target (magnitude) is marked with yellow lines and a label that tells you the price as well.
212, 312 and 122 has entry and magnitudes marked. If there are multiple magnitudes, those are marked with yellow lines which has the price written right above them. The program looks at potentially 4 or 5 magnitudes.
No magnitudes marked for a reversal 22.
Most of the colors can be customized
PM me for more info on how to access this indicator

TheStratHelperbased on the teachings of Rob Smith
1= Inside Candle
2= Break on one side
3= Englufing Candle/Outside Candle
Identifies setups like 22, 212, 312, etc
RL=Reverse Long
CL=Continuous Long
RS= Reversal Short
CS=Continuous Short
It can highlight a potential 312 or 122 combination
FTFC=Full time frame continuity
1d is calculated by looking at Monthly, Weekly and Daily timeframe
Intraday is calculated by looking at Monthly, Weekly, Daily and Hourly
A bunch of alerts are available with different combinations including any long or short trade.
Continuous 22 only has the triangles. Nothing written
Most of the colors can be customized
Broadening formations are experimental and only plot using the outside candles
PM me for more info on how to access this indicator

TheStratHelperBased on Rob Smith's Quant Edge
CL = Continuation Long e.g. 2up 1inside 2up
RL = Reversal Long (Rev Strat) e.g. 2down 1inside 2up
CS = Continuation Short
RL = Reverse Long (Rev Strat)
Most of the signals have the combinations like 2-1-2,3-1-2,etc written beside CL/RL/CS/RL except for the continuation 2-2 long and short signals. Those i have them set as a purple triangle up or down without a text.
Signals do not wait for the candle close. They show up as soon as the current/signal candle goes over or under the previous candle.
You can set signals for any long, any short or only the reversals or inside out signals.
I have tried to make this as custom as possible. You can set custom colors and choose which signals to display or hide.
Disclaimer: This is not the full system. Use this indicator at your own risk. I advise you to learn TheStrat from Rob Smith. I may be missing some combinations or have something wrong. I encourage you to let me know if there is something missing or something I can improve upon. I am neither an expert in Pine Script or TheStrat but I'll do my best to accommodate any requests.

Candle Type w/2Up + 2Dn v2.0This script builds on Candle Type w/2Up + 2Dn by incorporating signals for inside + up, outside + up, + rev strat set-ups. All of these can be turned off if they compete w/ other indicators or just clutter up the chart.
Briefly, the script works based on #thestrat developed by Rob Smith and the 1-2-3 bar script coded by @Crinklebine. Candle Type w/2Up + 2Dn is a "fork" of @Crinklebine's excellent indicator. I find the visualization of U-D-I-O (up/dn/inside/outside candles) easier to scan through 100's of charts than 1-2-3's. This is just personal preference, but they work based on the exact same principles. Performance is enhanced with a trend filter like @boardriderb's "TC" script or similar timeframe continuity filters based on the #thestrat developed by Rob Smith. I also prefer an ATR-based trailing stop; Rob recommends pSAR for trailing stops.
Together these indicators form a power system, but users are still responsible for their own trade management, entries & exits, risk profiles, stop loss, etc.

Candle State (The Strat)This script identifies the 2 different Candle States for use in #TheStrat.
Candle Up - The close of the current candle is greater than the close of the previous candle.
Candle Down - The close of the current candle is less than the close of the previous candle.
Though this script is extremely simple it is a teaching aid for #TheStrat.
The script also assists in the identification of up and down candles with gaps where the color of candle will not always match the Candle State.
Analysis of the candle types can help you define actionable signals and draw broadening formations.
Disclaimer: All scripts from this account are for informational purposes only and do not produce buy or sell recommendations.
© 2020 Crinklebine

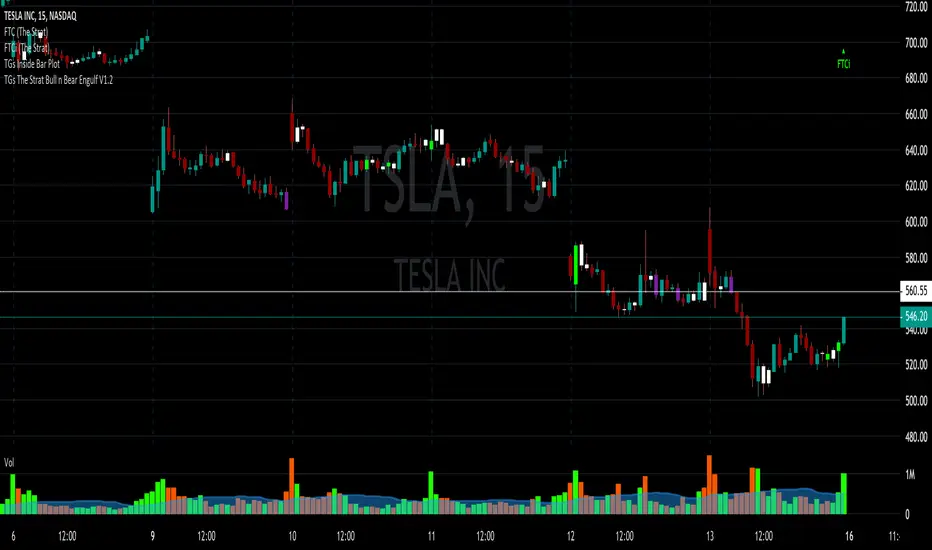
TGs The Strat Bull n Bear Engulf V1.2After accidentally violating house rules. I am republishing the script.
The script is based upon #TheStrat, which is Rob Smith's way of looking at price action.
It takes into account a candles ENTIRE range, wicks included.
So a Bullish candle (colored however you would like) when it closes will engulf the complete
range of the prior bar and indicate by painting the bar your color choice.
A Bearish will do the same.
In the Style menu, the first color will be the Bear color the second the Bull.
Any issues please let me know. Spread THE STRAT for all of mankind.
BB with5-10-50-100-200 SMA Daily and the StratThis script combines Bollinger bands with 5 different SMA (5,10,50,100,200) with indicators for when candles are inside day or outside day i.e the Rob Smith's 1 and 3 in "the Strat"

Multiple Timeframe LevelsBased on Rob Smith from T3Live's "The Strat" system.
Draws lines and labels for high/low of prior day, current day, prior week, current week, prior month, current month, prior year and current year.
Draws lines and labels for current day, week, month and year open.
Not recommended for those who have not completed Rob's course.
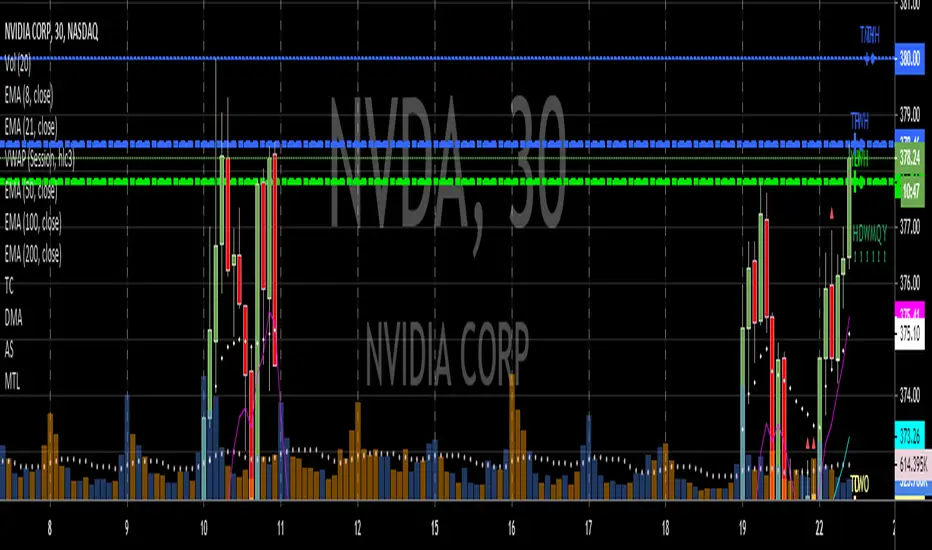
Timeframe ContinuityBased on Rob Smith from T3Live's "The Strat" system.
Places an indicator on the top right of the chart that shows if the current bar on the current or higher timeframe is red or green.
Allows the user to identify timeframe continuity or conflicting timeframes at a glance.
Not recommended for those who have not completed Rob's course.
Actionable SignalsBased on Rob Smith from T3Live's "The Strat" system.
Places symbols on inside bars, "Rev Strats", 3-1 "Chicago" setups, "Red Dog Reversals"
Allows creation of alerts for any actionable signal and reversal scenario.
Not recommended for those who have not completed Rob's course.