Thai Gold BahtIndicator Name: Thai Gold Baht
Short Title: Thai Gold Baht
Purpose
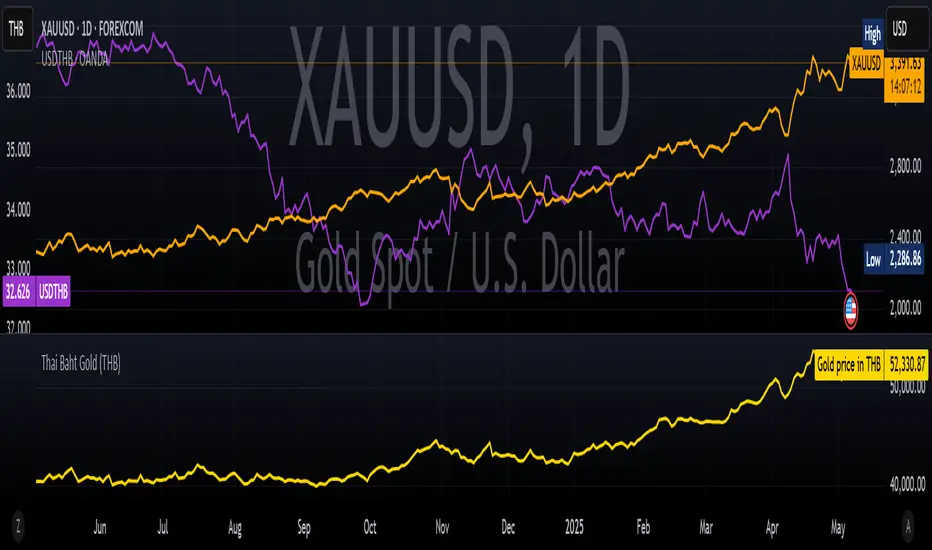
This indicator calculates and visualizes the real-time price of 1 Thai Gold Baht (15.244 grams) based on the global gold price ( XAU/USD ) and the USD/THB exchange rate .
Users can customize gold weight and purity to simulate the local Thai gold market price.
What it does
Retrieves live gold price per troy ounce in USD
Retrieves current USD to Thai Baht exchange rate
Converts the value using user-defined weight and purity
Displays result as a real-time chart
Shows calculation details in the Data Window
Ideal for
Traders tracking Thai gold based on international prices
Analysts comparing local and global bullion markets
Anyone needing a configurable, transparent gold price conversion
Pine Script Functionality
// Uses XAU/USD and USD/THB as inputs
// Calculates 1 Baht Gold (96.5% default purity)
// Outputs the value in THB as a chart line
ชื่ออินดิเคเตอร์: Thai Gold Baht
ชื่อย่อ: Thai Gold Baht
วัตถุประสงค์
อินดิเคเตอร์นี้ใช้คำนวณและแสดงราคาทองคำไทย 1 บาท (15.244 กรัม) แบบเรียลไทม์
โดยอ้างอิงจากราคาทองคำในตลาดโลก ( XAU/USD ) และอัตราแลกเปลี่ยน USD/THB
ผู้ใช้สามารถกำหนดน้ำหนักทองและความบริสุทธิ์เองได้ เพื่อจำลองราคาทองคำในประเทศไทยอย่างแม่นยำ
สิ่งที่อินดิเคเตอร์นี้ทำ
ดึงราคาทองคำแบบเรียลไทม์ต่อทรอยออนซ์ในสกุลเงิน USD
ดึงอัตราแลกเปลี่ยน USD → THB แบบเรียลไทม์
คำนวณราคาจากน้ำหนักและเปอร์เซ็นต์ความบริสุทธิ์ที่ผู้ใช้กำหนด
แสดงผลลัพธ์เป็นกราฟแบบเรียลไทม์ในหน่วยบาทไทย
แสดงรายละเอียดการคำนวณในหน้าต่าง Data Window ของ TradingView
เหมาะสำหรับ
นักเทรดที่ต้องการติดตามราคาทองคำไทยจากราคาทองคำตลาดโลก
นักวิเคราะห์ที่เปรียบเทียบราคาทองคำในประเทศและต่างประเทศ
ผู้ใช้งานที่ต้องการการแปลงราคาทองคำระหว่างประเทศให้โปร่งใสและปรับแต่งได้
การทำงานของ Pine Script
// ใช้ข้อมูล XAU/USD และ USD/THB เป็นอินพุต
// คำนวณราคาทองคำไทย 1 บาท (ความบริสุทธิ์เริ่มต้นที่ 96.5%)
// แสดงผลเป็นเส้นกราฟของราคาทองคำในหน่วยบาทไทย
Thailand
BeSight Mega SpotBeSight Mega Spot – Zone Based Price Grid Indicator
สคริปต์นี้ถูกออกแบบมาเพื่อช่วยเทรดเดอร์มองเห็นโซนราคาสำคัญที่ราคาอาจเกิดปฏิกิริยา โดยอ้างอิงจากระดับราคาที่ลงท้ายด้วย 0 และ 5 (เช่น 1350, 1355, 1360 เป็นต้น) ซึ่งมักเป็นระดับที่มีการตั้งคำสั่งซื้อขายจำนวนมากในตลาด
BeSight Mega Spot – Zone-Based Price Grid Indicator
This indicator is designed to help traders visualize key price zones where the market often reacts, based on price levels ending with 0 or 5 (e.g., 1350, 1355, 1360). These levels are commonly used for pending orders, liquidity, or price clustering zones.
It displays horizontal grid lines at fixed step intervals (default: every 5 points), covering the entire visible price range of the chart. Each price level is labeled for better clarity and planning.
🟦 Blue lines: Price levels ending in 0
⬜ Gray lines: Price levels ending in 5
This tool is useful for identifying potential institutional behavior zones, price consolidation, accumulation/distribution areas, or psychological support/resistance levels.
🧠 Notes:
- This indicator is not a buy/sell signal tool or predictive system.
- It works best when used in conjunction with other technical tools such as Supply/Demand zones or Smart Money Concepts (SMC) analysis.
- Compatible with all instruments: stocks, futures, forex, crypto, etc.
✅ How to use:
1. Add the indicator to your chart
2. Observe how price interacts with the 0/5 grid zones
3. Use the lines to assist with breakout, retest, or reversal planning
4. Combine with price action or other indicators for higher precision
✨ Developed by BeSight – A Community Of Traders
---------------------------------------------------------------------------------------
อินดิเคเตอร์นี้จะแสดงเส้นแนวนอนแบบตาราง (Grid) ที่แบ่งช่วงราคาออกเป็นระยะ ๆ ตามค่าที่ผู้ใช้กำหนด เช่น ทุก ๆ 5 จุด และครอบคลุมช่วงราคาทั้งหมดของกราฟ โดยแสดงเป็นเส้นแบบ dotted พร้อมป้ายราคาเพื่อให้มองเห็นได้ชัดเจน
🟦 เส้นสีน้ำเงิน: แสดงระดับราคาที่ลงท้ายด้วย 0
⬜ เส้นสีเทา: แสดงระดับราคาที่ลงท้ายด้วย 5
เหมาะสำหรับผู้ที่ต้องการดูโซนราคา "หยุดพัก / เก็บของ / เปิดโพซิชัน" ซึ่งอาจสะท้อนพฤติกรรมของผู้เล่นรายใหญ่หรือสถาบันในตลาด
🧠 ข้อควรรู้:
- อินดิเคเตอร์นี้ไม่ได้บอกจุดเข้าเทรดหรือการคาดการณ์ แต่ช่วยในการวางแผนแนวรับ-แนวต้านร่วมกับเครื่องมือวิเคราะห์อื่น ๆ
- รองรับทุกสินทรัพย์ที่มีหน่วยราคาคงที่ (หุ้น, ฟิวเจอร์ส, ฟอเร็กซ์, คริปโต ฯลฯ)
✅ วิธีใช้งาน:
1. เพิ่มอินดิเคเตอร์นี้ลงบนกราฟ
2. ใช้เส้น Grid เป็นแนวประกอบในการดูพฤติกรรมราคา เช่น การหยุดลง, การเบรกแนว, การกลับตัว
3. ผสมผสานกับโซน Demand/Supply หรือโซน SMC เพื่อความแม่นยำ
✨ พัฒนาโดย BeSight – คอมมูนิตี้ของเทรดเดอร์ตัวจริง