Ichimoku Cloud Indicator [TradingFinder] Kinko Hyo Cross Alerts🔵 Introduction
The Ichimoku Cloud (Ichimoku Kinko Hyo) is one of the most powerful and complete trading indicators in technical analysis. Originally developed by Japanese journalist Goichi Hosoda, the Ichimoku system combines multiple tools in one indicator, providing traders with instant insights into trend direction, support and resistance levels, and momentum. Unlike simple moving averages (SMA – Simple Moving Average), the Ichimoku Cloud (Kumo – Cloud) integrates dynamic elements that help traders forecast potential price action with greater clarity.
The Ichimoku Indicator (Ichimoku Signal System) is widely used across global markets, from Forex trading (FX – Foreign Exchange) to stocks, indices, and even cryptocurrencies. Its popularity comes from its ability to generate clear buy signals and sell signals based on the interaction of its components: Tenkan Sen (Conversion Line), Kijun Sen (Base Line), Senkou Span A, Senkou Span B, and Chikou Span (Lagging Line). When combined, these lines create the Ichimoku Cloud, which visually represents the balance between price action and market structure.
Ichimoku Cloud Lines Formulas :
Conversion Line (Tenkan Sen / Conversion Line) : Average of the highest high and lowest low over the past 9 periods => (9-PH + 9-PL) ÷ 2
Base Line (Kijun Sen / Base Line) : Average of the highest high and lowest low over the past 26 periods => (26-PH + 26-PL) ÷ 2
Leading Span A (Senkou Span A / Leading Span A) : Average of the Conversion Line and Base Line, plotted 26 periods ahead => (Tenkan Sen + Kijun Sen) ÷ 2
Leading Span B (Senkou Span B / Leading Span B) : Average of the highest high and lowest low over the past 52 periods, plotted 26 periods ahead => (52-PH + 52-PL) ÷ 2
Lagging Span (Chikou Span / Lagging Span) : Current closing price, plotted 26 periods behind.
One of the biggest advantages of the Ichimoku Trading Strategy (Ichimoku Cloud Trading System) is that it allows traders to identify the market condition at a glance. When the price is above the Kumo (Cloud), it indicates a bullish trend (uptrend). When the price is below the Kumo, the market is in a bearish trend (downtrend). And when the price is inside the cloud, the market is ranging (sideways trend). This simplicity and visual clarity make Ichimoku an essential indicator for both beginner traders and professional analysts.
The Ichimoku Cloud Indicator (Ichimoku Technical Analysis Tool) continues to be one of the most reliable charting methods. Traders often consider it superior to basic moving averages (MA – Moving Average) or exponential moving averages (EMA – Exponential Moving Average), because it not only shows trend direction but also highlights potential future support and resistance levels. With its unique combination of trend analysis, price forecasting, and trading signals, Ichimoku remains a core strategy in modern trading systems.
🔵 How to Use
The Ichimoku Cloud is more than just a set of lines; it’s a complete trading system that helps traders identify trends, momentum, and key support and resistance levels. By combining its five lines Conversion Line, Base Line, Leading Span A, Leading Span B, and Lagging Span traders can develop clear buy and sell strategies.
🟣 Identifying Trend Direction
Bullish Trend (Uptrend) : Price is above the cloud (Kumo), and the cloud is green. Leading Span A is above Leading Span B, signaling strong upward momentum.
Bearish Trend (Downtrend) : Price is below the cloud, and the cloud is red. Leading Span A is below Leading Span B, confirming a downward momentum.
Ranging / Sideways Market : Price is inside the cloud, indicating indecision and consolidation. Traders often avoid opening strong positions during these periods.
🟣 Buy Strategies
Conversion/Base Line Crossover : A buy signal occurs when the Conversion Line (Tenkan Sen) crosses above the Base Line (Kijun Sen). The signal is strongest when this crossover happens above the cloud.
Price Above Base Line : If the price moves above the Base Line while in an uptrend, it confirms bullish momentum and provides a favorable entry point.
Cloud Support Pullback : During a pullback in an uptrend, the price may touch or slightly enter the cloud. Traders can use the cloud as a dynamic support zone for buying opportunities.
Lagging Span Confirmation : Ensure the Lagging Span (Chikou Span) is above the price of 26 periods ago to confirm the strength of the bullish trend.
🟣 Sell Strategies
Conversion/Base Line Crossover : A sell signal is generated when the Conversion Line (Tenkan Sen) crosses below the Base Line (Kijun Sen). This signal is strongest when it occurs below the cloud.
Price Below Base Line : If the price falls below the Base Line in a downtrend, it confirms bearish momentum and strengthens the sell setup.
Cloud Resistance Pullback : During a bounce in a downtrend, the cloud acts as a resistance zone. Traders can enter sell positions when price approaches or touches the cloud from below.
Lagging Span Confirmation : The Lagging Span should be below the price of 26 periods ago, confirming downward momentum.
🟣 Cloud Breakout Signals
A strong buy occurs when the price breaks above the cloud from below, signaling a potential trend reversal.
A strong sell occurs when the price breaks below the cloud from above, indicating a shift toward a bearish trend.
🟣 Combining Signals for Stronger Entries
For higher probability trades, combine multiple signals : trend direction (cloud color and position), crossovers (Tenkan/Kijun), and Lagging Span position.
Avoid trading against the overall trend. For example, avoid buying when price is below a red cloud or selling when price is above a green cloud.
🔵 Setting
Tenkan Sen Period : Lookback period for Conversion Line (default: 9).
Kijun Sen Period : Lookback period for Base Line (default: 26).
Span B Period : Lookback period for Leading Span B, forms one Cloud boundary (default: 52).
Shift Lines : Periods forward for Cloud / backward for Lagging Span (default: 26).
Cross Tenkan/Kijun Alert : Alert on Conversion/Base Line crossover.
Cross Price/Tenkan Alert : Alert when price crosses Tenkan Sen.
Cross Price/Kijun Alert : Alert when price crosses Kijun Sen
🔵 Conclusion
The Ichimoku Cloud (Ichimoku Kinko Hyo) is much more than a simple indicator it is a complete trading system that combines trend detection, momentum analysis, and support/resistance identification in one view. By interpreting the position of price relative to the cloud, the interaction between Tenkan Sen (Conversion Line) and Kijun Sen (Base Line), the leading spans (Senkou Span A and B), and the Chikou Span (Lagging Line), traders can identify potential buy and sell opportunities with higher confidence.
The main advantage of the Ichimoku Cloud is its ability to provide a “one-look equilibrium” snapshot of the market. It highlights bullish trends when the price is above the cloud, bearish conditions when the price is below it, and indecision or transition when the price is inside the cloud. Crossovers, cloud breakouts, and confirmations by the Chikou Span strengthen the trading signals.
However, traders should keep in mind the limitations of the Ichimoku system. It is based on historical data and should not be used in isolation. Combining it with other tools such as RSI, volume analysis, or candlestick patterns can significantly improve accuracy and reduce false signals.
Tenkansen

Ichimoku RONIN [Lite]This Ichimoku is a Lite Edition of Ichimoku RONIN
Features :
- Ichimoku Default Lines
- Settings for Shift all of Lines
- Two Custom Periods Lines
- 9/26/52 Cycle Counter
- Optimized for Pine Script 5
- No Shifted Senko Span A Line
- New Cloud Alert
- KijunSen & TenkanSen Lines Crossed Alert
Good Trading to All ...

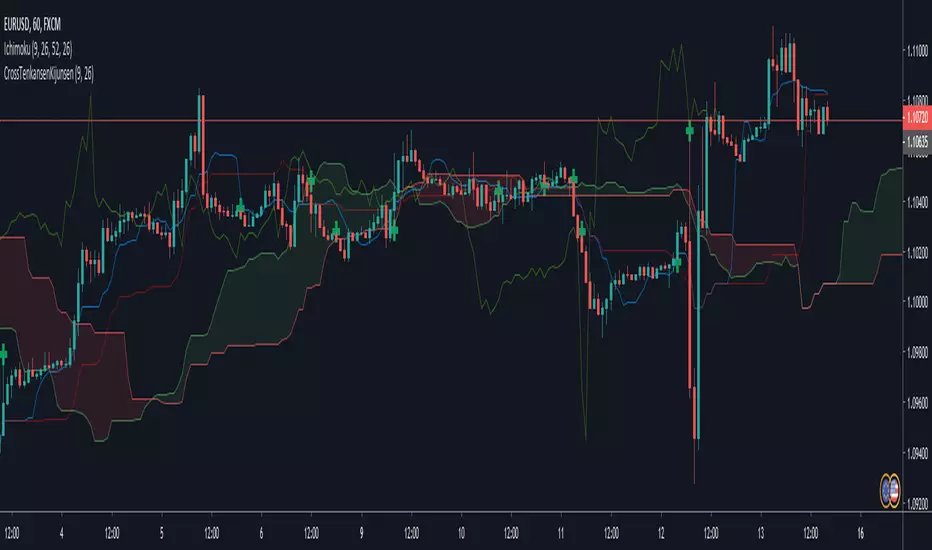
Ichimoku CrossThis is a trend analysis indicator based on Ichimoku
this indicator splits the chart into :
"Buy Phase" where KijunSen > TenkanSen with "Green color"
"Sell Phase" where KijunSen < TenkanSen with "Red color"
"Cross Phase" where KijunSen = TenkanSen
Close of each candle above or below KijunSen and TenkanSen determine the strength of the trend
and is shown by 3 different green colors for Bullish Trends and 3 different red colors for Bearish Trends .

Ichimoku RONINA Full version of Ichimoku Kinko Hyo with many features ...
Features :
- Ichimoku Default Lines
- Settings for Shift all of Ichimoku Lines
- 52, 103, 108, 216 Periods Line
- Future TenkanSen, Kijunsen & Kumo Clouds
- 9/26/52 Cycle Counter
- Optimized for Pine Script 5

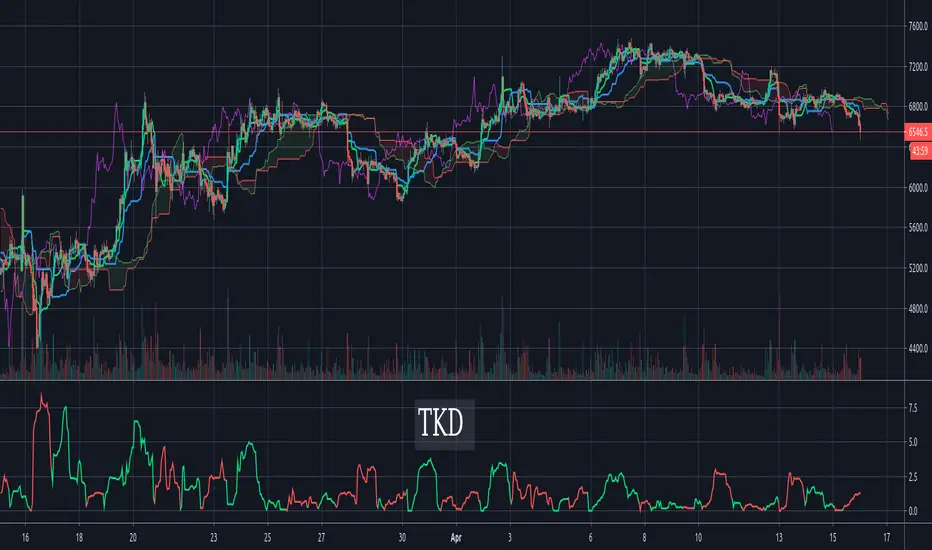
Tenkan-Sen Kijun-Sen Distance (TKD) Oscillator - IchimokuThe TKD is the distance between the Tenkan-Sen and the Kijun-Sen, expressed in percentage of current price. The further apart the tenken-sen and kijun-sen are, the more they want to snap back together. This makes for a decent oscillator. When the Tenkan-Sen is above the Kijun-Sen, the TKD is green. When it is below, the TKD is red. At the crossing points, it turns blue.
For those more familiar with Ichimoku Cloud techniques, one might also think of this indicator as a C-Clamp indicator. Bar coloring is supported and enabled by default. There's also an option to flip/invert the green/red colors in case you want to use it to judge pending cycles rather than current ones.
OBV-Ichimoku [by: Bijan Ajdary]This indicator adds Tenkansen and 3 types of Kijunsen and ChikouSpan and Kumo to the OBV chart.
Just like the Ichimoku indicator, only with the difference that, OBV was used instead of the price,
And making it highly efficient for professional traders and Analyzers.
Email: bj.ajdary@gmail.com
Telegram Id: @The_Last_Savior

Triple Timeframe IchimokuVi presento il Triple Timeframe Ichimoku.
Questo indicatore applica tre Ichimoku completi al vostro grafico usando fino a ben 3 timeframe diversi:
Timeframe Attuale (quello impostato sul grafico che state visualizzando)
Timeframe B (personalizzabile tra i seguenti TF : 1m, 5m, 15m, H1, H2, H4, D, W, M)
Timeframe C (personalizzabile tra i seguenti TF : 1m, 5m, 15m, H1, H2, H4, D, W, M)
Il risultato è quello di avere immediatamente sott'occhio l'andamento dei prezzi senza dover fare zapping tra i vari timeframe: tutto chiaro subito!
L'indicatore è completamente personalizzabile, potete infatti:
Decidere quanti (da 1 a 3) e quali Ichimoku visualizzare
Scegliere per ogni Ichimoku se visualizzare o meno le linee dell'indicatore (Tenkan, Kijun e Laggin)
Scegliere per ogni Ichimoku se visualizzare o meno le nuvole dell'indicatore (SSA, SSB e Kumo)
Personalizzare i colori di ogni singola linea di ogni singolo Ichimoku
L'indicatore è estremamente utile per strategie basare sull'indicatore Ichimoku che richiedono il controllo su diversi Timeframe.
Buon trading a tutti!

OBV-Ts-Ks [by: Bijan Ajdary]This indicator adds Tenkansen and 3 types of Kijunsen to the OBV chart And making it highly efficient for professional traders.
Written based on the teachings of dear Chris

Tenkan-Sen Strength Analyzer 転換線The Tenkan-Sen Strength Analyzer 転換線 is included in the Richimoku Traiding System.
Tenkan-Sen Strength Analyzer (Indentify divergences. Know First. Act Faster. A must-have for every Ichimoku trader)
*As some indicators you may come across are using the repainting mode (which consists in correcting the false signal back in time).
You'll never see such thing in the Richimoku Trading System. What's on the charts is displayed in real time, no cheating...
Feel free to test the Tenkan-Sen Strength Analyzer 転換線 or the Richimoku Trading System For 12 hours! Study the chart history on all timeframes. Study all details incl. divergences etc.
FAQ.
How to access the Tenkan-Sen Strength Analyzer 転換線 in tradingview?
To access your indicator simply click on “Indicators” at the top of your Chart, and click on “Invite-Only Scripts”. Click on the indicator to activate it. That’s it!
Will the The Tenkan-Sen Strength Analyzer 転換線 work for Stock and Index trading?
Sure! It works on all Forex, Stocks, Indexes, Metals and Crypto's!
Does this indicator work with a free TradingView Account?
Yes you can use the Tenkan-Sen Strength Analyzer 転換線 with a free TradingView account.
Does the indiators work on all timeframes?
Yes, the indicators can be used on all time frames!
