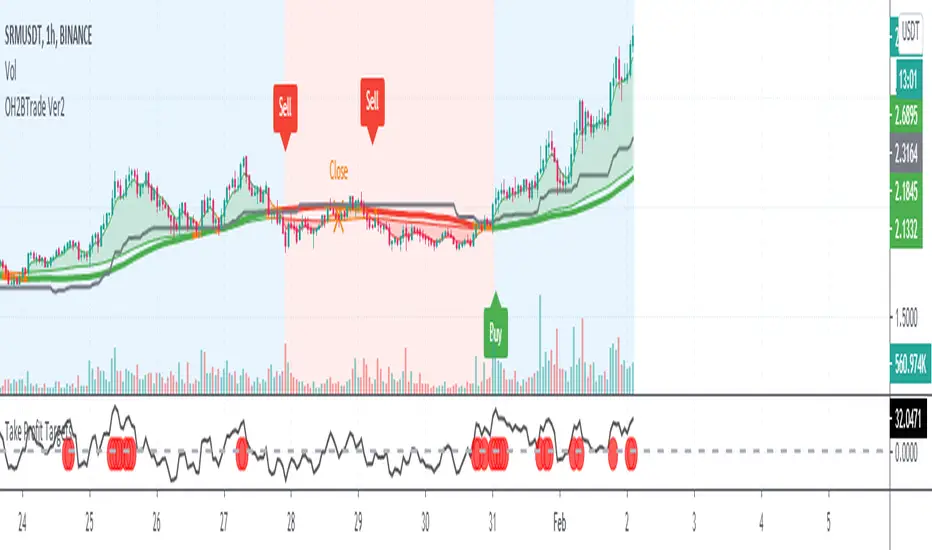
OH2B Trading Indicator for Swing TradingOH2B Trading Indicator
The OH2B Trading Indicator is an indicator built for advanced traders.
It gives you entry points for BUY and SELL based on Trend Channel and Ema-Crossover.
It offers you a higher frequency of signals for swing trading.
The Take-Profit Indicator gives you exit points for taking profits based on the Average Directional Index and Relative Strength Index.
Trading with Both Indicators
Orange Zone : Wait for the next signal from OH2B Trading Indicator.
The OH2B Trading Indicator gives you entry points for BUY or SELL .
When the ema1 crosses above ema2, the trend channel will be painted GREEN in color, and a BUY signal will appear. = BUY
When the ema1 crosses below ema2, the trend channel will be painted RED in color, and a SELL signal will appear. = SELL
When a BUY or SELL signal appears on the chart, don't rush into any trade.
Please allow a few hours for confirmation of signals .
To take profit, please follow the Take-Profit Indicator at the bottom.
RED dots are the Take-Profit targets for the BUY (long) signal
GREEN dots are the Take-Profit targets for the SELL (short) signal
*After taking profit, please set a Stoploss to at least break-even level to protect your profits.
When the price enters the Orange Zone again, you may close your trade and wait for the next signal.
If you like to keep your positions at Orange Zone, please remember to set a stop-loss alert when an opposite signal pops up on the chart.
Often the price goes to the Trendline after the signal, so keep some funds to increase the position or even open all position near the Trendline , or use it for re-enter with SL after you closed position on TPs.
Tips for the traders:
Recommended using the indicators at 1H Timeframe .
Recommended using the indicators for Spot Trading at both Crypto and Stock Market.
Do not use leverage above 5x.
No more than 5% of the deposit in one trade.
Try to enter/exit a position by limit orders.
Do not rush into any trade when a new signal pops up, please allow a few hours for confirmation of signals.
Swingtrading
PROFIT MAKER |Crypto|ETH|BTC|YFI - SignalThis is the version with alerts of this strategy:
Description:
This is a trend-following strategy that works very well for many Crypto assets in the usd or usdt pair
It can be used for both futures and spot!
Some of the assets in which this strategy is proven are
Asset Exchange TF
BINANCE:ADAUSDT Binance 45m
BINANCE:BTCUSDT Binance 1h
BINANCE:YFIUSDT Binance 30m
BINANCE:DOTUSDT Binance 45m
BINANCE:ETHUSDT Binance 30m
BINANCE:LINKUSDT Binance 45m
BINANCE:DOGEUSDT Binance 1h
And many others..
What is this strategy based on?
It is a combination of various parameters, including
-RSI: The relative strength index ( RSI ) is a momentum indicator used in technical analysis that measures
the magnitude of recent price changes to evaluate overbought or oversold conditions in the price of a stock or other asset.
-MACD: Moving average convergence divergence ( MACD ) is a trend-following momentum indicator that shows
the relationship between two moving averages of a security’s price.
-ADX: ADX is used to quantify trend strength. ADX calculations are based on a moving average of price range expansion over a given period of time.
-DMI: DMI is a moving average of range expansion over a given period (the default is 14 days). The positive directional
movement indicator ( +DMI ) measures how strongly price moves upward; the negative directional movement indicator ( -DMI )
measures how strongly price moves downward. The two lines reflect the respective strength of the bulls versus the bears.
Included:
Different forms of Take profit, included:
Take profit on squeeze candles
Take profit based on Risk-Benefit (RR)
Take profit a pre-determined %.
Different forms of Stop Loss, including
ATR-based stop loss
Trail stop loss (with option to use a trigger)
Stop loss a pre-determined %.
For access you can send a message or consult in my social networks.
Links in my tradingview signature (below).
Examples:
The default configuration works very well for most pairs.
You just have to look for which time frame goes better with each one.
Recommended to try with 30m, 45m and 1 hour.

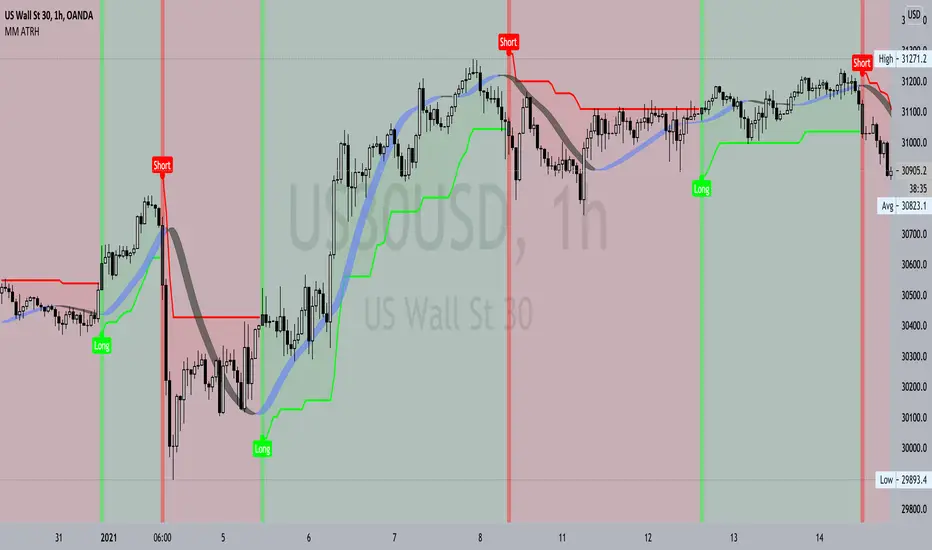
MM AverageTrueRangehUllFeatures:
- Powerful 2 calculation used in one. Average True Range Multiplier & Sensitivity.
- Clearly shows trend direction, volatility , momentum & sentiment of any financial market.
- Dynamic stop loss levels formed by the help of average true range calculation which are produce right from the long or short signal and does stretch until the opposite directional signal appears.
- Generates potential long and short trade signals using complex formula of volatility , momentum and trend following.
- ATR calculation method can be changed from normal (ATR) to SMA version true range inside setting by ticking or unticking the input function named “Change ATR Calculation Method?”.
- Long and short signals labels can be turn off/on using “Reveal Long/Short Signals?”. - Background color can be shown/hidden using “Signal-light Show/Hide?”.
- Alert feature available for long and short signals.
Important two main settings of ATRH indicator:
1. ATR Multiplier
o A retail trader should adjust the setting depending on the financial market, instrument and timeframe as per required.
o Basically, higher timeframe has more range in price so ATR multiplier can be set higher.
o ATR multiplier value lower can produce more signals which will be as more trades opportunities but it can also lead to fake signals. 3-5 value is producing reasonable signals in any timeframe either it be lower or it be higher. If a trader by mistake doesn’t set a proper input value then the whole indicator could even function poorly so this setting must be used wisely.
2. Sensitivity
o Sensitivity can be from 0 to 1. It can be also integer or floating-point number example: 0.1, 0.3, 0.8 etc.
o It is used to control the signal generation speed by 3 to 5 candle bars before (if the value is set higher) or after (if the value is set lower) during the time of condition meeting for either long or short signals.
o Depending on any financial market or instrument sensitivity value should be managed well by a trader for his/her needs taking consideration on the nature of that particular financial market or instrument & timeframe.
Use link below or PM us for access you this indicator. Happy Trading
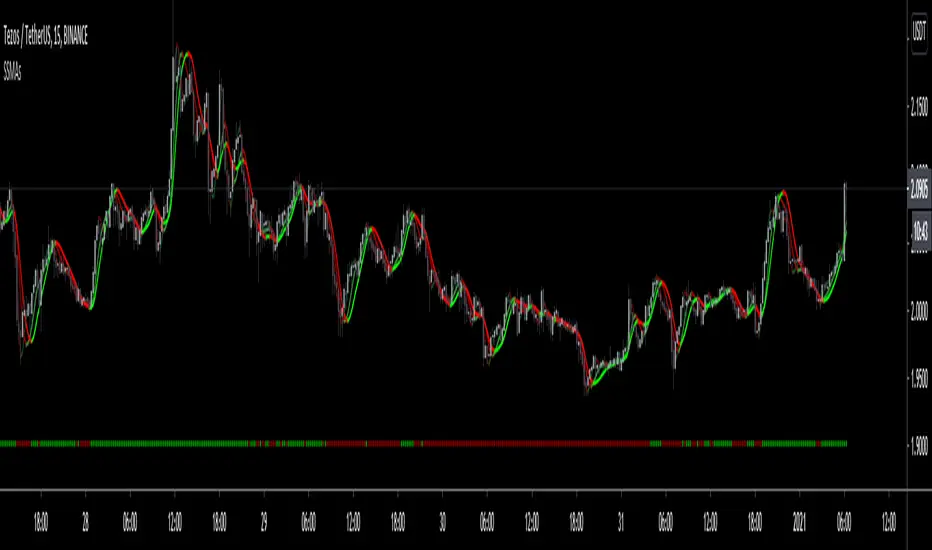
SwingScalpin MA'sDefault
HMA's + Trend Signals
Default SMA's
ALMA
BarColoring
The idea behind this script was to incorporate a few different moving average types into 1 indicator so multiple trading strategies could be implemented depending on Price Action. This indicator includes 3 HMA's, 2 user defined EMA/SMA's, 1 ALMA (which also is used for the bar coloring), and Trend signals at the bottom of the chart (which are defined by the 1st MA). By default all of the Moving Averages are set to false because they aren't meant to be used together unless you so chose to. The only feauture initially being shown are the Trend signals at the bottom of the screen.
HMA's - The default lengths for the HMA's are 7, 14, and 21.
This is not Financial Advice nor am I saying this works all of the time but here are a few examples of how I've traded the HMA's... OF course thid depends on overall PA but the idea is to enter and exit when all
three HMA's turn Green or Red...
For quicker entries and exits, you could enter when the Fast HMA crosses the Medium HMA and exit when the it crosses back over/under the Medium HMA.
For more of a swing trade and when there's definitely an established trend, I would stay in the trade until Fast HMA crosses under the Slow HMA, otherwise it might just be a normal retrace prior to making another move up.
When PA is ranging but not really trending in either direction, I'll use the Slow HMA as somewhat of a Trailing SL.
The 2 user defined moving averages can either be an EMA or SMA. The 1st MA is set to the 200 SMA by default, which also triggers the Trend signals at the bottom of the chart. The 2nd MA is set to the 6 SMA by default.
The ALMA is set to 50 by default, which is also used for the bar coloring. Lastly, all of the MA's change color depending on the trend.
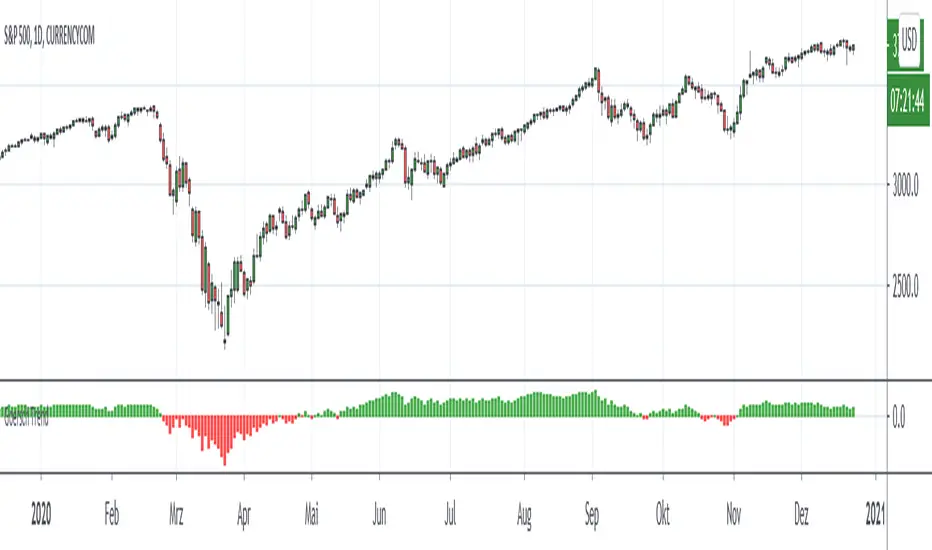
Goersch TrendENGLISH:
Goersch Trend Indicator for TradingView is a trend indicator that shows the actual trend and the trend strength based on the price movement of the past. The indicator can be used for any underlying and trading timeframe. The special feature is that it is extremely easy to interpret and that it works "out-of-the-box". The calculation automatically adjusts to the displayed timeframe. The interpretation of the Goersch Trned indicator is always the same - whether you are looking at a stock, a currency, an index or a commodity. Regardless of whether you work in the 5-minute chart, hourly, daily or even weekly chart. It is extremely simple to judge whether an underlying is running in a trend, whether this trend strength is currently increasing (stable) or decreasing (when the trend is weakening), or whether the trend is currently changing direction. The indicator shows you the important information at a glance.
The interpretation of the Goersch Trend indicator is very simple. Red bars represent a downward trend, green bars appear during an upward trend. The change from red to green signals a change from a downward to an upward trend and vice versa. The height of the bars represents the trend strength. The trend strength decreases when the bars become shorter. The change from red to green then signals a completed trend change.
For the calculation of the bar height, the fluctuation of a price change index is used as a basis in the Goersch Trend Indicator. The price change index is calculated from the respective candle closing price and the true high or true low of the previous candle, which is added or subtracted accordingly. From this price change index, a long-term moving average is calculated, the difference between this average and the price change index is visualized by means of the red and green bars.
To get access to the script, please PM, or send a message to the email address in the signature.
DEUTSCH:
Beim Goersch Trend Indikator für TradingView handelt es sich um einen Trend-Indikator, der anhand der Preisbewegung der Vergangenheit den Trend sowie die Trendstärke anzeigt. Verwendet werden kann der Indikator für jegliche Basiswerte und Zeiteinheiten. Das Besondere ist, dass er extrem leicht zu interpretieren ist und dass er "out-of-the-box" arbeitet. Die Berechnung passt sich automatisch auf die dargestellte Zeitebene an. So ist eine Interpretation immer gleich – egal ob Sie eine Aktie, eine Währung, einen Index oder einen Rohstoff betrachten. Unabhängig davon, ob Sie im 5-Minuten-Chart, Stunden-, Tages- oder gar Wochen-Chart arbeiten. Dabei ist es äußerst simpel zu beurteilen, ob ein Wert in einem Trend läuft, ob diese Trendstärke gerade zunimmt (also stabil ist) oder abnimmt (der Trend also schwächer wird), oder ob der Trend gerade kippt. Der Indikator zeigt Ihnen die wichtigen Informationen auf einen Blick.
Die Interpretation des Goersch Trend Indikators ist denkbar einfach. Rote Balken stehen für einen Abwärtstrend, grüne Balken erscheinen während eines Aufwärtstrends. Der Wechsel von Rot auf Grün signalisiert einen Wechsel vom Abwärts- in einen Aufwärtstrend und umgekehrt. Die Höhe der Balken repräsentiert die Trendstärke. Dadurch ergibt es sich schon, dass beispielsweise die Trendstärke abnimmt, wenn die Balken kürzer werden. Der Wechsel von Rot auf Grün signalisiert dann einen vollendeten Trendwechsel.
Für die Berechnung der Balkenhöhe wird im Goersch Trend Indikator die Schwankung eines Preisveränderungsindex zugrunde gelegt. Dieser errechnet sich aus dem jeweiligen Kerzen-Schlusskurs und dem True-High bzw. True-Low der vorhergehenden Kerze, das entsprechend hinzugerechnet oder abgezogen wird. Von diesem Preisveränderungsindex wird ein langfristiger gleitender Durchschnitt errechnet, die Differenz dieses Durchschnittes und des Preisveränderungsindex wird mittels der roten und grünen Balken visualisiert.
Um Zugang zum Skript zu erhalten, bitte eine PM, oder eine Nachricht an die Emailadresse in der Signatur.
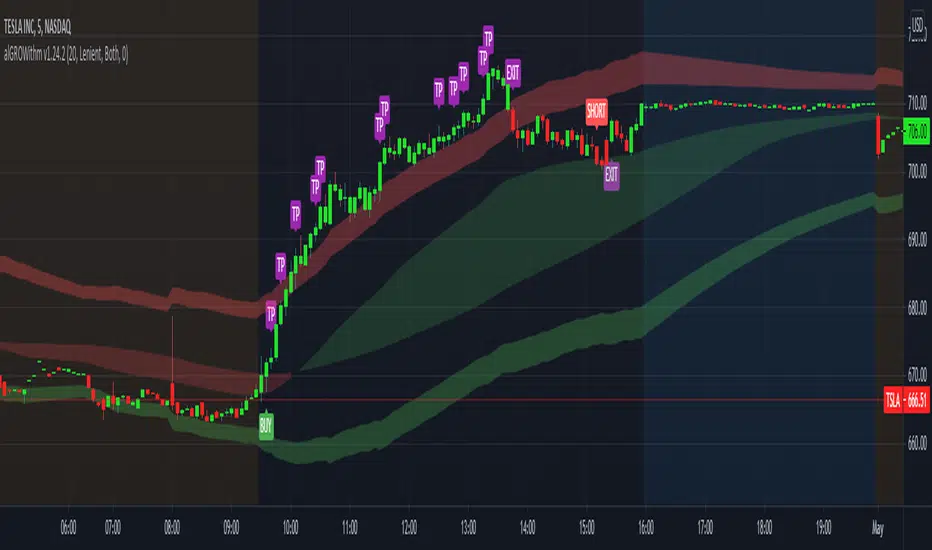
alGROWithm PremiumIntroducing the alGROWithm indicator!
Years of trading experience and endless hours of screen time has undeniably proven to me that the most fundamental rule of any market is: price moves from supply to supply and demand to demand. Specifically, this means that a breakout of a supply zone , the probability of it reaching the next supply zone before starting consolidate is very high. Similarly, a breakdown from previous demand zone will likely continue to the next demand zone . The identification method of these supply and demand channels is one of the features that sets this indicator apart from other available tools.
What separates alGROWithm from other available tools?
- Proprietary method for identifying supply & demand channels combined with a directional bias computation based on recent historical prices
- Only signaling precise entries based on supply & demand that maximize R/R
- Tracking open positions and displaying a trading plan directly on the chart immediately after signaling entry points
- Indicating precise exit levels to help you avoid exiting too early or trading by emotion
What are the features included in alGROWithm?
Trading Plan Lines : These are the Buy/Short/Take Profit/Exit lines plotted directly on the chart
Show Long Signals : These are the green "BUY" labels that appear on the chart when alGROWithm identifies a critical breakout to the next supply level
Show Short Signals : These are the red "SHORT" labels that appear on the chart when alGROWithm identifies a critical breakdown to the next demand level
Show Take Profit Signals : These are the purple "TP" labels that appear on the chart when alGROWithm identifies that the subsequent supply/ demand level has been hit
Show Exit/Stop Loss Signals : These are the purple "EXIT" labels that appear on the chart when alGROWithm identifies that the trade has run its course and it's time to exit
Show Dashboard : This is a dashboard that is displayed to the right of the latest candle, and contains the following information:
- Current Position : "Long", "Short", or "None"
- Next Profit Target : Only displays if there is an active Position
- Current Bias : alGROWithm computes a directional bias based on recent historical prices. Text will say "Long" or "Short"
- Long/Short Bias Until : alGROWithm's bias will change if this price is hit. Note that these are not BUY or SELL levels - this simply indicates whether things are looking up or down
- Enter Short/Long At : Only displays if Current Position = "None"
Note that you can enable/disable any of these chart overlays at anytime through the indicator settings.
The alGROWithm indicator works on any timeframe, any market, and standard OR Heikin Ashi candlesticks .
I have been working very hard on this indicator and I personally use it on a daily basis with options trading. I am so excited to share the wealth with you!
You can use the link below to visit our website and gain access to the script.
SMA + Trend Strength + Trailing Stop LossThe 'SMA + Trend Strength + Trailing Stop Loss' indicator was designed for swing trading long positions over the course of days/weeks. The benefit of the indicator is to identify areas where the market of a given asset is showing signs of a strong uptrend, divergences, and fear. A 13-bar simple moving average is color coded to four colors based on 5 given conditions at a time, which are represented as a trend meter on the bottom right of the screen. A trailing stop loss indicator is included to secure your profits or limit your loss in case the market reverses on you unexpected. Please use this indicator responsibly with proper risk management, and never rely on the indicator by itself for buy and sell signals.
When the simple moving average color is green, it means that at least 4 of 5 conditions are confirming a move upwards, this is when you can take an entry into a trade based on your entry strategy. As the trend continues, the color will eventually change to yellow signaling a divergence. This is when you can use your exit strategy to find a good point to sell. It is wise not to take new positions when the color is trending yellow.
If the color changes from yellow to orange, that is a warning sign that the trend is about to change or has begun to change. Prices may have already fallen. However, sometimes the color will change from yellow back to green signaling a continuation of the trend. You can either keep holding or take a new position in this instance.
When the color is red, this signals fear in the market, you should stay out of the market at first. However, as the market consolidates and the color starts changing back to orange, this is an opportunity to take a long position at a reasonably low price.
Simple Moving Average (13-Bar) Color Explanation:
The colors change based on 5 market conditions represented in the trend meter.
Green: Strong Uptrend
Yellow: Divergence Present
Orange: Warning
Red: Fear
Trend Meter Explanation:
The trend meter draws 5 arrows indicating bullish or bearish presence.
LL = Lower Lows - Detects when the market is trending with lower lows.
HH = Higher Highs - Detects when the market is trending with higher highs.
MA = SMA Direction - A formula is used to determine the direction of the SMA.
DI = Directional Index - Identifies when upwards momentum is trending.
RSI = Relative Strength Index - Identifies when the RSI is in an uptrend state.
Note: For advanced users, this indicator has a hidden DMI(4, 4, 4) and RSI(14) indicator used to determine the last two conditions. The Directional Index is based on a DI Plus momentum moving average to determine a momentum trend and the RSI trending over 50 will constitute an uptrend signal as below 50 it will point down.
Trailing stop loss:
The trailing stop loss is determined based on the lowest price of the last 8 bars.
A gray step-line is drawn at the suggested stop activation price.
A red step-line is drawn at the suggested stop limit price.
When the price breaches the trailing stop, a red X will appear below the bar.
You can turn each of these features on or off based on your preference. Happy trading!

Swing Reversal IndicatorSwing Reversal Indicator was meant to help identify pivot points on the chart which indicate momentum to buy and sell. The indicator uses 3 main questions to help plot the points:
Criteria
Did price take out yesterday's high or low?
Is today's range bigger than yesterday? (Indicates activity in price)
Is the close in the upper/lower portion of the candle? Thus, indicating momentum in that direction
This indicator was built to help me find pivot points for directional options trading however can be used for equities and forex swing trading and other strategies. Used in conjunction with a BB extreme can provide good setups.
Alerts are available for both the long and the short positions and the indicator will repaint as price moves.
The character Plotted can be changed in the settings
The size of the candle area can be changed as well if you want to tighten/loosen the trigger points based on the third question above.

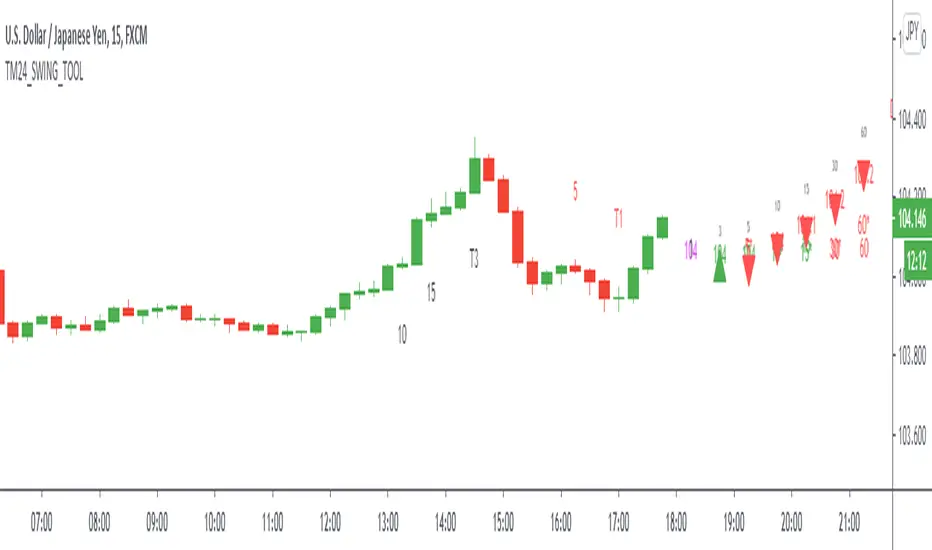
TM24_SWING_TOOLTM24_SWING_TOOL helps to identify following Things for Intraday Position on 15-30-60 Minutes timeframe along with Buy or sell signal.
1. Market Trend (Different Timeframe)
2. Price Direction
3. Area of Support & Resistance
4. Price Momentum
Terminology Use ==> Black from Bottom for - Buy, Red from Top for - Sale Signal, and Numbers are to show time frame indication there is presence of buyer or seller like 1 for buy signal on 1 minute time frame etc.
Display and Interpretation ==> Buy Sale Signal in Digit with 5-10-15-30-60-D for different time frames.
any value signal ending with * shows breakout of support/ resistance and value signal starting with * shows entry to a momentum zone.
Green Mark with Triangle Up shows trend of that timeframe in positive and value shows upside possible direction on that timeframe vice versa for red signal with down triangle
T1 stand for trend change in 1 Minute timeframe and T3 stand for trend change in 3 Minute timeframe
Use market structure, chart pattern, trend lines for more support..
Time frame ==> Use proper Signal with 15 minute, 30 minute time frame
What to Identify ==> Overall Trend for the Swing
How to Use ==>
See how and order buildup is seen and current order position. Also area for volatility and expected movement in price direction
Note: - Use market structure, chart pattern, trend lines and price action parameter for more confirmation.
Entry ==>
Let’s wait the proper area of support or resistance ( Area of Value in case of trend pattern use)
Exit ==>
SL of swing high/low out of market structure with proper risk management and target with proper Risk/ Reward Ratio
Use the Below Contacts to Access this Indicator
TM24_SWING_LEVELTM24_Swing_level Indicator shows overall market price structure of market for Swing Position.
Terminology Use ==> Price Line, Price Level name and Price level
Timeframe ==> Use proper Signal with swing trend on 1 Hour or Upper time frame (Best if Use with 1 Hour chart or 1 Day chart).
What to Identify ==> Overall market price structure for the Swing Period
How to Use ==>
There are Many Line in price level chart
Green/red with Solid for important area of support or resistance
other dotted lines are for retracement or extension of prices.
Important Structure==> Price behaviors on all lines of possible support and resistance
Use market structure, chart pattern, trend lines for more support.
Entry ==>
Let’s wait the proper area of support or resistance (Area of Value in case of trend pattern use)
Exit ==>
SL of swing high/low out of market structure with proper risk management and target with proper Risk/ Reward Ratio

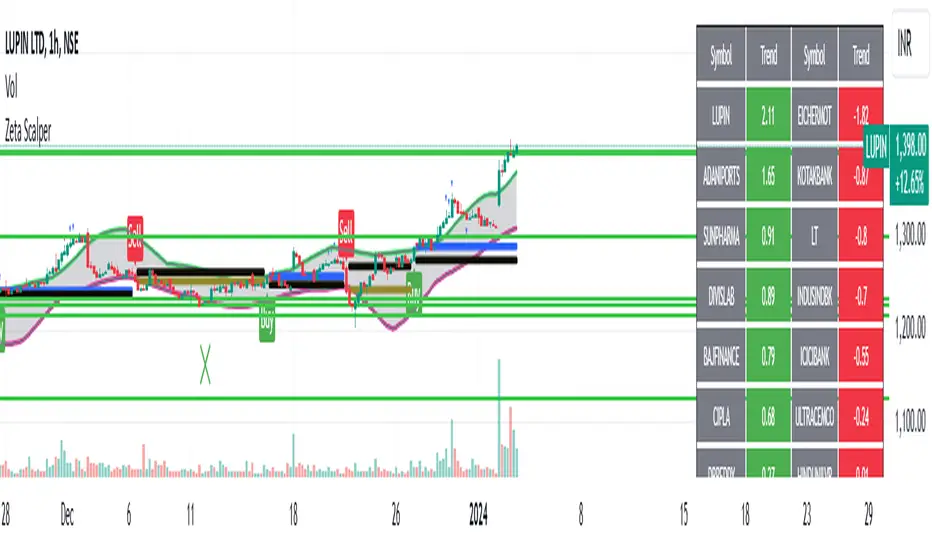
Zeta ScalperWhat is Scalping?
Scalping is a trading strategy aimed at profiting from quick momentum in a volatile index or stock.
Traders who use such strategies place anywhere from 10 to a few hundred trades in a single day.
The idea behind such type of trading is that small moves in an index or stock price are much easier to capture than the larger moves.
Traders who use such strategies are known as scalpers. When you take many small profits a number of times, say 10 points scalped 20 times per day, they can easily add up to large gains.
An Option Buyer's Biggest Enemy is Time Decay and when you scalp, you do not allow the time decay to eat your Option Premium as your Entry and Exit is often quick enough.
What is Zeta Scalper?
Zeta Scalper indicator is a momentum based indicator which tries to detect momentum based upon a number of Candle Stick Patterns.
When it thinks a move has the potential to turn into a big move, it generated its Buy/Sell Signals.
It is a well known fact that actual drivers of the market are Big Institutions, Mutual Funds & Big Guys with deep pockets.
They have large amounts of money to invest and they buy & sell in bulk.
When they buy, often their objective is to buy at lower levels (below average price of the day) & when they sell they sell at higher levels (above average price of the day).
Zeta Scalper seeks to detect this activity. When aggressive buying or selling starts where Buying & Selling Forces become unequal, the Price starts moving in one direction with candles making Higher Highs or Lower Lows.
Zeta Scalper detects these Higher Highs or Lower Lows and generates Buy or Sell signals when this happens.
In order to use this indicator, simply deploy this on your chart, and wait for Buy/Sell signals.
It works on all time frames including 1 min. 3min. 5min. & 10min. etc.
When a Buy Signal is followed by Sell signal (let it be after 3 - 4 candles or after many candles) or vice-versa, you have to switch your position to make most of the reverse move.
It is a general purpose indicator and may be used on stocks, commodities and currencies alike and is not meant for any specific market.
How to Take Buy/Sell Entry with Zeta Scalper?
Whenever you see a Buy Signal, mark its closing price with a horizontal line and as soon as a candle breaks this candle's High, it is time for you to take Entry.
Your STOP LOSS could be just 0.5% below your Entry Price, hence, no big loss even if things go wrong.
Keep moving your STOP LOSS up as the price moves in your favour and when market turns around and you see a SELL signal, it is time to book your BUY position profit and take Entry on SELL Side now and so on.
How to get this indicator?
This is invite-only indicator. Get in touch with us using information given below in Signature field to try this tool FREE.
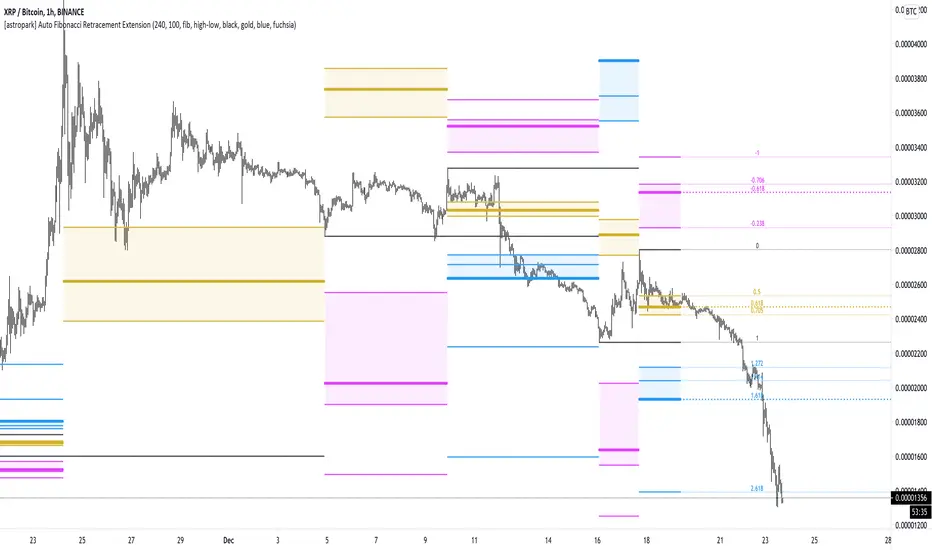
[astropark] Auto Fibonacci Retracement ExtensionDear followers,
today a new analysis tool for day trading, scalping and swing trading: Automatic Fibonacci Retracements and Extensions drawer!
It works on every timeframe and market, as it simply draws automatically most important fibonacci levels on the chart.
Based on the analysis window set (default 100 bars, but you can edit it as you like), it finds recent high and low and start drawing the following levels:
recent high and low (black)
golden retracement range: 0.5 * 0.618 * 0.705 fibonacci retracements (gold)
fibonacci extensions range above 1: 1.272 * 1.424 * 1.618 * 2.618 * 4.236 (blue)
fibonacci extensions range below 0: -0.238 * -0.618 * -0.706 * -1(fuchsia)
Whenever the indicator finds a new high or a new low, al fibonacci levels are re-draw automatically.
The indicator will let you:
change analysis window
enable displaying labels related to current fibonacci levels and/or prices
change colors
show/hide each specific level
How to use the indicator?
Basically, all techniques which apply to fibonacci tool are valid here too.
After a big move up or down, a new high or low is created and a retracement is expected: if trend is strong, retracement to golden ration 0.618 will be a perfect spot for buy or sell respectively in order to continue riding the trend.
In general a bounce is always expected when price hit 0.618 retracement , good to know for scalping traders, while swing trades will continue holding the trade for higher profits.
If the golden retracement range (0.5 - 0.705) is broken and then retested from the other side, a continuation move is expected towards previous high/low (fib level 1) and even more towards the fibonacci extensions range above 1 (1.618 - 2.618 - 4.236).
If the base of bounce and trend continuation on golden retracement range, traders can expect
price to hit again previous high/low and
if trend is strong, a consolidation near the previous high/low range (conditions that are respectively bullish and bearish)
do a further continuation towards -0.618 fib level range
Traders must always understand that
the higher the timeframe, the stronger is the meaning and so the reaction when a specific fibonacci level is hit
don't trade blindly, try to find confluences to have an higher chance to be in a winning trade in near future
money and risk management are very important, so manage your position size and always have a stop loss in your trades
As said, this indicators work on every timeframe and in all markets (Crypto currencies, stocks, FOREX, indexes, commodities). Here some examples:
BTCUSDT 1D: after a long run, a retracement is expected and a bounce at 0.618 golden level is more than obvious: perfect short (sell) entry
BTCUSDT 1D: again as previous example, after a long run, a retracement is expected as well as price's bounces back above
EURUSD 1h: lots of info here, directly in the chart below:
bounces on 0.618 golden zone
double top
price breaks 0.618 level and retests it from below targeting previous low
double bottom and bounce back towards golden zone
bearish consolidation at recent low and further decline towards 1.618 fib extension
AMZN 1h stock: lots of info here too, directly in the chart below:
new high is print, price retrace to golden zone
bounces on 0.618 golden zone
price breaks 0.618 level and retests it from below targeting previous low
double bottom and bounce back towards golden zone
rejection at golden zone, price falling targeting previous low again and probably 1.618 fib extension
price breaks hard previous low and hits fib extension range below recent low
price retraces back up towards new golden retracement range
golden retracement range is broken and used as support: targets are previous high and 1.618 extension
once 1.618 extension level is broken and retested successfully as support, price moves towards 2.618 fibonacci extension level
SPY (SPX500) index: lots of info in the chart
interesting to note that March 2020 huge dump can be totally mapped as a series of fibonacci level bounces, so you understand the importance of riding a trend now, right?
after the low was formed, price retraced perfectly to golden ration 0.618
each time price hit a golden level/range, it retraces creating double top and double bottom configurations too
In the chart below we can see the power of the double bottom at golden retracement level: targets are previous high and -0.618 fibonacci extension level
XAUUSD 15m: as we are in a lower timeframe, the default analysis windows has been reduced to 50.
What can we see here:
golden retracement and price is rejected towards previous low
golden retracement hit and price bounces back lower
new high is formed: golden retracement hit and price bounces back higher
price break previous high and hits fibonacci extensions -0.618 and -1
price continues rising forming a regular bearish divergence with RSI
once uptrend is broken, price falls dramatically
first target is 0.618 retracement level, where you see a very small retracement due to strength of sellers
second target is previous low, which is broken and retested many time from below (bearish retest)
third target is fibonacci extension range (in this case 1.414 is almost hit)
as an hidden bullish divergence with RSI was created, price goes back up
This is a premium indicator , so send me a private message in order to get access to this script.
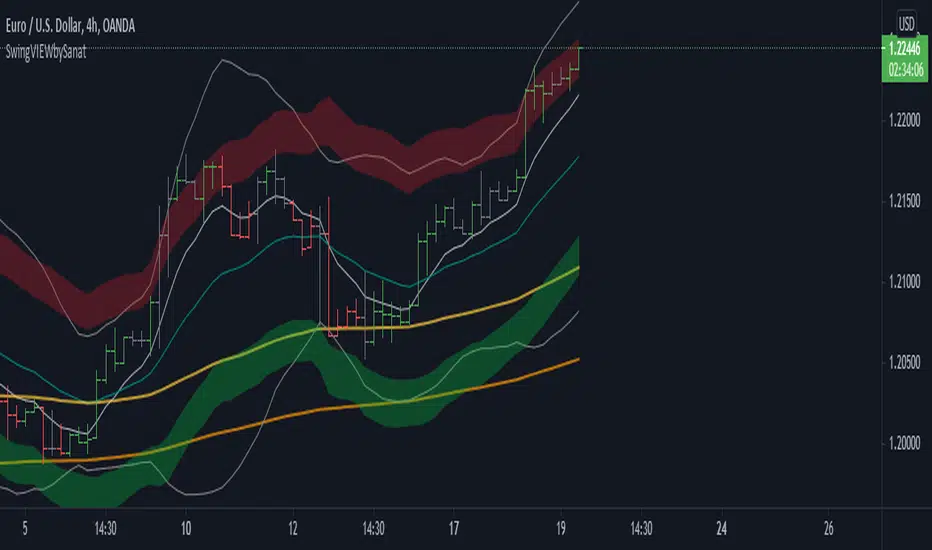
SVIEWThis is momentum based indicator
Input
1. Two EMA
2. Stochastic
Thought process
1. Difference between fast and slow ema has a oscillating nature.
2. Stochastic %k %d crossover gives early signals
3. early entry gives low risk high reward setup
Calculation
1. A= EMA (fast) - EMA (slow)
2. B =Stochastic(%K)-Stochastic(%D)
When A is increasing and B is positive, bar is green
When A is decreasing and B is negative, bar is red
Else, bar is black
Use
This is an early entry signal system. When used with Channel trading system, it gives high probability, low risk high reward setups
Example
When price has breached below -2 Keltner channel, and impulse candle turns green, go long (or sell put options )
29 minutes ago
Release Notes:
This is combination of
1. Ema diff
2. stochastic
3. Keltner channel
4. Bollinger bands
5. bunch of EMAs
Thought process
1. Difference between fast and slow ema has a oscillating nature.
2. Stochastic %k %d crossover gives early signals
3. early entry gives low risk high reward setup
Calculation
1. A= EMA (fast) - EMA (slow)
2. B =Stochastic(%K)-Stochastic(%D)
When A is increasing and B is positive, bar is green
When A is decreasing and B is negative, bar is red
Else, bar is black
Use
This is an early entry signal system. When used with Channel trading system, it gives high probability, low risk high reward setups
Example
When price has breached below -2 Keltner channel, and impulse candle turns green, go long (or sell put options )
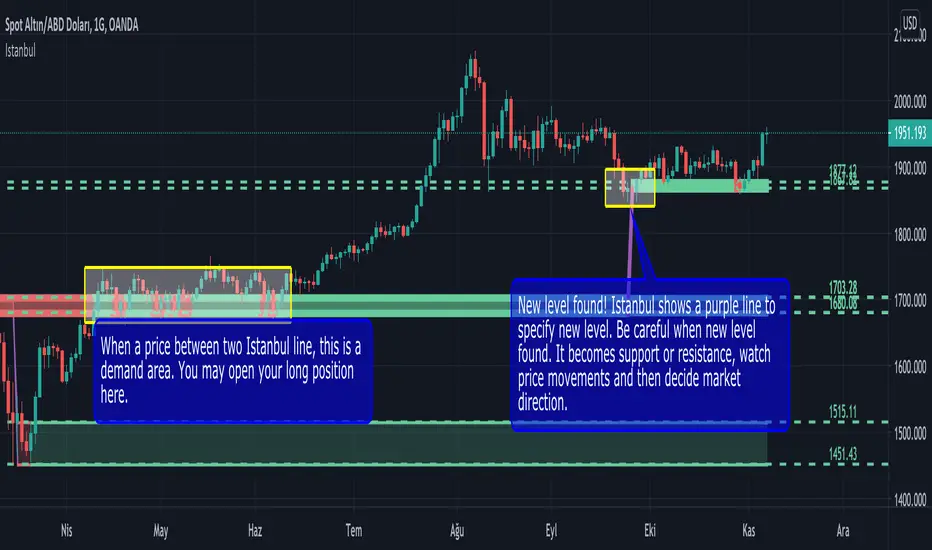
Istanbul by MMEN
I'm proud of to introducing Istanbul indicator. Istanbul is a smart support/resistance indicator based on price action. It analyzes price with different lengths and decide where is the high volume and reversal pattern.
There are 5 different lengths. They are 20, 100, 200, 500 and 1000. Each levels specified by different tickness. 20 is the thinnest and 1000 is the thickest. You can easily track levels by thickness. 20 has the lowest and 1000 has the highest impact on price movement.
There is an other field named as Precision. If you want to see more levels on the assets, please increase precision value. Otherwise decrease. For example, If you want to see more strong levels, you can set precision to 2. Otherwise set precision to 10. Default is 5.
Istanbul is also uses volume as a decision point. So you can adjust Volume Multiplier as you wish. Default is 1.5.
Lines have 3 different colors.
Green: It's support. Price above this level.
Red: It's resistance. Price below this level.
Purple: It's indecision. Waiting for confirmation.
Istanbul shows important levels as a channel. If prices moves between two lines, this channel is the starting point for new trend. It may be long or short. Watch prices and make your decision.
TR
Istanbul indikatörünü sizlere tanıtmaktan gurur duyuyorum. Istanbul, price action felsefesine göre destek ve direnç noktalarını belirleyen akıllı bir indikatördür. Fiyat hareketlerini farklı uzunluklarda geriye giderek inceler ve yüksek hacimli dönüş formasyonları gördüğü zaman destek ve direnç noktalarını çizer.
5 farklı seviye vardır. Bu seviyeler zayıftan güçlüye doğru 20, 100, 200, 500, 1000'dir. Her seviye gücüne göre farklı kalınlıkta çizilmiştir. 20 en ince, 1000 ise en kalın çizgidir. Grafiğe bakarken kolayca kalınlıklarına ve inceliklerine göre destek/direnç noktalarının gücünü anlayabilirsiniz.
Precision değişkeni ise Istanbul'un hassasiyetini ayarlar. Bu yüzdesel bir değişkendir. Varsayılan olarak %5 ayarlanmıştır. Eğer daha keskin ve net destek/direnç noktaları görmek isterseniz bu yüzdeyi düşürmeniz gerekir. Örneğin 2 yapabilirsiniz. Eğer daha çok destek/direnç noktası görmek isterseniz bu değeri 10 olarak ayarlayabilirsiniz.
Istanbul'un karar mekanizması içinde hacim de etkin bir rol alıyor. Volume Multiplier seçeneğeni isteğinize göre değiştirebilirsiniz. Bu değerin 1'den küçük olmaması gerekir.
Çizgilerin 3 farklı rengi vardır.
Yeşil: Destek noktası. Fiyat bu seviyenin üzerinde.
Kırmızı: Direnç noktası. Fiyat bu seviyenin altında.
Mor: Kararsızlık. Indikatör onay bekliyor.
Istanbul önemli seviyeleri bir kanal olarak gösterir. Eğer fiyat kanal içinde hareket ediyorsa, bu kanal yeni trendin başlayacağı seviyelerdir. Bu trend yükseliş ya da düşüş trendi olabilir. Fiyat hareketlerine bakarak long ya da short pozisyon açabilirsiniz.
EXAMPLES || ÖRNEKLER
AAPL
GBPUSD
ATOMBTC
XU100
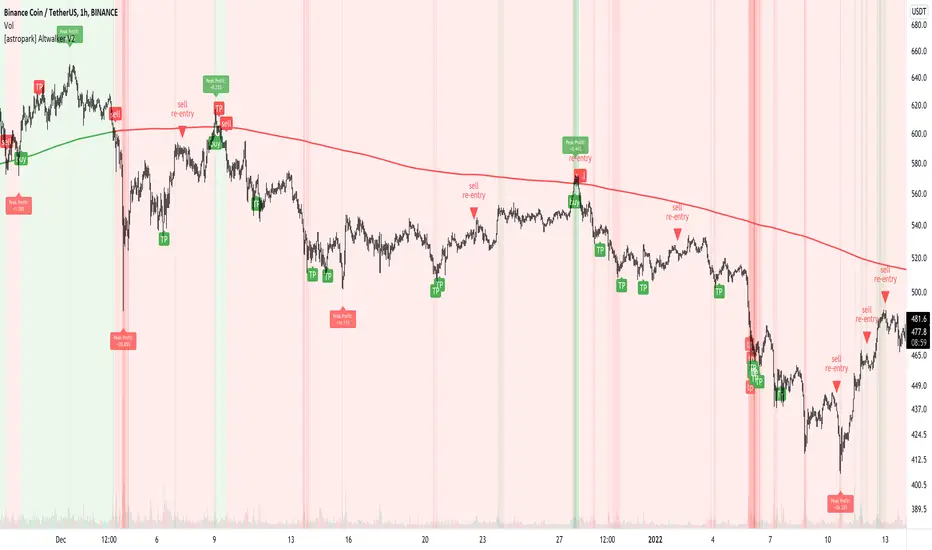
[astropark] Altwalker V2Dear Followers,
today I'm happy to share with you Altwalker V2 , an updated version of the former Altwalker for lower timeframes (from 5 minutes to 4 hours).
It is both a Swing and Scalping Strategy indicator , based on a simple trend following theory , mainly designed for Cryptocurrencies, Altcoins and of course Bitcoin.
Here you can see the Altwalker V1:
Based on Moving Average, Altwalker V2 on low timeframes dynamically identifies market resistance and support, so in which trend a cryptocurrency is during time:
green trendline and background means bullish trend , in fact it start with a "buy" signal
red trendline and background means bearish trend , in fact it start with a "sell" signal
if a series of buy and sell appears (this may happen especially in lower timeframes), this means price is in consolidation or distribution phase, so be prepared for a new trending phase coming soon, always remembering that taking profits is awesome and managing your risk by defining you position size and having a stoploss is a must in trading
To help in Taking Profits, Altwalker integrates also 2 special tools besides the trend highlighter:
Overbought and Oversold RSI Signals , which appear both as darker background (the darker the color, the more the price is in overbought/oversold) and green "ob"-"tp" / red "os"-"tp" labels (they optionally pop up only on a configurable stronger overbought/oversold condition) (you can enable/disable it optionally)
Peak Profit Tracker , which resets every time a new trade start and keeps track of price fluctuation during the trade: the message is don't be too much greedy and take profits or lock them with a stoploss in profit (you can enable/disable it optionally)
You can edit many options in order to
enable/disable showing buy/sell signals
enable/disable showing trendline
edit trendline variant (you have 2 options, by default variant 1 is selected)
enable/disable showing trend as background
enable/disable showing RSI TP signals
edit RSI length, overbought (OB) and oversold (OS) levels
enable/disable showing peak profits on each trade
The user who wants to use this strategy, especially via an automated bot, must always set a stoploss (example 150$ from entry on bitcoin ) or use a proper risk management strategy .
This is not the "Holy Grail", so use it with caution. It's highly suggested to use a proper money management .
This script will let you set all notifications you may need in order to be alerted on each triggered signals.
Here there are some examples how Altwalker V2 works on many timeframes and markets:
LINK/USDT 1h
XLM/BTC 1h
ETH/BTC 1h
ETH/USDT 1h
COMP/USDT 1h
YFI/USDT 15m
NEO/BTC 5m
VET/USDT 15m
This is a premium indicator , so send me a private message in order to get access to this script .
SWAVEThis uses combination of
1. EMA difference
2. stochastic
Green column = up move
Red column = down move
Silver column = neutral

Ultimate VWAP Bands- Ultimate VWAP Bands is a script that helps to decide and further clarify areas of oversold and overbought conditions.
- For example, when the price is in the lowest band it is extremely oversold relative to the VWAP . Hence it should be considered a good place to buy with a high risk to reward payoff.
- Each band is set at a fixed offset away from the VWAP . The "VWAP Band Multiplier" adjusts this and is a key part of the script. This allows the indicator to be adjusted based on the assets volatility . For example, with Crypto. A multiplier of 1 would be strongly advised. Whilst a multiplier of 0.1-0.25 would be useful for currency pairs.
- This indicator can be used for all manners of trading. However, it is most effective when used for scalping and swing trading.

[blackcat] L3 Price Positioning IndexLevel: 3
Background
Are you tired of traditional Japanese candlesticks? Do you want to try a new type of candle master chart?
Function
L3 Price Positioning Index is totally brand-new candle chart invented by myself. This main chart can provide effective resistance and support levels, and you can see where the price is running at any time. There are 3 key circle lines. Green circle line is used to indicate oversold support or breakthrough support levels; yellow circle line indicates the midline position where prices may pause; and red circle line indicates overbought resistance or breakthrough resistance levels.
There are two types of candlestick charts.
The first type candles are mid-to-long-term trend candles, navy represents an uptrend and the length of the candle represents a change in intensity; maroon represents a downward trend and the length of the candle represents a change in intensity. This trend candle is the effective support and resistance level of the second type short-term swing candle.
The second type candles are short-term candles fluctuate around the first medium- and long-term trend candles. The second short-term candle is divided into five colors: green means pump; fuchsia means retracement in the ascending process; yellow means bullish reversal signal; red means dump; blue means price rebound in the descending process.
Key Signal
THREE KEY LINES:
htop --> red circle line, overbought resistance or pump breakout threshold
hmid --> yellow circle line, price pause zone, sideways may happen here
hbot --> green circle line, oversold support or dump breakout threshold
MID-LONG TERM CANDLES:
x22,x33 --> navy for up and maroon for down trend, they are important support or resistance for short term price movements
SHORT TERM CANDLES:
1. bearreboun --> rebounce in down trend candle with blue color
2. pump --> up trend pump candle with green color
3. bullreversal --> bullish reversal candle with yellow color
4. dump --> bearish dump candle with red color
5. bullretra --> retracement in up trend candle with fuchsia
Pros and Cons
Pros:
1. Long term trend identification by three lines for overbought, oversold and breakouts
2. Mid term trend support and resistance with navy and maroon candles
3. Short term price behaviors are classified into 5 types of candles in blue, green, yellow, red and fuchsia
Cons:
I invent this to solve traditional JP candlestick shortcomings. If you find anything on Cons, just feedback to me for improvements.
Remarks
Brand-new Candle System invented by myself
Readme
In real life, I am a prolific inventor. I have successfully applied for more than 60 international and regional patents in the past 12 years. But in the past two years or so, I have tried to transfer my creativity to the development of trading strategies. Tradingview is the ideal platform for me. I am selecting and contributing some of the hundreds of scripts to publish in Tradingview community. Welcome everyone to interact with me to discuss these interesting pine scripts.
The scripts posted are categorized into 5 levels according to my efforts or manhours put into these works.
Level 1 : interesting script snippets or distinctive improvement from classic indicators or strategy. Level 1 scripts can usually appear in more complex indicators as a function module or element.
Level 2 : composite indicator/strategy. By selecting or combining several independent or dependent functions or sub indicators in proper way, the composite script exhibits a resonance phenomenon which can filter out noise or fake trading signal to enhance trading confidence level.
Level 3 : comprehensive indicator/strategy. They are simple trading systems based on my strategies. They are commonly containing several or all of entry signal, close signal, stop loss, take profit, re-entry, risk management, and position sizing techniques. Even some interesting fundamental and mass psychological aspects are incorporated.
Level 4 : script snippets or functions that do not disclose source code. Interesting element that can reveal market laws and work as raw material for indicators and strategies. If you find Level 1~2 scripts are helpful, Level 4 is a private version that took me far more efforts to develop.
Level 5 : indicator/strategy that do not disclose source code. private version of Level 3 script with my accumulated script processing skills or a large number of custom functions. I had a private function library built in past two years. Level 5 scripts use many of them to achieve private trading strategy.

Swing PointsAn indicator that identifies Swing Points (highs and lows) and then determines highs and lows of those swings. Works on all timeframes.
This is not my invention. It is a generic concept that I picked up from the trading world.
First level swings are termed as Short term Highs and Short term Lows (STH and STL)
The second level swings are termed as Long term Highs and Long term Lows (ITH and ITL)
An STH is formed when the 2nd high is higher than the highs on either side.
An ITH is formed when the 2nd STH is higher than the STH on either side.
Likewise logic for lows.
An example, A bullish trend can be expected if an ITH level is taken out after a ITL is formed after the ITH.
Inside bars: Inside bars are ignored. They can be marked, turned off by default.
Also, a "X" is placed over a swing point if two consecutive swings form simultaneously. This is turned off by default.

[blackcat] L2 Swing Oscillator Swing MeterLevel: 2
Background
Swing trading is a type of trading aimed at making short to medium term profits from a trading pair over a period of a few days to several weeks. Swing traders mainly use technical analysis to look for trading opportunities. In addition to analyzing price trends and patterns, these traders can also use fundamental analysis.
Function
L2 Swing Oscillator Swing Meter is an oscillator based on breakouts. Another important feature of it is the swing meter, which confirms the top or bottom's confidence level with different color candles. The higher of the candles stack up, the higher confidence level is indicated.
Key Signal
absolutebot ---> absolute bottom with very high confidence level
ltbot ---> long term bottom with high confidence level
mtbot ---> middle term bottom with moderate confidence level
stbot ---> short term bottom with low confidence level
absolutetop ---> absolute top with very high confidence level
lttop ---> long term top with high confidence level
mttop ---> middle term top with moderate confidence level
sttop ---> short term top with low confidence level
fastline ---> oscillator fast line
slowline ---> oscillator slow line
Pros and Cons
Pros:
1. reconfigurable swing oscillator based on breakouts
2. swing meter can confirm/validate the bottom and top signal
Cons:
1. not appliable with trading pairs without volume information
2. small time frame may not trigger swing meter function
Remarks
This is a simple but very comprehensive technical indicator
Readme
In real life, I am a prolific inventor. I have successfully applied for more than 60 international and regional patents in the past 12 years. But in the past two years or so, I have tried to transfer my creativity to the development of trading strategies. Tradingview is the ideal platform for me. I am selecting and contributing some of the hundreds of scripts to publish in Tradingview community. Welcome everyone to interact with me to discuss these interesting pine scripts.
The scripts posted are categorized into 5 levels according to my efforts or manhours put into these works.
Level 1 : interesting script snippets or distinctive improvement from classic indicators or strategy. Level 1 scripts can usually appear in more complex indicators as a function module or element.
Level 2 : composite indicator/strategy. By selecting or combining several independent or dependent functions or sub indicators in proper way, the composite script exhibits a resonance phenomenon which can filter out noise or fake trading signal to enhance trading confidence level.
Level 3 : comprehensive indicator/strategy. They are simple trading systems based on my strategies. They are commonly containing several or all of entry signal, close signal, stop loss, take profit, re-entry, risk management, and position sizing techniques. Even some interesting fundamental and mass psychological aspects are incorporated.
Level 4 : script snippets or functions that do not disclose source code. Interesting element that can reveal market laws and work as raw material for indicators and strategies. If you find Level 1~2 scripts are helpful, Level 4 is a private version that took me far more efforts to develop.
Level 5 : indicator/strategy that do not disclose source code. private version of Level 3 script with my accumulated script processing skills or a large number of custom functions. I had a private function library built in past two years. Level 5 scripts use many of them to achieve private trading strategy.

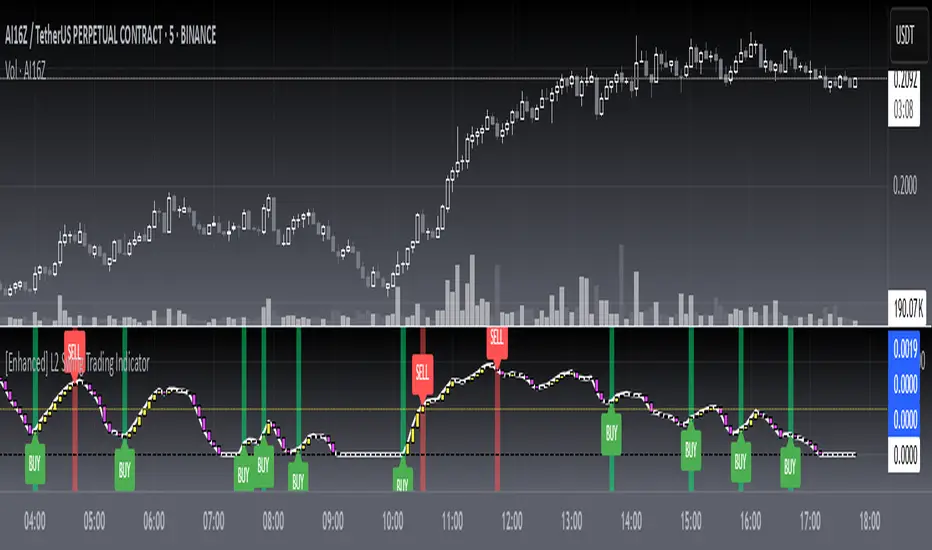
[blackcat] L2 Swing Trading IndicatorLevel: 2
Background
Swing trading is a type of trading aimed at making short to medium term profits from a trading pair over a period of a few days to several weeks. Swing traders mainly use technical analysis to look for trading opportunities. In addition to analyzing price trends and patterns, these traders can also use fundamental analysis.
Function
L2 Swing Trading Indicator
Key Signal
trend --> trend line with color candles standing for trend strength
pump --> whale pump indicator
top --> top zone for selling point
bbuy --> botton zone for buying point
varr1 ---> for selling points
bullbear --> use 50 as bull bear boundary
Pros and Cons
Pros:
1. Clear to see the trend reversals with strength changes
2. Whale pump indicator confirm the validity of trend reversals
Cons:
1. oversold zone is hidden due to using zero line as bottom
Remarks
NA
Readme
In real life, I am a prolific inventor. I have successfully applied for more than 60 international and regional patents in the past 12 years. But in the past two years or so, I have tried to transfer my creativity to the development of trading strategies. Tradingview is the ideal platform for me. I am selecting and contributing some of the hundreds of scripts to publish in Tradingview community. Welcome everyone to interact with me to discuss these interesting pine scripts.
The scripts posted are categorized into 5 levels according to my efforts or manhours put into these works.
Level 1 : interesting script snippets or distinctive improvement from classic indicators or strategy. Level 1 scripts can usually appear in more complex indicators as a function module or element.
Level 2 : composite indicator/strategy. By selecting or combining several independent or dependent functions or sub indicators in proper way, the composite script exhibits a resonance phenomenon which can filter out noise or fake trading signal to enhance trading confidence level.
Level 3 : comprehensive indicator/strategy. They are simple trading systems based on my strategies. They are commonly containing several or all of entry signal, close signal, stop loss, take profit, re-entry, risk management, and position sizing techniques. Even some interesting fundamental and mass psychological aspects are incorporated.
Level 4 : script snippets or functions that do not disclose source code. Interesting element that can reveal market laws and work as raw material for indicators and strategies. If you find Level 1~2 scripts are helpful, Level 4 is a private version that took me far more efforts to develop.
Level 5 : indicator/strategy that do not disclose source code. private version of Level 3 script with my accumulated script processing skills or a large number of custom functions. I had a private function library built in past two years. Level 5 scripts use many of them to achieve private trading strategy.
GODXBT 2.0 GODXBT 2.0
This script helps you to understand the market situation
Script includes :
. Support & resistance tool
. Smoothing filter to reduce noise on the signals
. Take Profits points
. 222 EMA (Works as Support and resistance , customizable you can change the length as per your requirement )
customizable switches to turn on/off
* S/R Switch (Support/Resistance)
* Smoothing filter Switch (to reduce noise)
* TP points (take profits piont)
how to trade :
Buy/Long when " BUY " signal appears
Sell/Short when " SELL " signal appears
take profits on " TP+ " for shorts and " TP- " for longs
for stop loss use support and resistance lines ( mentioned in chart )
small cross above/below the candle shows Support/Resistance getting built
Signal confirmation on candle Close
and Bar colors for trend strength
Red bearish , white for sell exhaustion
Blue bullish , white for buyers exhaustion
Script includes Alerts for BUY and SELL signals as well as TP+ and TP- signals
*** all the details I have mentioned on chart please check the chart ***
DM FOR ACCESS

Ichimoku Clouds with Trend IdentificationThis is another version of the Ichimoku Clouds indicator where I have added logic to evaluate the current chart as either Bullish, Bearish, or Mixed, depending on 4 factors:
1. Is the price above/below the cloud?
2. Is the conversion line above/below the base line?
3. Is the lagging span above/below the cloud?
4. Is the rightmost cloud green/red?
If all conditions point the same direction, then the chart will be labelled "Bullish" or "Bearish". Otherwise it will be labelled "Mixed".
