TDITDI
- Calculate strength and market direction by analyzing relative strength
- Ribbon mode, according to the TDI conditions
- Candlestick same as TDI Ribbon colors
- 6 colors to define market strength
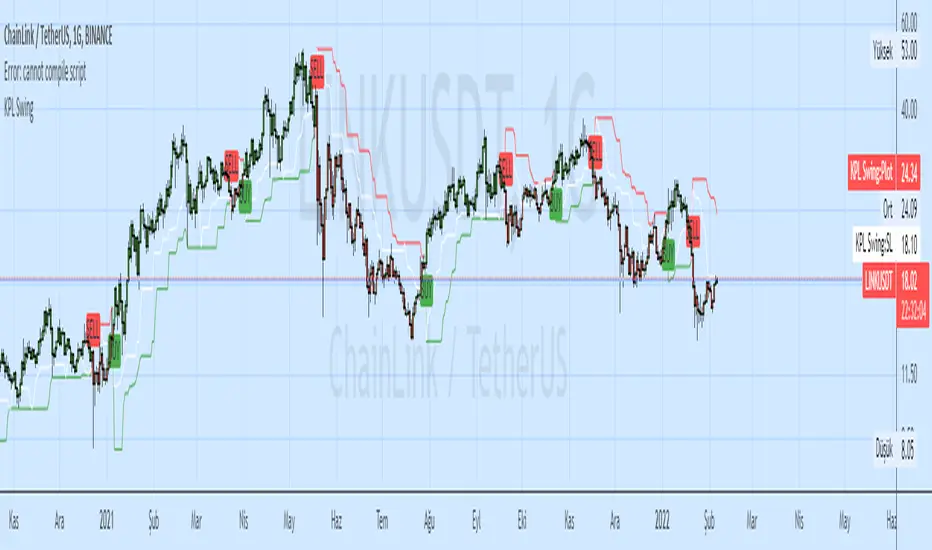
Swing
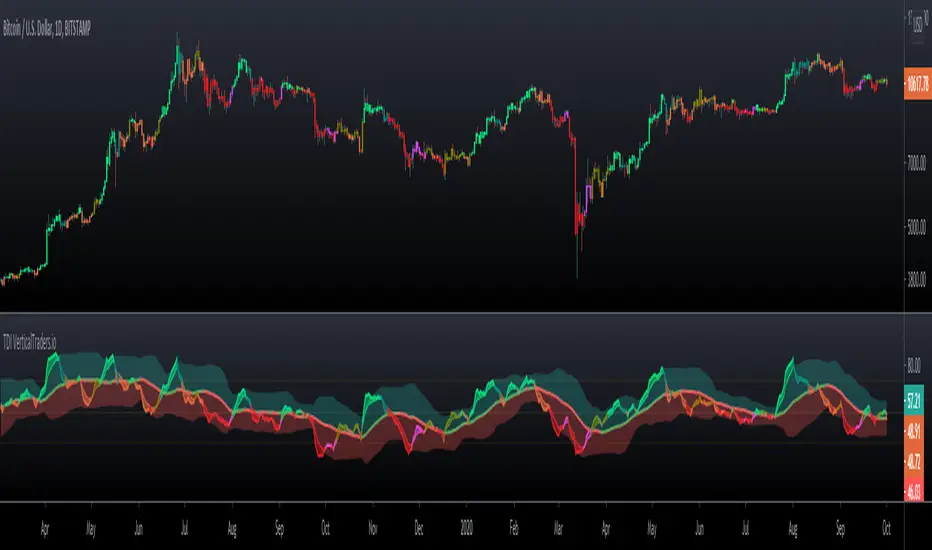
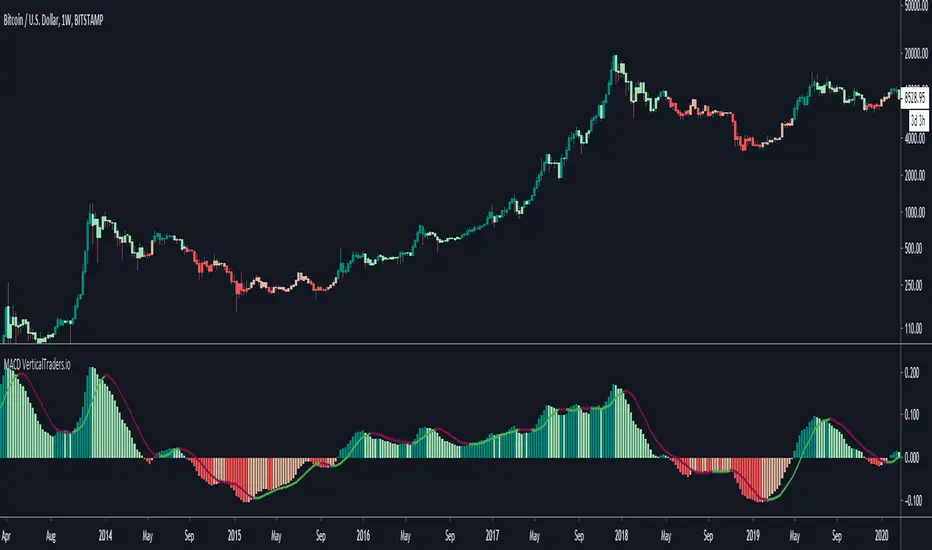
MACDMACD
- Enhanced MACD
- Shows the MACD in a simple way, to facilitate its analysis
- Histogram mode and Normal mode
- MACD color depends on its values
- Candlestick same as MACD colors
- Calculate the MACD with EMA or SMA
- Allow to use the RSI Source for calculations
- Log chart option
Pro Ribbon Multi MAPro Ribbon Multi MA
- A simple way to see the movements of several MA
- Ribbon of many types of MA: sma , ema , dema , smma , hull, etc
- Trend Color
- Custom Period of 10 MA

HL ChannelHL Channel
- The channel shows the trend based on highs and lows, and possible points of take profit and exists
- Trend Indicator for Long and Short entries
- It can be used as a trend indicator or as a trailing stop loss
- Long and Short Labels and Alerts
- Configurable in Periods and Simple Mode
Simple Mode:

Simple TrendSimple Trend
- Show levels to continue on Trend
- Trend Indicator for Long and Short entries
- It can be used as a trend indicator or as a trailing stop loss
- Long and Short Labels and Alerts
- Configurable in Periods and the type of MA for the calculation

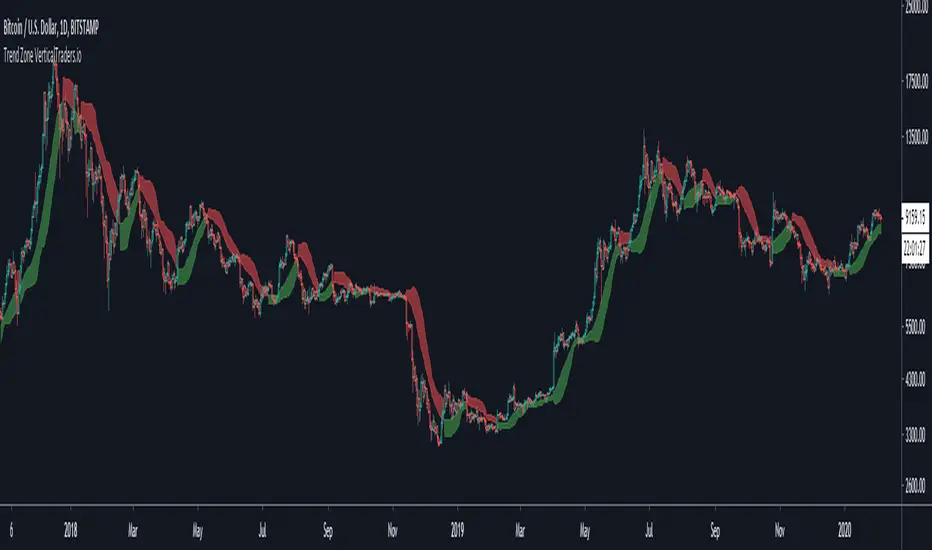
Trend ZoneTrend Zone
- Shows the risk areas to continue in a trend
- Trend Indicator for Long and Short entries
- It can be used as a trend indicator or as a trailing stop loss
- Long and Short Labels and Alerts
- Configurable in Periods and the type of MA for the calculation
Trend ProTrend Pro
- Trend Indicator for Long and Short entries
- It can be used as a trend indicator or as a trailing stop loss
- Long and Short Labels and Alerts
- Configurable in volatility values and periods

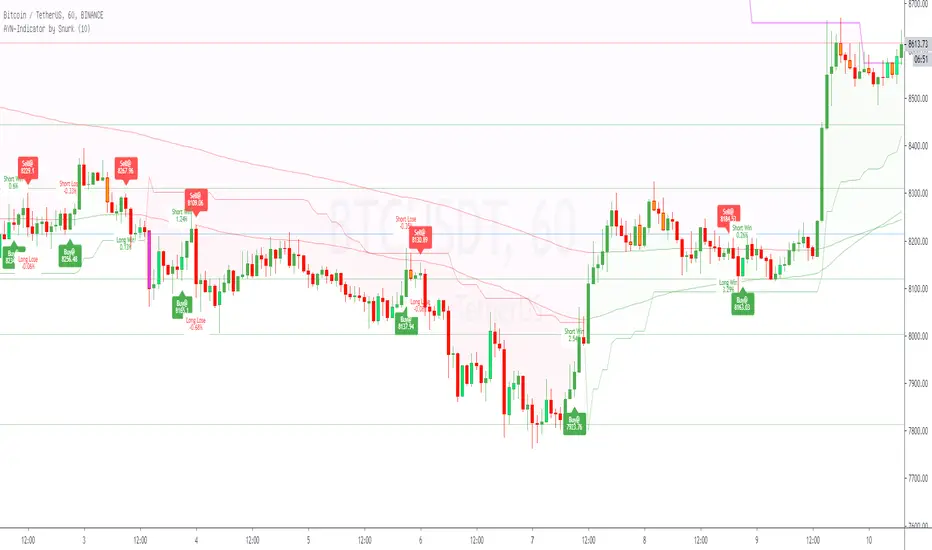
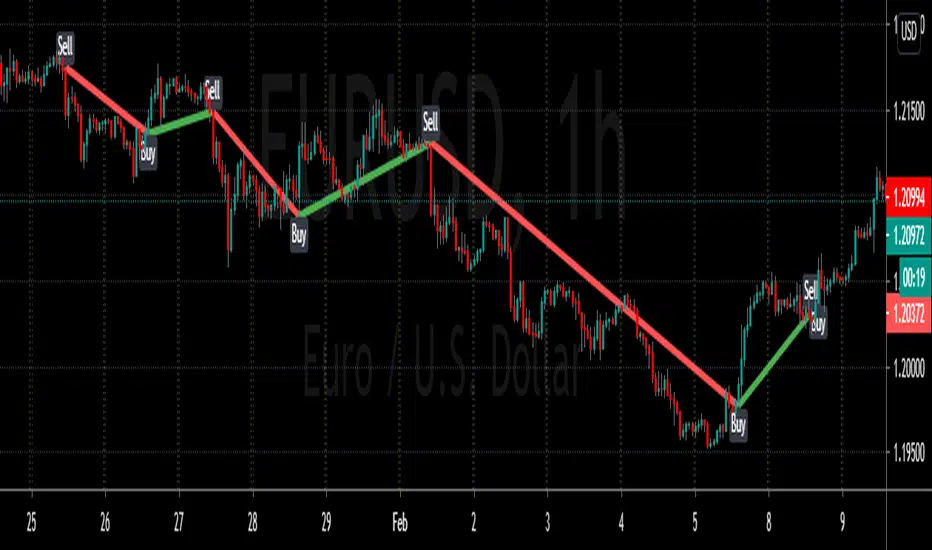
AYN: Buy-, Sell-, Trend- and SwingSignals incl. AutoFibo
Hi,
i want to introduce you to my AllYouNeed-Indicator. I calculate the buy sell signals within different timeframes independent in wich timeframe you are, therefore Pinescript suppose the Signal could be repainted. I was not able to fix this error, but after frequent checks of the result i haven't found a single repaint. Please try it out and let me know me, if you still get caught by a repaint.
Features:
- Short, Mid and Longterm-Trends
- Buy and Sell Signals and Results as well with Labels (Prices, Percentage, Win/Lose)
- Length Multiplier for different Marketsituations
- Trend-Signals with Barcolors (Lime=Uptrend, Fuchsia=Downtrend)
- Swing-Signals with Barcolors (Lime=Upswing, Orange=Downswing)
- Auto-Fibonacci with changing Linecolors as Support(green) / Resistance(red)
Hope you like it, feel free to contact me for further informations.
Please leave a comment on what I can do better, thanks.
Best regards,
snurk
Cyatophilum H.A. Swing [ALERT SETUP]Hi guys, to celebrate the beginning of a new altcoins cycle, I created a Swing trade Indicator. (It's a joke, there will not be any altcoins cycle)
Cyatophilum Heikin Ashi Swing
This indicator will allow us to create one strategy for each pair and never miss those big swings ever again!
HOW BEAT BUY & HOLD WORKS
This kind of strategy is a safe long term investment , usually played in high timeframes such as 4H, 1D etc.
It is perfect for beginners in trading as the process is very simple: buy and sell when you receive the alert. The high timeframes allows to trade manually by receiving alerts on your phone or email, but you also can automate it if you prefer.
The primary goal of these strategies is to increase your capital faster than someone simply holding the asset .
The trades are made with no leverage and 100% equity . It is for those who want to grow their portfolio fast without risking to lose everything. You can use several strategies at once, in this case split your equity accordingly.
HOW DOES IT WORK?
The Heikin Ashi candles are very usefull. This strategy is built upon H.A. candles but is used on normal candles, because H.A. candles price are an average of real candles and we want to know the real price. I did the trick by recalculating the H.A. open, high, low and close with the original formula based on the real candles's ohlc. This allows me to use the strategy tester and backtest with real results.
HOW TO USE
Creating a signal is as simple as adding the indicator called to your chart and click "Set alert". Select "Once per bar close" for your alert options.
There are 3 alerts:
- BUY
- SELL
- BUY OR SELL (for free TV users)
Sample Backtest results
Bitcoin/Dollar
Ethereum/Bitcoin
Basic Attention Token/Bitcoin
> > Start using the indicator now < <
Note: This version is the ALERT SETUP. You can find the Backtest version on my profile scripts.


Jack's beginner strategyHi everyone,
Using this script on lower time frames 15 min. 30 min. 1 hr . gives you early signals. However for too small time frames, large changes can occur in the price thus affecting the exponential moving averages very fast.
This strategy is explained by CryptoJack, which mentions it is a simple beginner strategy, but an experienced trader can certainly benefit from it because it brings ease. This script plots the EMA's with the periods: 8, 13, 21, 55. Then it looks when the EMA's are alined from smaller period to higher period (representing an uptrend). The moment this happens a green triangle appears at the buy point. When the opposite occurs an exit signal is given by showing a red triangle.
You can also manually create an alert for when the triangles appear.
Always use with cautious, keep an eye out after buy signal whether an uptrend is really forming (confirmation of the uptrend) looking for higher highs and higher lows.
For improvements, ideas or questions, please send me a private message.

SWING POINTS HOUNDTry's to find possible swing points and reversal points using mutli time frame moving averages and Fibonacci retracement with multiple lengths. Can be used to gauge trends and find potential entry points for trend following strategies. Can also be used to find potential price reversal points and areas of heavy resistance/support.

[RESEARCH] Kagi Chart IdentifierA heuristic approach to identify Kagi chart type.
This tool allows to identify:
ATR Kagi charts (see ^)
Traditional Kagi charts
Works correctly with other chart types:
Classic Candles
Heikin-Ashi
Line Break
PnF
ATR Renko
Traditional Renko
Range Bars
Do not forget @everget

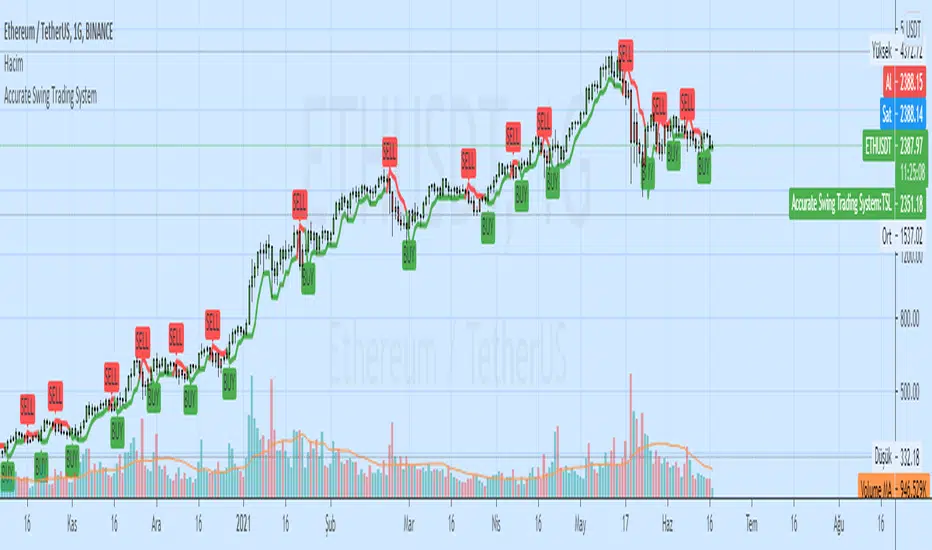
Auto Swing Trading IndicatorAuto Swing Trading Indicator is based on 5 different technical indicators. This indicator uses these different indicators to determine the best time to BUY and SELL. This Indicator will not Repaint and signal at candle close is final.
This Indicator is best used on 4 hrs timeframe. But can be used on any timeframe.
Targets (T1) are displayed when there is a BUY signal. Targets are based on the combination of previous High and Low.
The strategy is to sell 50% at T1 and ride until the SELL signal posted.
Buy and Sell Alerts are added for this indicator. In the Alerts window, please choose the option "Once the candle closes" for best results.
More features are going to be added to this indicator.
This is an invite-only script. Please message me for access

B3 FisherTransformThis is the indicator from the trading strategy I posted recently. I do like Fisher Transform a lot on day bar charts. However, the smaller you go in bar interval, the less I feel it is as usable. At that point, any oscillator will usually do. When comparing the slope of the line and direction to the chart price action using day bars, I get a great sense of when to enter into a swing.
The indicator is often earlier to turn than other indicators, therefor, occasionally a trade may take a day to 3 days to start moving well in the desired direction, but it is never late which is very nice!
Use in conjunction with your support and resistance levels to find great entry points on reversals.
Use in conjunction with moving averages to find the reentry into a continuing trend.
Features include bar paint, zero line, and adjustable deviation values to target trend continuation and possible max oscillation reversal trades.
Enjoy! ~B3 d^.^b

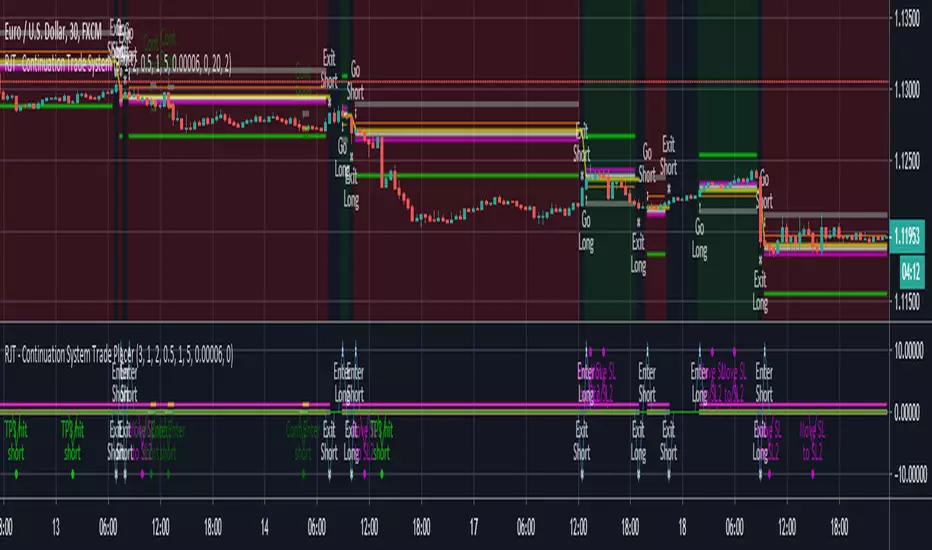
RJT CONTINUATION TRADE STRATEGY - TRADE ENTRY INDICATORThis indicator is used to trade the RJT Continuation Trade Strategy . The fundamental idea behind this strategy is that a trend will continue. Initial entries are placed along with take profit targets and stop losses, then additional entries are placed when pull backs are identified.
This indicator highlights when to place Trade Entries - both long and short, as well as Take Profits and Stop Losses, below the price chart.
This is most powerful when combined with the RJT Continuation Trade Strategy - Trade Overview Indicator
RJT CONTINUATION TRADE STRATEGY - TRADE OVERVIEW INDICATORThis indicator is used to trade the RJT Continuation Trade Strategy . The fundamental idea behind this strategy is that a trend will continue. Initial entries are placed along with take profit targets and stop losses, then additional entries are placed when pull backs are identified.
This indicator gives an overview of where Trade Entries - both long and short, as well as Take Profits and Stop Losses are on the price chart.
This is most powerful when combined with the RJT Continuation Trade Strategy - Trade Entries Indicator

scalping signalshere is a scalping indicator that give you signals with different ways..
share with me your idea for improving it...

10/20 MA Cross-Over with Heikin-Ashi Signals by SchobbejakThe 10/20 MA Heikin-Ashi Strategy is the best I know. It's easy, it's elegant, it's effective.
It's particularly effective in markets that trend on the daily. You may lose some money when markets are choppy, but your loss will be more than compensated when you're aboard during the big moves at the beginning of a trend or after retraces. There's that, and you nearly eliminate the risk of losing your profit in the long run.
The results are good throughout most assets, and at their best when an asset is making new all-time highs.
It uses two simple moving averages: the 10 MA (blue), and the 20 MA (red), together with heikin-ashi candles. Now here's the great thing. This script does not change your regular candles into heikin-ashi ones, which would have been annoying; instead, it subtly prints either a blue dot or a red square around your normal candles, indicating a heikin-ashi change from red to green, or from green to red, respectively. This way, you get both regular and heikin ashi "candles" on your chart.
Here's how to use it.
Go LONG in case of ALL of the below:
1) A blue dot appeared under the last daily candle (meaning the heikin-ashi is now "green").
2) The blue MA-line is above the red MA-line.
3) Price has recently breached the blue MA-line upwards, and is now above.
COVER when one or more of the above is no longer the case. This is very important. You want to keep your profit.
Go SHORT in case of ALL of the below:
1) A red square appeared above the last daily candle (meaning the heikin-ashi is now "red").
2) The red MA-line is above the blue MA-line.
3) Price has recently breached the blue MA-line downwards, and is now below.
Again, COVER when one or more of the above is no longer the case. This is what gives you your edge.
It's that easy.
Now, why did I make the signal blue, and not green? Because blue looks much better with red than green does. It's my firm believe one does not become rich using ugly charts.
Good luck trading.
--You may tip me using bitcoin: bc1q9pc95v4kxh6rdxl737jg0j02dcxu23n5z78hq9 . Much appreciated!--

TH_FLB SwingFLB Swing - Looks at Beginning and End of trends and identify potential favorable swing reversals.
