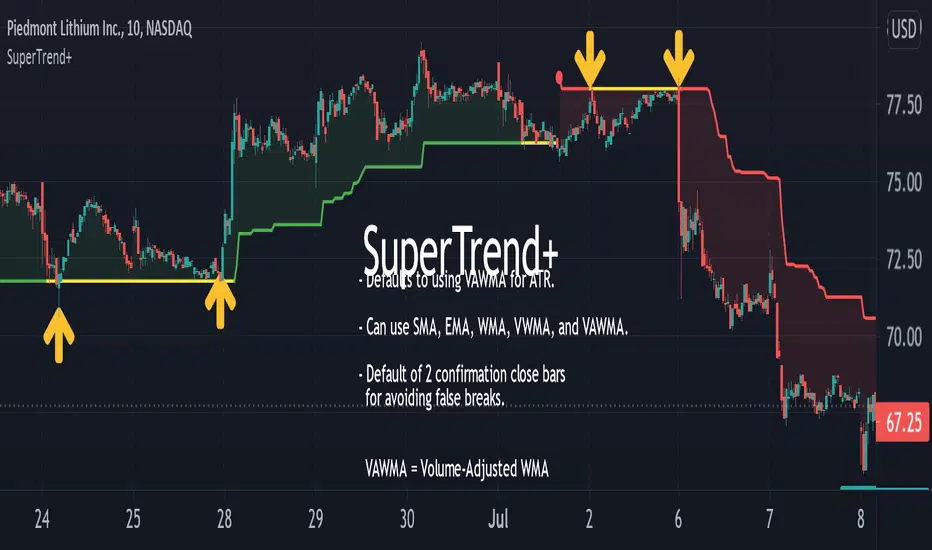
SuperTrend+Based upon popular SuperTrend (AKA: ATR Trailing Stop) indicator with the following differences and improvements:
Defaults to using Volume-Adjusted WMA ( VAWMA ) for ATR. (Can still be configured to behave exactly like classic SuperTrend.)
Can use SMA, EMA, WMA, VWMA, and VAWMA instead of just SMA.
Confirmation close bars for avoiding false breaks.
Details:
If the confirmation closing bars value is greater than zero (default of two bars), the trend will only reverse if the price closes outside the boundary for that number of bars (does not need to be consecutive) or if the opposite side of the bar exceeds the boundary.
The confirmation bar count will reset if the trend has resumed (opposite boundary is broken).
Confirmation examples:
In a down-trend, but the previous two bars close above the boundary.
In a down-trend, but the low of the previous bar exceeds the boundary.
In a down-trend, but the high of the previous bar exceeds the boundary when confirmation bars are set to zero.
Supertrend
Supertrend with Percent Difference from CloseThis script improves the Supertrend indicator by displaying a label that shows the percent difference between the latest closing price & the Supertrend.
This comes in handy when one is using the Supertrend value as a stoploss level. For instance, one would like to have a maximum stop loss level of 8%. Instead of calculating how much percent the price is away from the Supertrend, one can look at the percent label & make an informed decision as to whether initiating a position would have favourable risk/reward or not.
Another utility would be selling into strength when one is using the Supertrend as a trailing stop loss. For instance, if the price is a certain percentage far away from the Supertrend, one may conclude that the price is now extended & either price correction or time correction would ensue, & decide to sell into strength.

Iceberg Intraday LearningHOW TO USE?
A setup which contains Most Useful 14 indicators, that any Intraday Trader might require.
Below will see one by one-
1) Trend Following Icebergs - (3 Different Indicators to choose from)
--> The trend following indicators optionally.
--> Very simple to understand, yellow indicating sideways, green - going upside, and red - going downside.
--> Trend Indicator - 1st Iceberg is HMA Crossovers
--> Trend Indicator - 2nd Iceberg is SMA (20). It will change its color according to the trend of the market.
--> Trend Indicator - 3rd Iceberg is RSI(14) in EMA, will be plotted at the bottom of the screen.
2) Classic Pivot Points & Floor Pivot Points: - ( 2 Different Indicators to choose from )
--> Classic Pivot Points having 5 Supports & Resistances on the chart.
--> Floor Pivot Points, At the middle, it is pivot point (PP) level and multiple support and resistance levels
--> Floor Pivot Points is a very known indicator that indicates whether that helps in-stock selection.
--> This is a very crucial indicator as it shows the Floor Pivot Points levels for the next day.
--> One can make a learn by looking at next day's Floor Pivot Points that whether the stock is going to be trendy/sideways the next day.
3) Support/Resistance
--> This indicator is used for finding support and resistance levels on charts.
--> Helps in getting pullbacks and exit levels
--> Lines will change color automatically if any candle closes above the support/resistance line. It will change it's to green.
--> Similarly, it will change its color to red if the price is below the support
4) Highs/lows, SuperTrend Up Down ( 2 Different indicators to use )
--> Plots Highs / Lows in the selected time frame.
--> Added SuperTrend indicator with length 10 with source HL/2 and multiplier to be 2.
5) Dynamic ATR - Average True Range (14 Days)
--> It plots 2 important levels at the starting of the day.
--> 2 bands are plotted in the morning when the market opens, resembling strong support/resistance zones.
6) First Candle
--> This will highlight the first candle that is formed of the selected time interval.
7) Bollinger Band
--> Bollinger band is also added for better catching the momentum as seen on chart.
--> The Upper and Lower Bands are used as a way to measure volatility by watching the relationship between the Bands and price
8) VWAP
--> VWAP is useful for learning trend direction in any market conditions.
9) RSI & MACD
--> Plots label indicating the status of RSI and MACD.
This works for Intraday Trades - when the resolution is kept to less than 1 hour ( Say 3 , 5 , 10 , 15 Mins), This works well when the resolution is kept to 1 Day - Good for Swing Trades spanning over a few days, This works well when the resolution is kept to 1 Day or Week - Good for Investments.
Trend Indicator - 3rd Iceberg Is a repainted based on the hybrid RSI Logic
Stop Loss - That should be done by following ones risk appetite , Ideally the open/close of the previous candle should be the stop loss for the buy/sell but everyone has their own Risk Management Strategies based on the capital deployed.
If you like it and find it useful or if you find a defect or bug , Please let us know in the comments .. that would encouraging !! for us to develop it further
Coded for learning INDIAN Markets.
CAUTION:: There could be scenarios when the breakout/breakdown candle is rejected , especially when it is long one
so it is always recommended to have a confirmation candle that open-closes above the breakout candle / open-closes below the breakdown candle.
Disclaimer: No Investment Advice Provided , You should always understand that P AST PERFORMANCE IS NOT NECESSARILY INDICATIVE OF FUTURE RESULTS.
Inspiring to learn the Pine making market learnings easier.
Thanks & Regards,
Iceberg Intraday Learning.

Papercuts Super Trend MTF v02All my scripts are part of a suite called Papercuts .
This one uses one current timeframe supertrend and adds Four Automatic Higher Timeframe Supertrends based on those same parameters to help you determine larger trends while only needing a single chart. This works quite well on 5 and 15 minute charts and will look up in time. Confident trends can be identified by having two or more lines in the same direction.
When unified, the intensity of the glow should increase a trends confidence. Unify collapses the 3 highest timeframe supertrends into the first higher timeframe supertrend. Without Unify on, the overall trends are usually easier to see at just a glance. Higher timeframe supertrends can show support or resistance and act as stop loss limit ranges if you choose. Unify keeps things a bit cleaner and more compact.
V02 updated to fsecurity for no repainting and added a 3MA trend option as well.
Thanks to @Pinecoders for helping me better understand the security function!
Here is a view with Unify on....
Here is a view with Unify off...

Supertrend BandsSupertrend Bands
What is the Supertrend indicator?
"The Supertrend indicator is a trend following overlay on your trading chart, much like a moving average, that shows you the current trend direction.
The indicator works well in a trending market but can give false signals when a market is trading in a range.
It uses the ATR (average true range) as part of its calculation which takes into account the volatility of the market. The ATR is adjusted using the multiplier setting which determines how sensitive the indicator is."
"For the basic Supertrend settings, you can adjust period and factor:
- The period setting is the lookback for the ATR calculation
- Factor is the what the ATR is multiplied by to offset the bands from price"
How to use this indicator
This indicator is inspired by a strategy I found. It includes four Supertrend indicators, each with different settings that displays trend strength and support/resistance zones. The default settings are optimal for cryptocurrency but do work quite well for traditional also. I highly recommend you try experimenting with different settings, increasing them to suit the instrument.
The bands are set from low to high, Band 1 being the fastest and Band 4 being the slowest. Band 4 is the one that sets the overall trend so when price is above Band 4, the trend is bullish and vice versa. Trend is strongest when price is above/below Band 1 and gets weaker as it filters through each band. Band 4 provides the strongest support/resistance and if that breaks the trend flips.
In the menu, you will see an option called "Remove Anti Trend?". It is enabled by default and it removes any bearish/resistance bands when the trend is up and any bullish/support bands when the trend is down. When turned off, it will show all Supertrend Bands as they are by default.
Bar Colors
Bar colors are optional and they reflect the current trend strength based on the Supertrend bands.
Alternate ways of using this indicator
You could leave everything as default or you can display individual bands. For instance, because I use many overlay indicators, most of the time I turn off all the bands and only show bar colors:
You can also turn off Bands 1 and 2 and only show the two slowest lengths:
This removes the noise of the two faster Supertrends.
Or just show the two fastest bands:
Any suggestions to improve this indicator are most welcome :)

Supertrend3n1it combines the 3 super trend indicator values to save space for more indicators in the chart , and it works perfectly with the stochastic RSI indicator

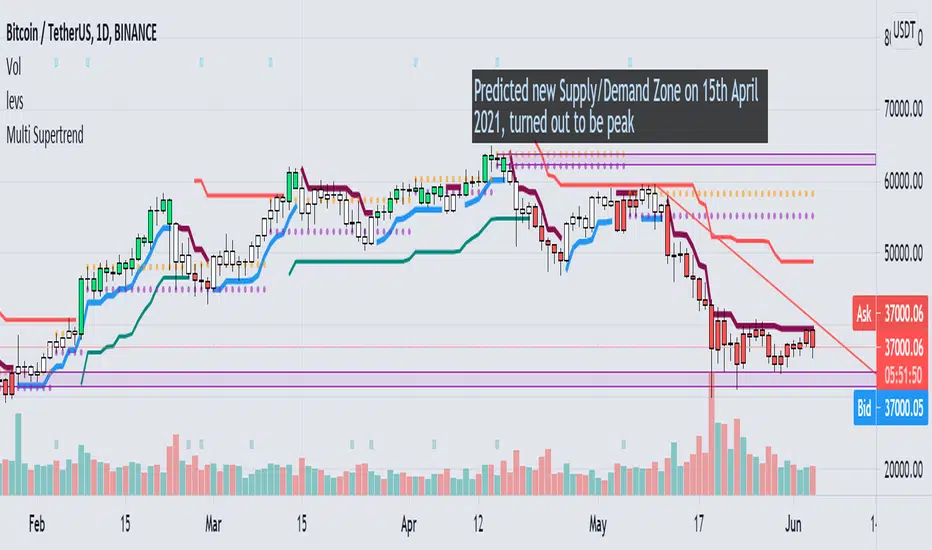
Multi Supertrend with no-repaint and HTF optionThis indicator has 2 Supertrends to filter the trend.
The Default one uses the same timeframe as chart.
The additional Supertrend is non-repaint type and can run on higher timeframes.
It has an auto-higher timeframe selection option, thanks to LonesomeTheBlue, the original author.
It is accurate on current timeframe also.
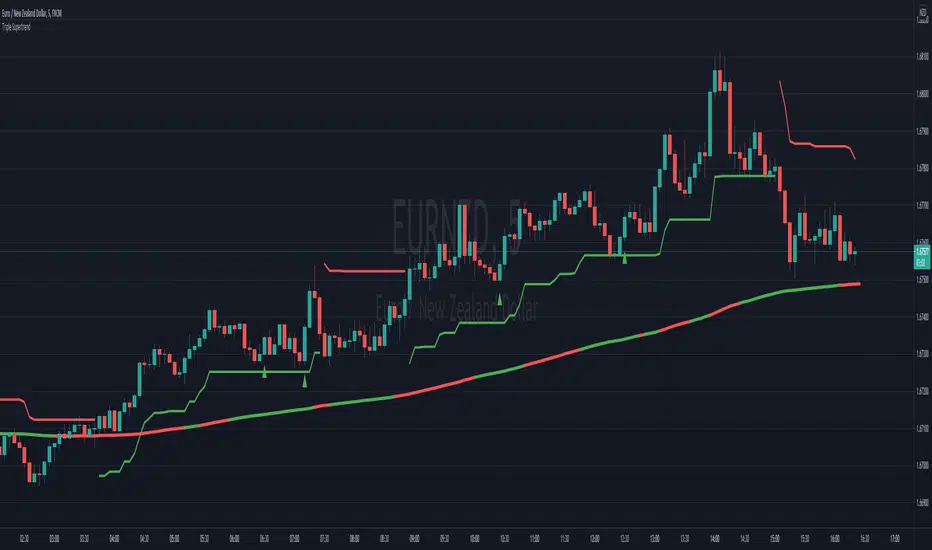
Triple SupertrendThis triple supertrend indicator uses three different supertrend indicators with different and adjustable parameters. It is useful to filter false signals, set stop losses and detect sideways markets. When two or three (depending on the trading environment) supertrend lines turn green, a long is more suitable for a long position and vice versa.

SuperTrend Oscillator [LuxAlgo]This oscillator is made of three components, all derived from the SuperTrend indicator. This approach allows the user to easily determine overbought/sold zones, identify whether a retracement is present or if the price is ranging or trending. It also allows for the anticipation of the potential price cross with the SuperTrend.
We provide additional information including whether a signal returned by the SuperTrend was false, as well as the percentage of false signals.
Settings
Length: Period of the "average true range" used in the calculation of the SuperTrend
Mult: Multiplicative factor for the "average true range"
Smooth: Determines the degree of smoothing of the histogram
Misc:
Fixed Transparency: Use a fixed transparency for the main oscillator
Show Lines: Show the lines displayed by the indicator
Show Labels: Show the labels displayed by the indicator
Usage
The indicator is in a range of (-100,100) with values closer to 100/-100 indicating a stronger trend. The main oscillator value above 0 indicates that the price is above the SuperTrend.
It is possible to identify when a retracement is present in a trend. This is often indicated by an oscillator value moving within 50/-50.
Each overbought/oversold level can be used to determine potential exit points.
The indicator also includes two additional oscillators derived from the main oscillator. A smoothed version of the main oscillator (Signal), and a smoothed version of the difference between the Main and Signal oscillators (Histogram), thus making the oscillator part of the indicator more similar to MACD.
One can use the histogram to anticipate when the price might cross the SuperTrend by comparing the sign between the main and histogram. Potential false signals can also be filtered with this method.
Certain crosses between the price and SuperTrend can be filtered out when the histogram and main oscillator have a different sign (here main = 1, histogram = -1).
We include various indications in order to analyze the signals returned by the SuperTrend. The indicator displays symbols indicating whether a signal was false or not.
A cross symbol will be displayed at the top of the displayed lines when the previous Buy signal was false, else a checkmark is displayed. Symbols displayed at the bottom of the lines are referring to sell signals. We also provide a percentage of false signals, calculated over the entire chart history.
Details
The scaling method used is similar to max-min normalization. We first compute the difference between the price and SuperTrend and divide the result by the difference between the upper and lower extremity used to compute the SuperTrend. Values higher than (1,-1) can occur when price crosses the SuperTrend and as such we use the max and min functions to attenuate these.
The filter used to compute the signal line is based on exponential averaging and is fully adaptive. The smoothing factor used for its computation is the squared value of the main oscillator, divided by length . Since higher values of the oscillator are associated with trending markets, the filter will be closer to the main oscillator when the market is ranging.

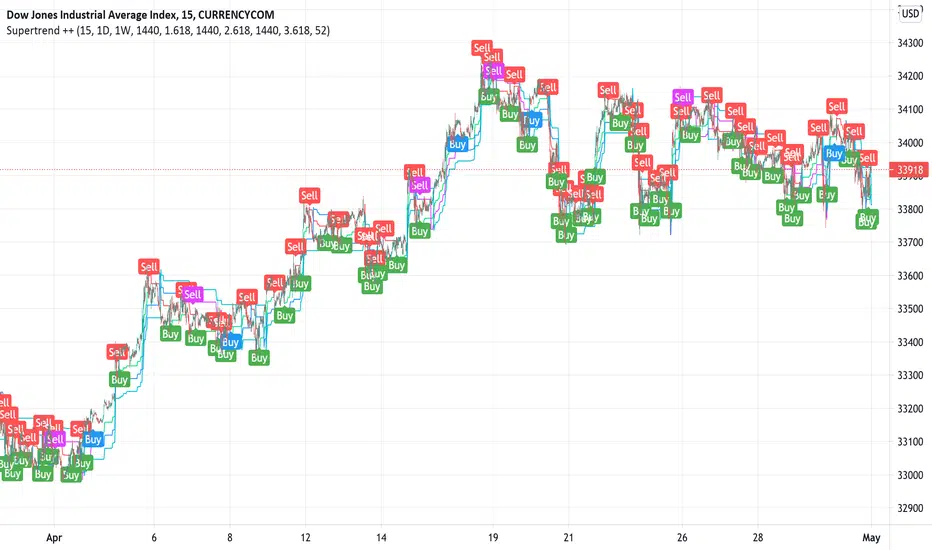
Supertrend ++Supertrend ++ is an HTF (HigherTimeFrame) Supertrend with an optional Volume Filter with adjustable value in the Settings.
Signals are represented by Green Labels (Buy) to indicate a Long Entry or Red Labels (Sell) to indicate a Short Entry.
Note that the script does not Repaint and that you have the option of placing a single Alert for the two available Alerts.
Always use the option "Once per bar" and not "Once per bar close" when placing an Alert of individual type.
If you have any suggestions or need help, please let us know in the comment area.
Good Trade everyone and remember, Risk Management remains the most important.
3 SuperTrends + ATR SL + 3 EMAsHere I have assembled 3 indicators, SuperTrend + ATR + Ema, to make them fit into one indicator to make things more organized and to save space. Check Script for original Authors of the used scripts. The UI or the indicator is far from perfect as my programming skills are very low :D

Divit Multi SuperTrendthese are all supertrend lines with different settings.
green lines indicate uptrend.
red line indicates down trend.
when all lines are green its very good uptrend - you can buy.
when all lines are red its very good downtrend - you can sell.
when few lines are red and few are green its not confirmed buy or sell.
in this situation you may confirm buy or sell with the help of other indicators.
its an easy to use indicator.

Triple Supertrend Entry SignalsThis indicator combines 3 supertrend indicators (a fast, medium and slow) with stochastic RSI and 200 EMA. It only gives short signals if price is under the 200 EMA and long signals if price is over the 200 EMA. Secondly it will only show you a short entry if the stochastic RSI is in the overbought territory and a long signal if the stochastic RSI is in the oversold territory. Finally, 2 of the supertrend lines must be over the candles for a sell and two of the supertrend lines under the candles for a buy. By default the script only displays the slow supertrend line which can be used as a guide for stop loss but the medium and fast lines can be revealed via the settings. Typically you can target 1.5 x risk for TP if using the slow supertrend line as a stop loss. Use the alerts to ensure you don't miss a potential entry.
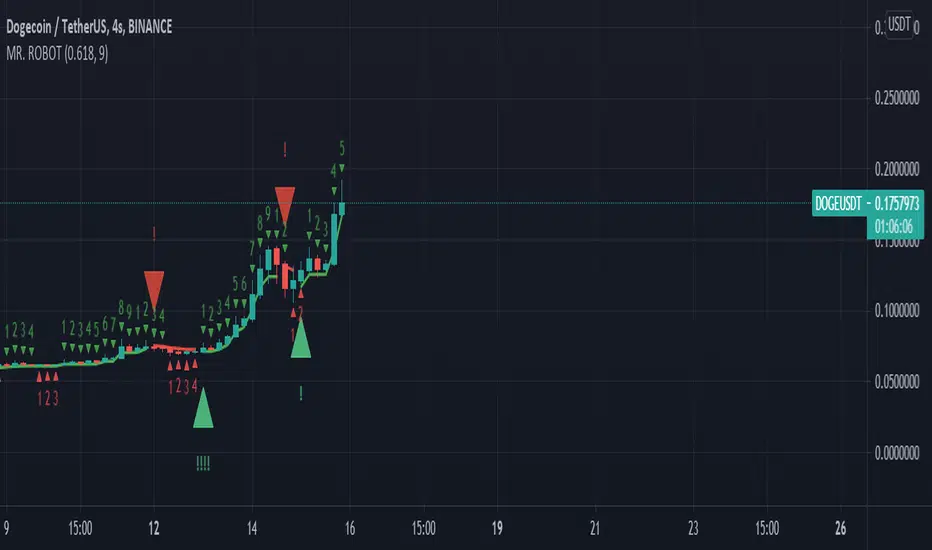
MR. ROBOT v.1.0.0This script consists of a logical blend of TD Sequental, MACD and Stochastic RSI based on the Supertrend function. In addition, these indicators use the golden proportional point of each candle as a source.
The exclamations on the signal indicating signs express the strength of the signal and consist of four levels;
! : Weak level signal
!! : Partial level signal
!!! : Medium signal
!!!! : High level signal
The fact that these interjections refer to four different levels is related to the programmatic consideration of four different indicators and functions. Since the script is based on four different indicators
basically, the exclamation numbers of the signals are related to how many indicators are signaling at the same time. However, it does not always overlap. For example, when 3 indicators signal at the same time, 3 exclamation points may not appear on the signal sign. This is because the script also takes into account special bar algorithms.
The only setting that you can intervene on the script - for now - is the multiplier and length values of the supertrend function. Changing these settings changes the signal strengths and frequencies. The script is based on the supertrend function alone, it is the ability to follow the trend after the signals given by the internal indicators. This situation decreases the rate of false signals and frequent signals in internal indicators.
This script or its author is not responsible in any way for any profits or losses arising from transactions. Does not contain investment advice.
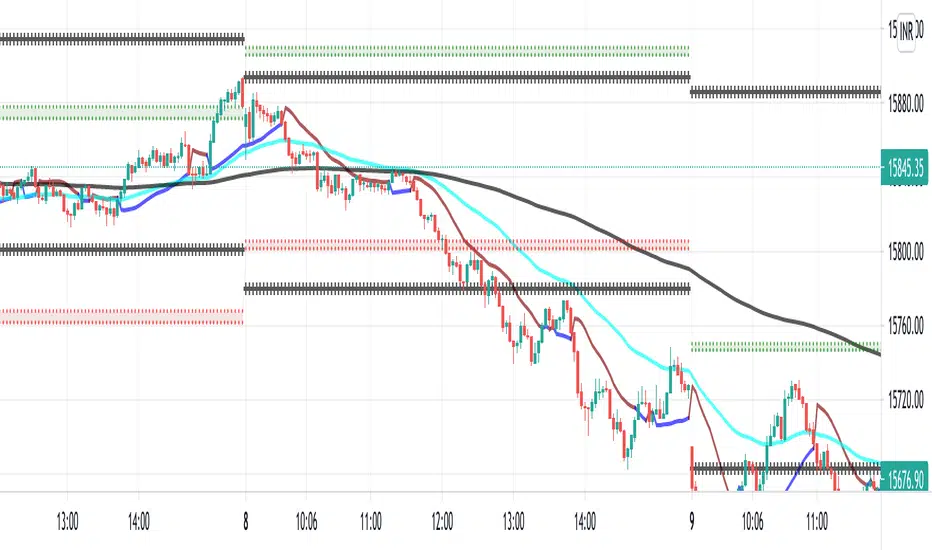
Smart Money Flow v.2.0 BY Stock_InshotsThis Indicator is made by combination of indicators as follows
1) Super Trend - Period 15,2.5
Signal Filtered on the closing basis of SMA High 20 for strength
2) Simple Moving Average - period 50
In which Purple indicates Uptrend
Orange Indicates down trend
3) Bill William's Fractal - This indicator indicates important candle for formation of swing of High or low with Triangle shape at the bottom & top on the chart .
After Signal one can wait for fractal candle formation also for Big risk reward Ration
Buy Setup : After signal Try to place long order near Sma50
Sell Setup : After signal Try to place Short order near Sma50
If missed wait for next Signal , Don't Run behind Price
Keep Trailing Your Stop loss with ATR Values
Note : Nothing is 100% , You may customize this indicator according to your values .
Best to use with other momentum / strength indicator before taking positions
Like RSI / Support & Resistance Levels
For Targets use BB% levels / Pivot Points / Fibonacci levels / Nearest Demand & Supply Zone
Thanks to the Trading view as i used open Source Codes in combination of this indicator. it helped a lot .
Feedback will be welcomed .
Refer Image

The Trend Oracle - The Ultimate Position ToolThe Trend Oracle is a superadaptive multi-timeframe Indicator
Ideal timeframes are 4H, and 1D
It is based on a combination of several other indicators including:
- The Superstrength Index - An adaptive indicator using volume weighted average of the traditional RSI, MFI and OBV
- The Superfast MACD - An adaptive zero lag MACD
- ADX Trend - A tweaked version of the ADX
- Chop Zones - A combination of 2 Chop indexes to identify trending and non trending conditions.
- The Adaptive Supertrend - An adaptive version of the Supertrend, (switching multipliers based on the market trend)
- Breakout & Breakdown - An algorithm computing volume compression and expansion to indicate breakout & breakdown signals.
- [bBullish and Bearish Divergences - Confirmed Bull and Bear divs shown as green and red dots at the top and bottom of the indicator.
Areas highlighted in Aqua are bullish, red are bearish.
Use this indicator as a tool to position yourself over longer timeframes.
Enjoy!
MM :)

Super Trend Triple - With Buy/Sell/Close and trailing S/L AlertsSuper Trend Triple by © PaulJC
Having 3 super trend indicators is a fairly well-known strategy, taking an order when all 3 lines confirm the trend
while above/below the 200ema (optional)
!!!!! Do your own backtesting on symbols you trade before trying with real funds !!!!!
That said, this works well on most time frames when trailing the stop up the trend line...
You need to see which is the best line to follow based on the symbol you are trading and select this in the options if you want alerts when it moves!
Alerts for: (Set alerts to 'Once Per Bar Close' to avoid early entry.)
Buy Signal
Sell Signal
Order Signal (Both Buy or Sell)
Change in Stop
Change in stop with stop prices (Select "Any alert() function call")
Close Position
Options/Inputs:
Show/Hide Trend Lines
Show/Hide Background Colors
Show/Hide Entry Background
Show/Hide Close Background
Show/Hide Entry / Close Arrows
Show/Hide Entry / Close Labels
Show/Hide 200EMA
Turn On/Off EMA200 Filter
Choose which Trend Line to follow for SL alerts
Turn off all alerts
Any ideas for improvements or changes, let me know :)

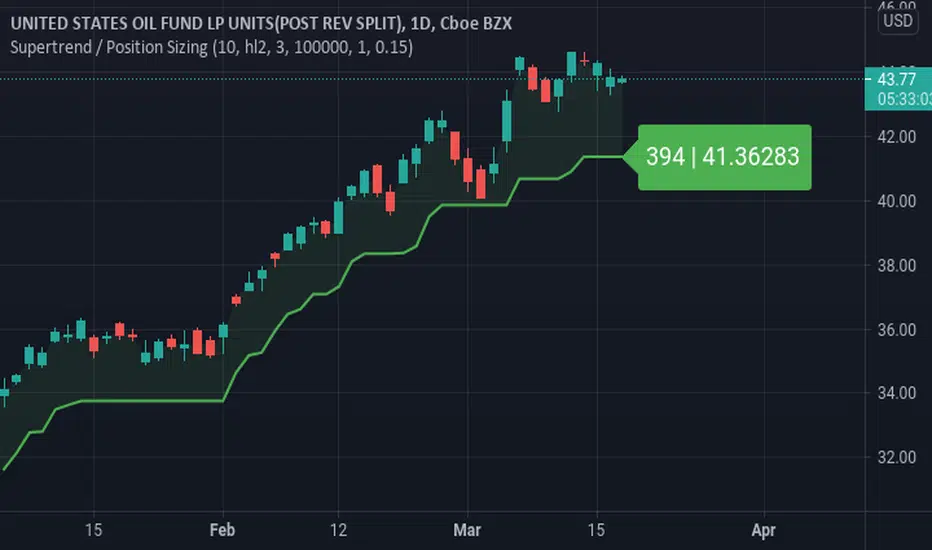
Supertrend / Position SizingSuperTrend with position sizing calculator.
This is based on SuperTrend by Kivanc. I only added the position size calculation and displaying the result.
RR 1
Software signal with Pivots/Previous day high/Previous day low combined with RR2 for better results.
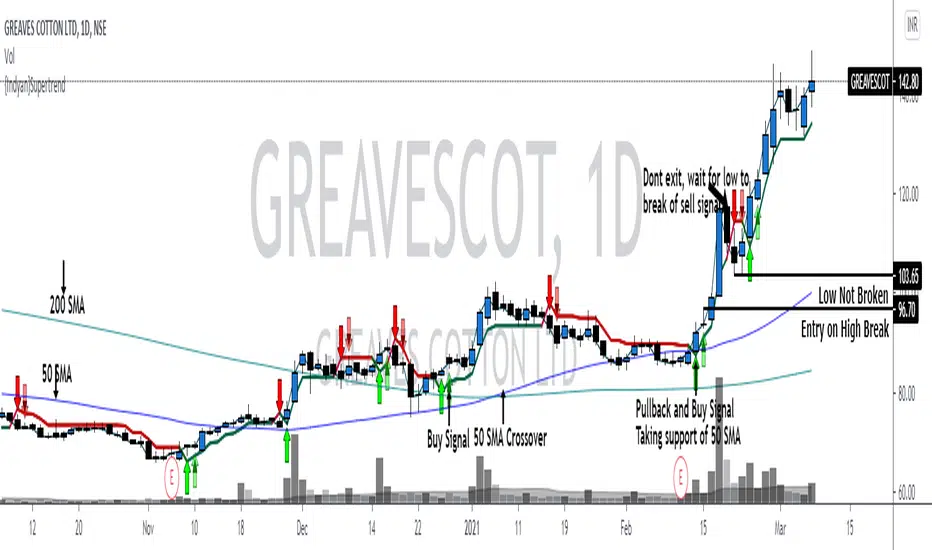
{Indyan}SupertrendHello trader friends,
A very simple but effective supertrend startegy which help u to get good RR. It is combination of 3 supertrend values with sma crossover. Enrty at pullback after sma crossover , exit only if sell signal low is broken.
I hope it will help my trader friends.
Love Indyan
MA Candles - SupertrendConverting strategy to indicator for those who want to use it as indicator.
Concepts are simple :
Calculate moving average of High, Low, Open and Close and make candles of them
Calculate ATR and derive supertrend on the moving average candles.
Alerts :
Bullish Crossover - When supertrend turns green
Bearish Crossover - When supertrend turns red
Bullish Pullback - Supertrend is green but close crossed below Moving average high
Bearish Pullback - Supertrend is red but close crossed above Moving average low
Original strategy is present here:

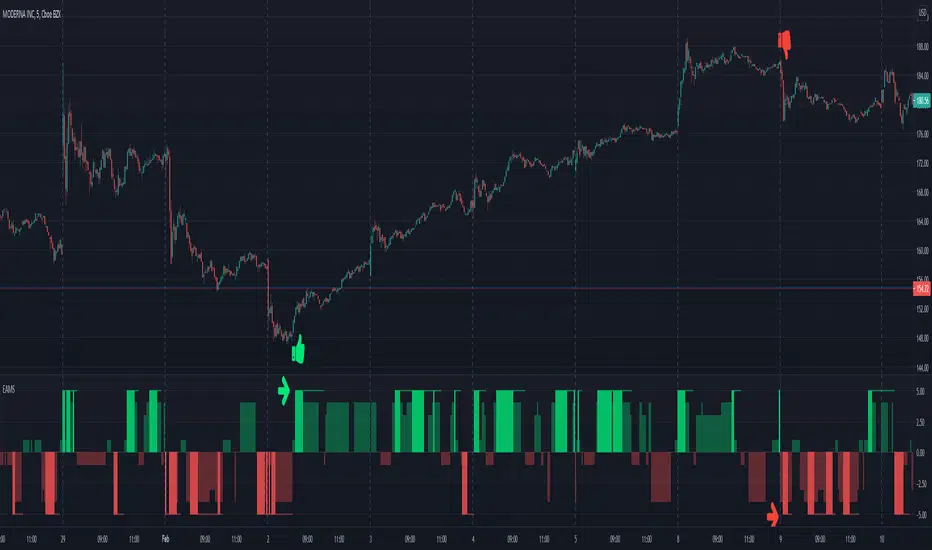
Electrified Aggressive Momentum SignalWhat this can be used for:
If you've already decided you want to trade a symbol, this can identify points of momentum alignment.
If a strong move has recently happened and you're looking for a change in momentum.
How it works:
This is a weighted combination of a Stochastic RSI and two modified SuperTrend (ATR Trailing Stop) indicators:
The Stochastic RSI signal is based upon aligned momentum and is negated at the overbought and oversold points.
The SuperTrend formula uses high and low values for calculation and both fast and slow can be adjusted for sensitivity.
Philosophy:
Signals have to be useful to humans. If a signal occurs to late, you've missed it. The intent of this indicator is to assist in timing a trade at very short time-frames. It assumes your conviction about a trade already exists, but you are trying to get an optimal entry.
Opposing momentum (weak signal) within an uptrend can be a sign that you should wait before entering. The frequency of a signal can indicate the strength of the trend. As the frequency of the aligned signal value decreases so does the reward vs risk.
Buy The Retrace studyA trend-following strategy entering pullbacks
Simple but efficient
The components of the script:
-MTF ATR based Trend
-Fib based cloud to help determine the trend
-Oscillator which is based on the current close relative to the close-only high-low range over a given period of time
The signal frequency can be changed on:
- Period - Length of the period to look for - i.e 25 means, the last 25 candles
- Bullline - signals created if oscillator above this level
- Bearline - signals created if oscillator below this level
I'd recommend taking the first few signals once the trend has changed.
Alerts are available as:
- First long / short signal
- Long / short signal
- Take profit long / short signal
- HTF trend change any direction
- HTF trend change up / down
Does not repaint - however, wait for a candle to close before entering a signal.
