Trend Reversal Alerts Strategy [Advanced]This is a hourly version of T-R.A.S It's better for houry timeframes : 2h, 3h, 4h, 6h, 12h, 1d, 4d ; otherwise use version for weeklyPine Script® stratejisisequentialvision tarafındanGüncellendi 361
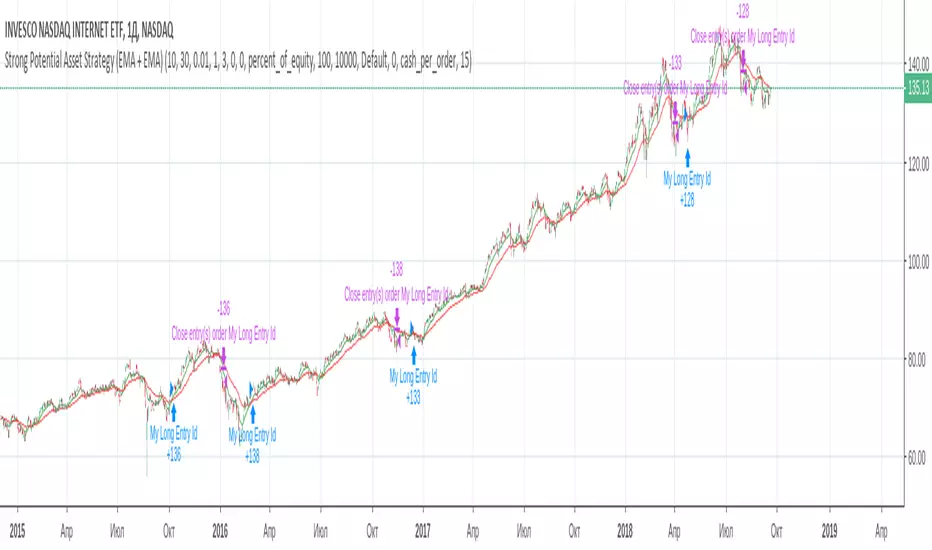
Strong Potential Asset Strategy (EMA + EMA)During experiments with the market, I found out that simple strategy is the best solution. However, I decided to bring some of my ideas on the 2 MA strategy. - Instead of SMA - there will be 2 EMA, so the strategy will be more sensitive to the latest data; - There is an option, which regulates the difference between those 2 EMAs, this should protect us from false trend enter; - There is an option "Exit tolerance", which regulates how much could be the difference between 2 EMAs after crossover. This supposed to protect us from the false trend exit. Hope this will be helpful :)Pine Script® stratejisikostia.gontarev tarafından33183
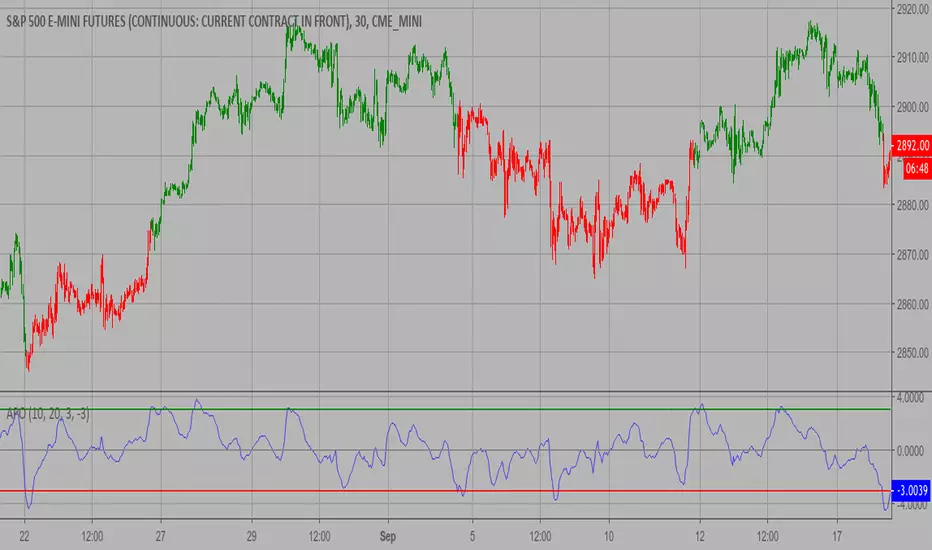
Absolute Price Oscillator (APO) Strategy 2.0 The Absolute Price Oscillator displays the difference between two exponential moving averages of a security's price and is expressed as an absolute value. How this indicator works APO crossing above zero is considered bullish, while crossing below zero is bearish. A positive indicator value indicates an upward movement, while negative readings signal a downward trend. Divergences form when a new high or low in price is not confirmed by the Absolute Price Oscillator (APO). A bullish divergence forms when price make a lower low, but the APO forms a higher low. This indicates less downward momentum that could foreshadow a bullish reversal. A bearish divergence forms when price makes a higher high, but the APO forms a lower high. This shows less upward momentum that could foreshadow a bearish reversal. WARNING: - This script to change bars colors.Pine Script® göstergesiHPotter tarafından1180
Ehlers Fisher Stochastic Relative Vigor Index StrategyBy John Ehlers from his book "Cybernetic Analysis for Stocks and Futures".Pine Script® stratejisiTr0sT tarafından33199
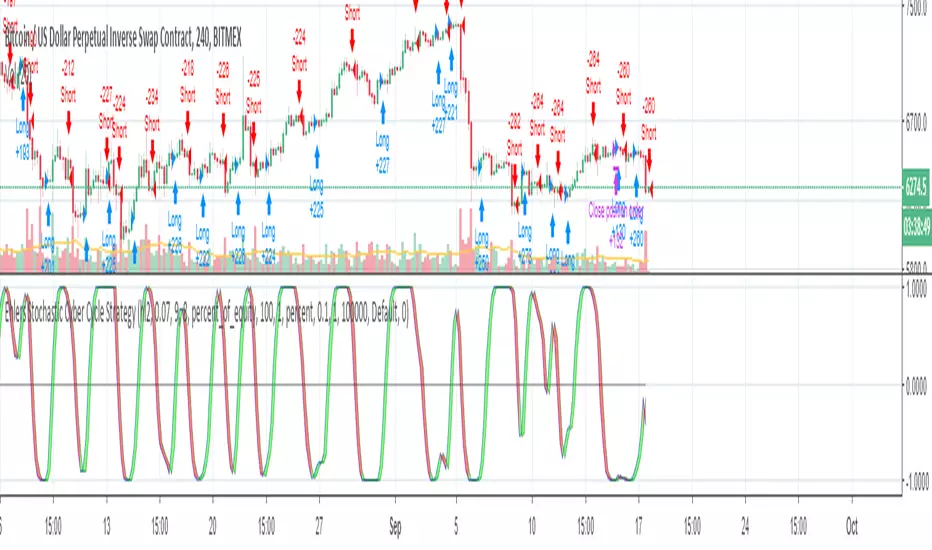
Ehlers Stochastic Cyber Cycle StrategyBy John Ehlers from his book "Cybernetic Analysis for Stocks and Futures".Pine Script® stratejisiTr0sT tarafından11115
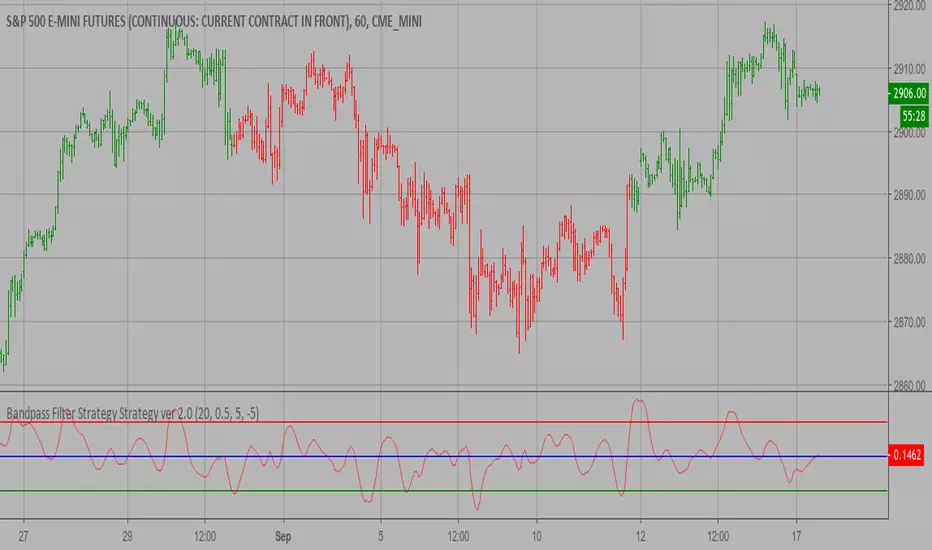
Bandpass Filter Strategy ver 2.0 The related article is copyrighted material from Stocks & Commodities Mar 2010 You can use in the xPrice any series: Open, High, Low, Close, HL2, HLC3, OHLC4 and ect... WARNING: - This script to change bars colors.Pine Script® göstergesiHPotter tarafından52
Momentum Strategy, rev.2This is a revised version of the Momentum strategy listed in the built-ins. For more information check out this resource: www.forexstrategiesresources.comPine Script® stratejisicapissimo tarafından55108
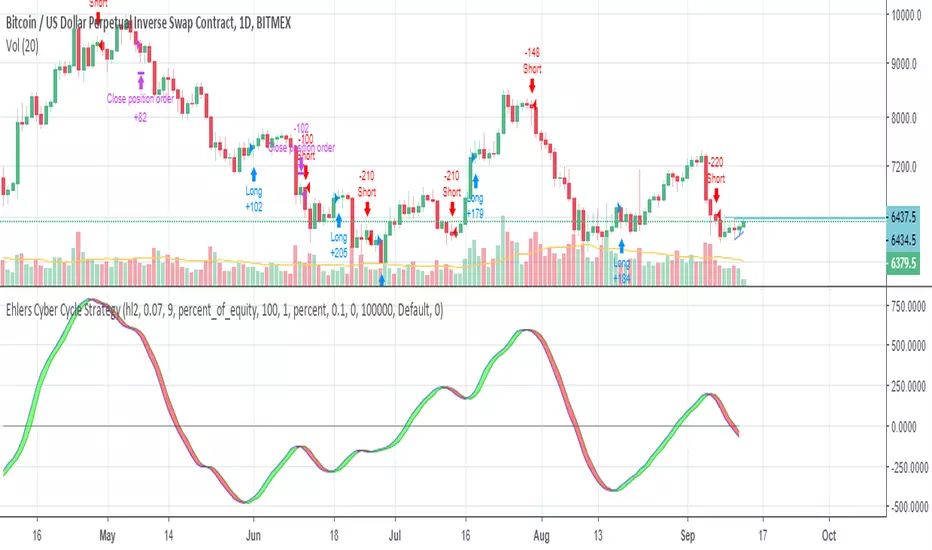
Ehlers Cyber Cycle StrategyEhlers Cyber Cycle Strategy by John Ehlers from his book "Cybernetic Analysis for Stocks and Futures". Pine Script® stratejisiTr0sT tarafından245
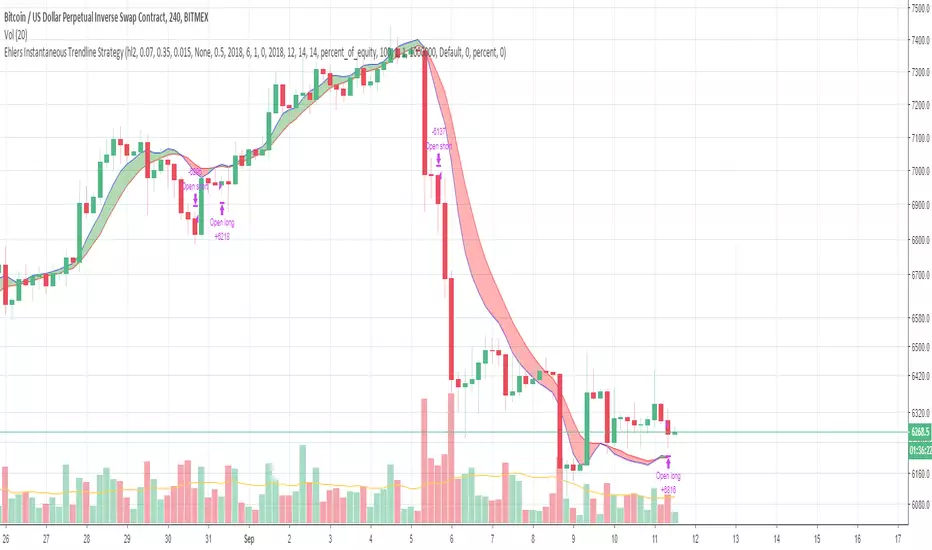
Ehlers Instantaneous Trendline StrategyInstantaneous Trendline Strategy by John Ehlers from his book "Cybernetic Analysis for Stocks and Futures". You can choose implementation of stop-loss. Don't forget to define correct spread for your instrument. Pine Script® stratejisiTr0sT tarafından33564
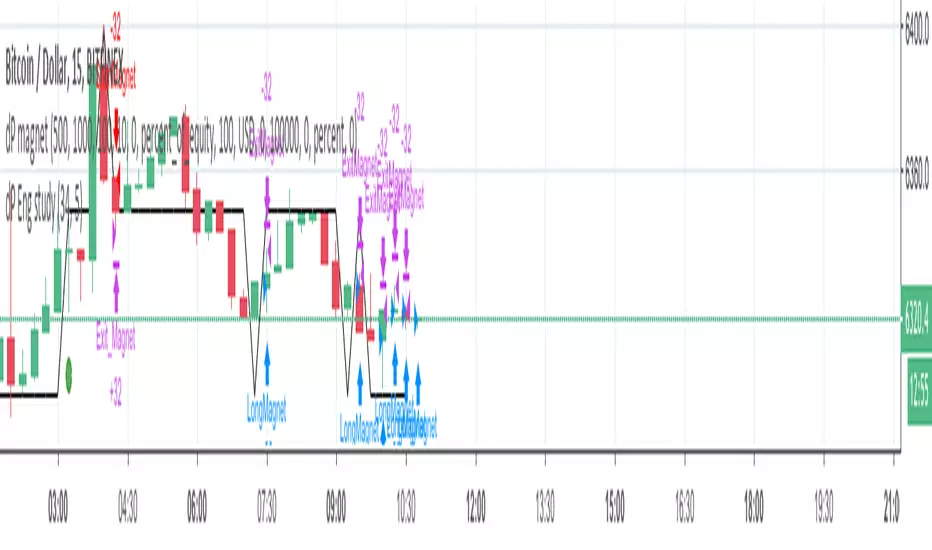
dP magnet//Strategy based on the idea that stop loss and take profit are often placed at full price levels or round numbers, whcih acts as resistance and supports levels //Buy Rules: //Actual price (close) is above round number. //Round number level was not touched in previous ten bars (arbitrary value). //Place a buy and follow the order with a trail step because price can bounce at round number (support) or can go through it. //Sell Rules are the same of buy rules but inverted. // //Need improvement on conditions' logic and round numbers definitionsPine Script® stratejisi03.freeman tarafından33144
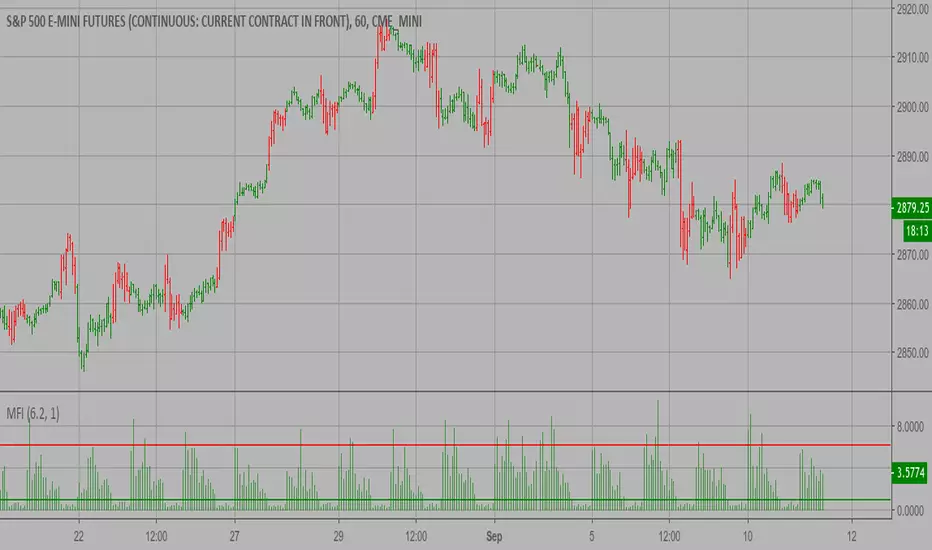
Market Facilitation Index (MFI) Strategy The Market Facilitation Index is an indicator that relates price range to volume and measures the efficency of price movement. Use the indicator to determine if the market is trending. If the Market Facilitation Index increased, then the market is facilitating trade and is more efficient, implying that the market is trending. If the Market Facilitation Index decreased, then the market is becoming less efficient, which may indicate a trading range is developing that may be a trend reversal. WARNING: - This script to change bars colors.Pine Script® göstergesiHPotter tarafından82
Strategy Backtester TemplateA template for building a strategy tester: - date range selector - stop loss - take profit - long and short strategy type selectorPine Script® stratejisikhalidsalomao tarafındanGüncellendi 133
MTF stochastic strategyThis strategy is based on MTF strategy found on Forex Factory forum and published by bobby2 (credits to him). This is quite simple but need improvement to work properly: 1- it is made for 5 min chart 2- when 15min stochastic cross above 50 and 5min stochastic is rising, buy 3- when 15min stochastic cross below 50 and 5min stochastic is falling, sell Pine Script® stratejisi03.freeman tarafındanGüncellendi 77 1 K
Gidra's RSI or MFI Strategy v 0.1Strategy based on Gregg_s indicator RSI or MFI (ru.tradingview.com) When crossing above 0 - close short, open long When crossing below 1 - close long, open short For crypto/fiat and any timeframePine Script® stratejisiroot.gidra tarafından22217
Keltner Channel Strategy The Keltner Channel, a classic indicator of technical analysis developed by Chester Keltner in 1960. The indicator is a bit like Bollinger Bands and Envelopes. WARNING: - This script to change bars colors.Pine Script® göstergesiHPotter tarafından180
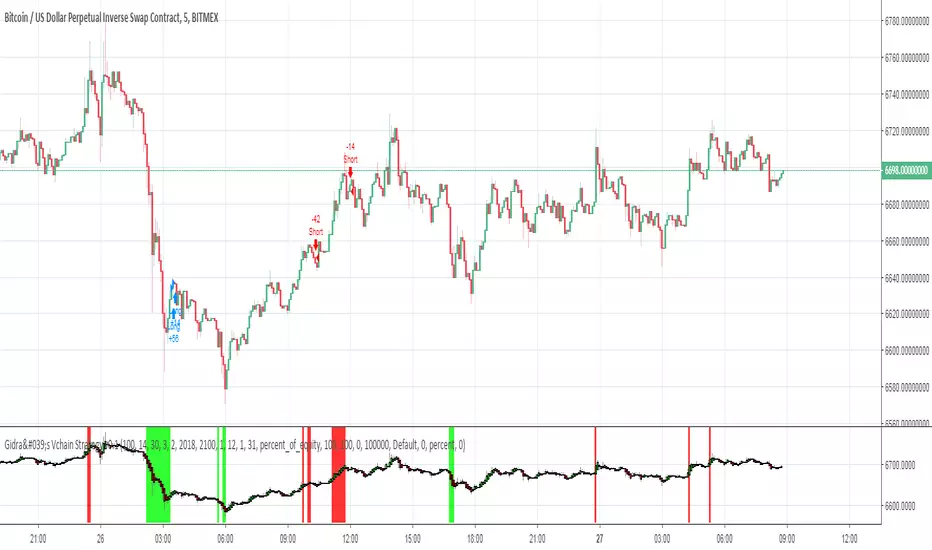
Gidra's Vchain Strategy v0.1Tested on "BTC/USD", this is a reversible strategy If the RSI is lower than "RSI Limit" (for last "RSI Signals" candles) and there were "Open Color, Bars" green Heiken Ashi candles - close short, open long If the RSI is higher than 100-"RSI Limit" (for last "RSI Signals" candles) and there were "Open Color, Bars" red Heiken Ashi candles - close long, open short - timeframe: 5m (the best) RSI Period = 14 RSI Limit = 30 RSI Signals = 3 Open Color = 2 Piramiding = 100 Lot = 100 % - timeframe: 1h RSI Period = 2 RSI Limit = 30 RSI Signals = 3 Open Color = 2 Piramiding = 100 Lot = 100 %Pine Script® stratejisiroot.gidra tarafından134
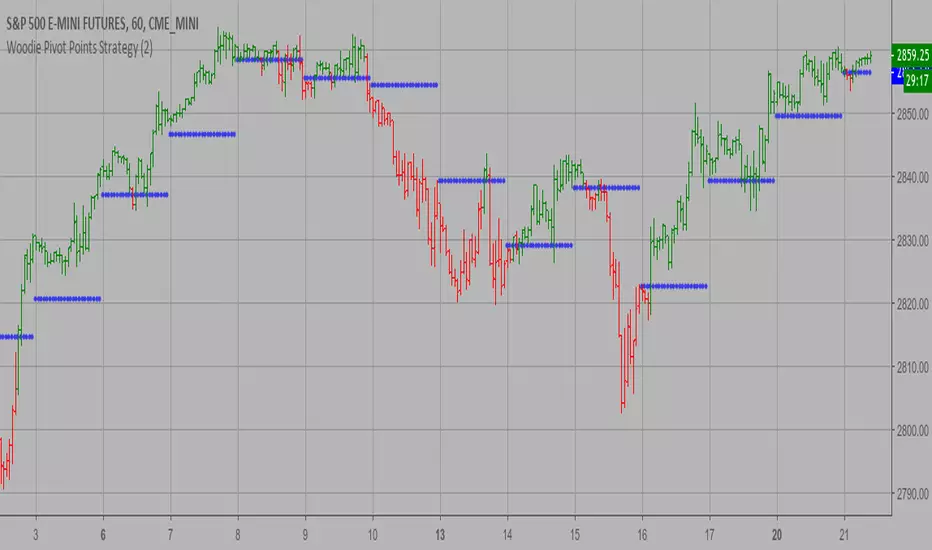
Woodie Pivot Points Strategy Simply input the vales of the high, low and closing price of the previous period to calculate the Woodie pivot point and the associated resistance and support levels for the present period. WARNING: - This script to change bars colors.Pine Script® göstergesiHPotter tarafından55190
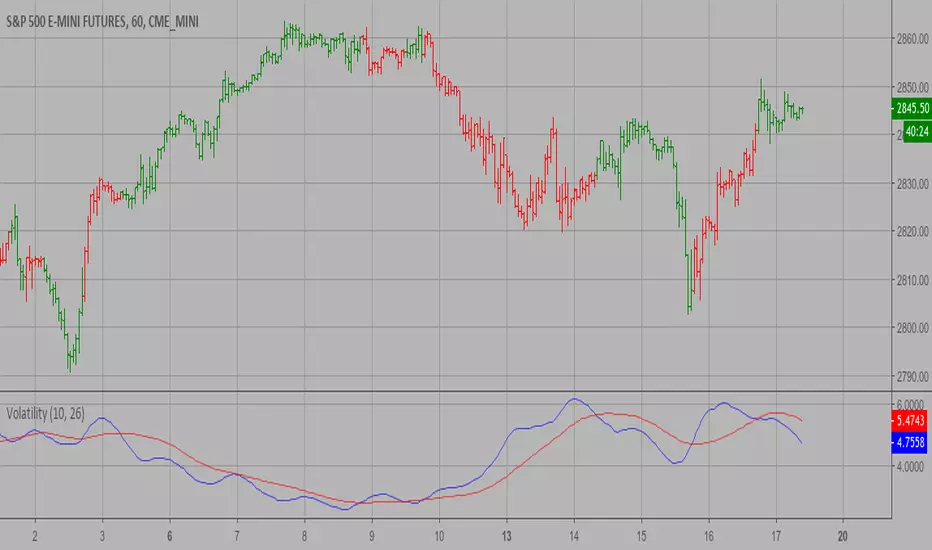
Volatility Strategy The Volatility function measures the market volatility by plotting a smoothed average of the True Range. It returns an average of the TrueRange over a specific number of bars, giving higher weight to the TrueRange of the most recent bar. WARNING: - This script to change bars colors.Pine Script® göstergesiHPotter tarafından83
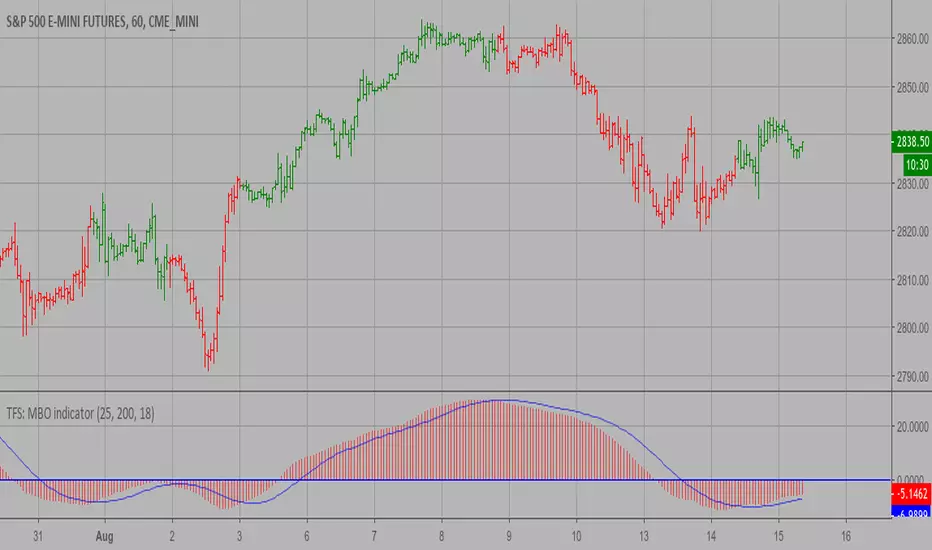
TFS: MBO Strategy MBO indicator is the third component of TFS trading system. This indicator was developed by Bryan Strain and Mark Whitley. The idea of MBO is similar to moving average convergence/divergence (MACD) indicator. It is calculated by subtracting the 200-day moving average from the 25-day moving average. WARNING: - This script to change bars colors.Pine Script® göstergesiHPotter tarafından104
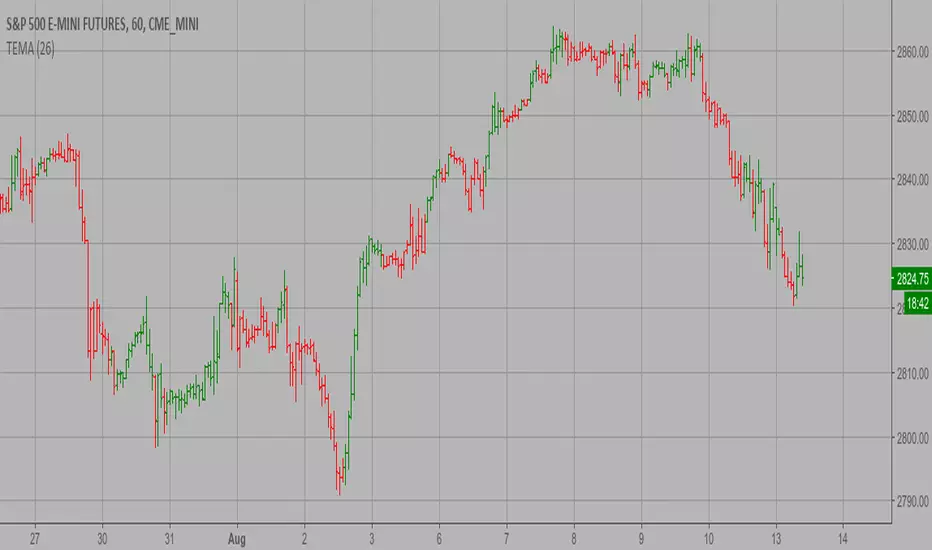
TEMA1 Strategy This study plots the TEMA1 indicator. TEMA1 ia s triple MA (Moving Average), and is calculated as 3*MA - (3*MA(MA)) + (MA(MA(MA))) WARNING: - This script to change bars colors.Pine Script® göstergesiHPotter tarafından1149
Ehlers-Smoothed Stochastic RSI StrategyI have been asked by several people for a Strategy based on the ES Stoch RSI Alert so here it is. The strategy has an adjustable backtest date range so that you can adjust the test time period to whatever you like. This strategy is based on a script by fskrypt.Pine Script® stratejisibetabeaver tarafından44197
Moving average cloud strategyHi folks! Here a script uses the moving average cloud. A sma (50, aqua) and a sma (200, olive) are plotted on the cart. When both sma go up the cloud is green. When both sma go down the cloud is red. When sma (200, olive) goes down and sma (50, aqua) goes up the cloud is orange. When sma (200, olive) goes up and sma (50, aqua) goes down the cloud is lime. There three entry points in this strategy. Long Aggressive: When the cloud turns orange and price closes above the sma (200). Neutral: When the both sma make the golden cross. Cautious: When the cloud is green and price closes sma (200) after searching for support. So not when there's a great distance between them. In case you missed the entry point you can jump in when price CLOSES above sma (50). So after it searched for support on that line. The cloud has to be green at that moment. Short Aggressive: When the cloud turns lime and price CLOSES below the sma (200). Neutral: When the both sma make the death cross. Cautious: When the cloud is green and price is above the sma (200). In case you missed the entry point you can jump in when price CLOSES above sma (50). So after it searched for support on that line. There are also two exit points in this strategy. Cautious: When price closes on the other side of the sma (50). Neutral: When the cloud changes color. Aggressive: When price closes on the other side of the sma (200). There's always the opportunity that the price searches for support at the sma (200) line and goes from that moment in the direction you want. Don't wait for the cross of the both sma. Very usually you give a huge part of your profit away at that point. Remember: Above the cloud is bullish area, never go short there. Below the cloud is bearish area, never go long there. Remember 2: When the clouds changes rapidly from color we're not in a trend. The sma (200) will be almost flat at those situations. It's a sign not to go into a trade since the market doesn't know in which direction it will go.Pine Script® göstergesitradermikey tarafından1178
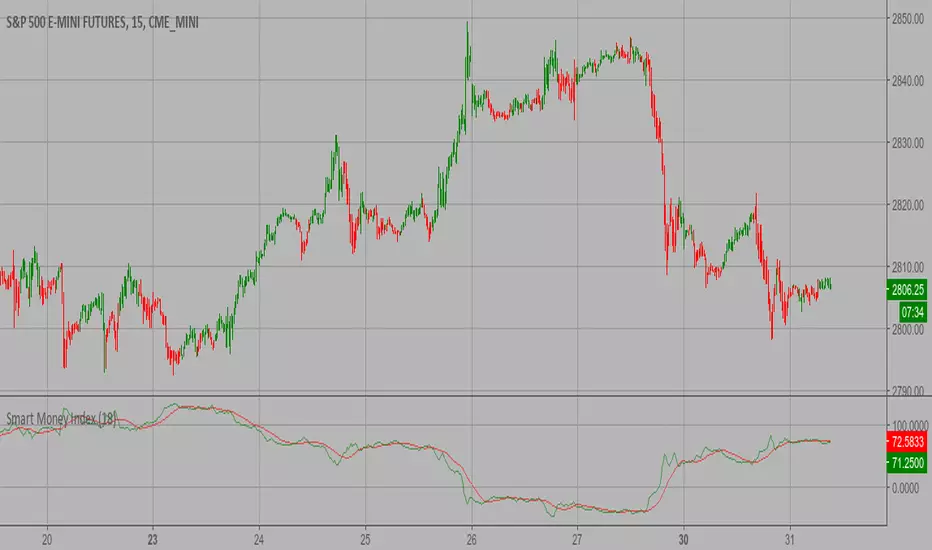
Smart Money Index (SMI) Strategy Attention: If you would to use this indicator on the ES, you should have intraday data 60min in your account. Smart money index (SMI) or smart money flow index is a technical analysis indicator demonstrating investors sentiment. The index was invented and popularized by money manager Don Hays. The indicator is based on intra-day price patterns. The main idea is that the majority of traders (emotional, news-driven) overreact at the beginning of the trading day because of the overnight news and economic data. There is also a lot of buying on market orders and short covering at the opening. Smart, experienced investors start trading closer to the end of the day having the opportunity to evaluate market performance. Therefore, the basic strategy is to bet against the morning price trend and bet with the evening price trend. The SMI may be calculated for many markets and market indices (S&P 500, DJIA, etc.) The SMI sends no clear signal whether the market is bullish or bearish. There are also no fixed absolute or relative readings signaling about the trend. Traders need to look at the SMI dynamics relative to that of the market. If, for example, SMI rises sharply when the market falls, this fact would mean that smart money is buying, and the market is to revert to an uptrend soon. The opposite situation is also true. A rapidly falling SMI during a bullish market means that smart money is selling and that market is to revert to a downtrend soon. The SMI is, therefore, a trend-based indicator. Some analysts use the smart money index to claim that precious metals such as gold will continually maintain value in the future. WARNING: - This script to change bars colors.Pine Script® göstergesiHPotter tarafından44408