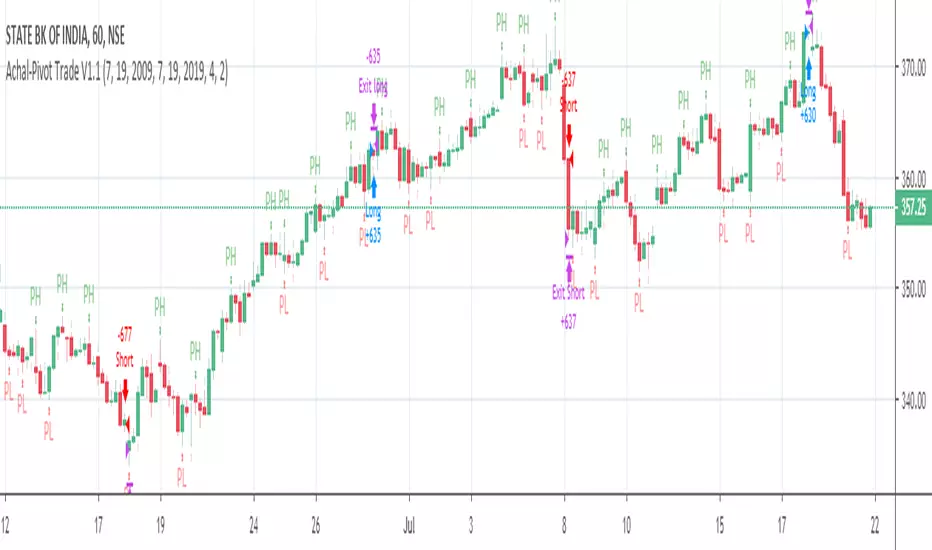
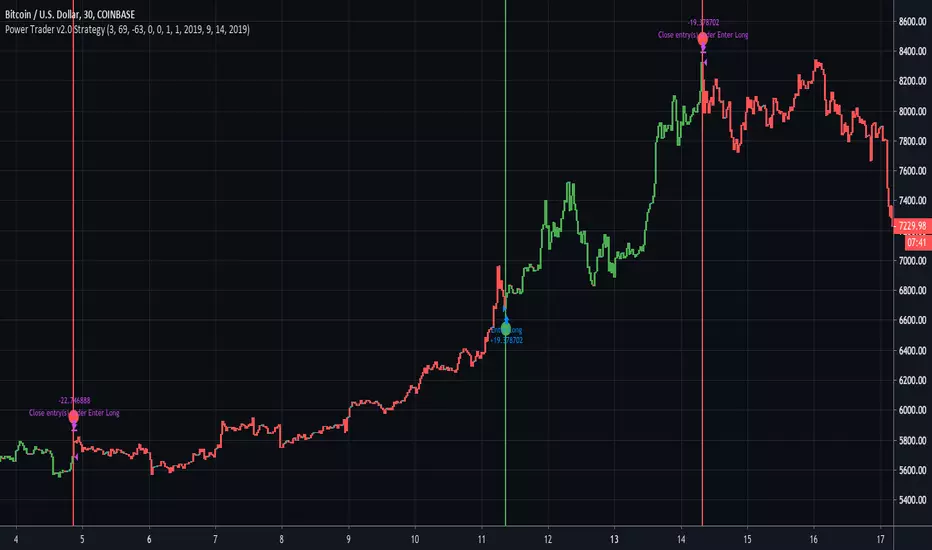
Bill Williams Awesome strategy(lirshah)The Awesome Oscillator is an indicator used to measure market momentum. AO calculates the difference of a slow period and a fast period Simple Moving Averages. The Simple Moving Averages that are used are not calculated using closing price but rather each bar's midpoints.
AO is generally used to affirm trends or to anticipate possible reversals.
this strategy has been written according to BWA and has the best results on M15 chart.
the strategy is compatible with Most markets such as Forex, crypto, CFD and indexes
Strategy!
TH_Delta Strategy (Multi-Options TH Strategy Tester)
Strategy Tester is based on TH_RSI Delta, TH_RSIMACD, and a combo of Hull Moving Averages. You will also able to activate include Ichimoku Cloud or a Simple Moving Average.
It also applies colored bars and signals based on overbought/oversold states and RSI crossings.
The tester/signals is disabled by default. You need to activate it in options and then tune the initial capital, % equity options and fees for testing different approaches.
To switch between different tests you just change the number of strategy type and results on screen will be updated accordingly.
You can also define the period of time you need the test to perform on. Default start is Jan 2017 to Jan 2021. Change this as fit.
Remember that the market change pace and volatility. Some timeframes will show you better results with different strat approaches. The same for different kinds of markets/securities.
pivot point strategy(lirshah)The pivot point levels are composed of a pivot point, two higher resistance levels known as R1 and R2, and two lower pivot point supports known as S1 and S2.
Each resistance level is considered a pivot point.
this strategy gives signals based on valid pivot points( reactionary price level) and it has a good results on the variety of pairs in different markets.
Chaikin Money Flow(CMF) strategy (lirshah)Chaikin Money Flow (CMF) is a technical analysis indicator used to measure Money Flow Volume over a set period of time. Money Flow Volume (a concept also created by Marc Chaikin) is a metric used to measure the buying and selling pressure of a security for single period.
This strategy gives signals based on movement of CMF chart and has a good results on Xbtusd and Btcusd 30 minutes chart.
Ema stretegy(lirshah)due to crossing special emas it triggers buying or selling signals.
good results in H1 charts.
TRIX strategy (lirshah)TRIX is an indicator that combines trend with momentum. The triple smoothed moving average covers the trend, while the 1-period percentage change measures momentum. In this regard, TRIX is similar to MACD and PPO. The standard setting for TRIX is 15 for the triple smoothed EMA and 9 for the signal line.
this strategy gives signals according to TRIX plot movement and has good resaults on xbtusd,btcusd, ethusd ,and ...
Ichimoku Strategy(lirshah)The Ichimoku Cloud, also known as Ichimoku Kinko Hyo, is a versatile indicator that defines support and resistance, identifies trend direction, gauges momentum and provides trading signals.
this strategy has been written according to cloud and has good results on crypto currencies pairs and some other Forex pairs.
Binary RSI strategy(lirshah)Binary Rsi is one of the greatest strategies published by lirshah programming team.
it has a good operation on H2 ,H1, and M15 charts.
its better to say that this strategy can act such a money machine and
has a good result on almost all crypto currency pair:
LTCUSD – ETHUSD –BTCUSD- XBTUSD - ZECUSD –ETHBTC and …
Bill Williams Alligator strategy (lirshah)This strategy has been written according to bill William alligator indicators.
has a good results on Ethusd , Btcusd, Xbtusd and Xrpusd H1 Timeframe.
15Min Channel Strategy(lirshah)15 Minutes channel strategy gives signals according to highest and lowest price of given period (default=120).
red line is lowest price index while blue line is high bars index.
Convergent lines indicate incoming strong trends while Diverging lines show end of a trend.
Best results is on XRPUSD and BCHUSD M15 chart.
ZenTrend Follower Signals (Backtest)Buy/Sell Entry signals based on the ZenTrend Follower indicator.
Entries are taken from the setup and trend breakout level, exits from the trailing stop loss.
Overextension and trend re-entry signals are ignored.
The indicator is linked below
If you enjoy these posts please like and subscribe so more people can join you :)
If you want to tryout the indicator and strategy, follow me and drop a comment or pm and I’ll get you set up.
Stay calm, and happy trading!
More information on the indicator can be found below:
CS Basic Script - Customizable Crossing Moving AveragesThis Crossing MA Script features inputs for:
- Custom Date Range for Backtesting
- Optional Trailing Stop Loss
- Buy/Sell and Long/Short Selections
- Customizable MA Types and Ranges
- Includes EMA, SMA, WMA, ALMA, VMA, HMA, and LSMA Moving Average Types
- Ability to Enable Automated Trading with the Autoview Trading Bot Chrome Extension
For access to the Strategy Script for backtesting, simply favorite the script and add it to any TradingView chart.
For access to the Study Script for Custom Alerts and the Ability to Automize Trades through Autoview, please visit our website at www.cryptoscores.org .
Keep It Simple, Stupid!This is a strategy that utilizes crossovers as entries and exits. You have quite a bit of freedom to choose the type of MA used, along with the source and length. You are also able adjust the backtest range. I will update with changes if any are needed, as well as a description of the update.
TradingLive24 System LTCUSDThis is a script for LTCUSD in 5 minutes resolution.
It will show you when you must to Buy, Sell or Exit from the Crypto.
The strategy has 80% of success. You can modify and adapt it to your requirements.
If you want to have more entries, you only need to modify the parameters 3 and 4, preferably with values less than 20.
Usually, the parameter 4 need to be grater than parameter 3.
The parameters 1 and 2 don't need to be modified, but you can touch them too.
Also, the TakeProfit1 and StopLoss1, usually are greater than TakeProfit2 and StopLoss2.
If you want more success percent, you can modify the TakeProfit with a smaller number.
Get 10-day Free Trial, just send us your TradingView Username here www.tradinglive24.com
TradingLive24 System ETHUSD This is a script for the ETHUSD in 5 minutes resolution.
It will show you when you must to Buy, Sell or Exit from the Crypto.
The strategy has 80% of success. You can modify and adapt it to your requirements.
If you want to have more entries, you only need to modify the parameters 3 and 4, preferably with values less than 20.
Usually, the parameter 4 need to be grater than parameter 3.
The parameters 1 and 2 don't need to be modified, but you can touch them too.
Also, the TakeProfit1 and StoppLoss1, usually are greater than TakeProfit2 and StoppLoss2.
If you want more success percent, you can modify the TakeProfit with a smaller number.
Get 10-day Free Trial, just send us your TradingView Username here www.tradinglive24.com
PGT: Pretty Good TraderLittle bit of background :
I am a broke college student on the East coast, and I have developed a hobby for creating trading algorithms. This is one of the better scripts that I have written. Unfortunately, as a broke college student, I don't have the disposable income to actually trade using real money. If you are interested in donating to my broke college student fund, please message me!
On to the script :
This script was written in pine version 3 and does not calculate_on_tick . This means that it does not repaint . The numbers you see are, to the best of my knowledge, accurate.
Because most scripts tend to overfit data to generate the "best looking data", I decided to create an algorithm that would be generalizable as possible to a diverse number of trading pairs. This script works on both crytpo markets(works best on smaller time frame) and stock markets(works best on larger time frames).
I am publishing this script to both gauge and generate interest in a Python trading bot which I have written which automatically buys and sells on different exchanges by using the predictive signals of this indicator.
Simple MACD and EMA StrategyThis is a basic Simple MACD and EMA trend following strategy. I will add shorts to the strategy very soon. Best results seem to be on the 4HR charts.
UVTrader StratejiIf you see "AL" you can buy, If you see "SAT" you can sell. You can use all charts, but 4 H and 1 D charts are very well..
HMA 55/80 Crossover Strategy - Multiple Crossing OptionsThis strategy concept is from ismail_tarim on TradingView, and on Twitter as @ismailtarim977. It is intended to be implemented on the daily chart . The original strategy is reflected, to the best of my ability and understanding, in the default settings.
There is an option to toggle plots being displayed. The plots accurately indicate when the events take place, rather than the delay from the strategy display.
// SYMBOL LEGEND //
Green 'X' indicates when price crosses up the desired HMA .
Green 'Up Arrow' shows the pullback entry on the crossed HMA .
Red "Down Arrow" shows the exit when prices closes below the HMA 55, or "Fast HMA".
If you notice something that needs to be changed or that could be added, please share it in the comments below. Thanks!