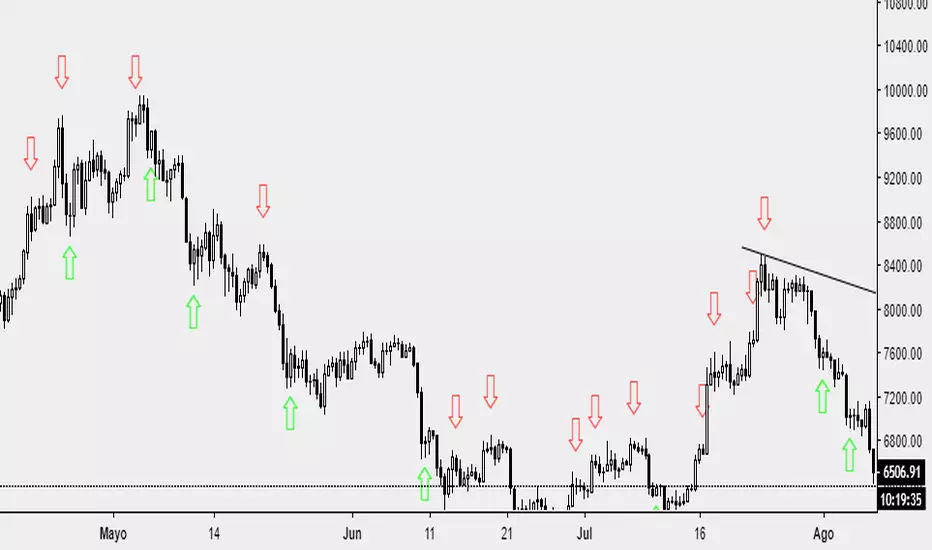
BB RSI (Bollinger Bands + RSI strategy) by BAHbOBollinger bands are used mostly for selling (shorting), when the price is above the upper band.
Sometimes it can be used for buying (longing), when the price is below the bottom band - but it can be tricky, because it can go even more lower.
This combined with Oversold/Overbought RSI will give you price entries/exits (arrows).
Strategy!

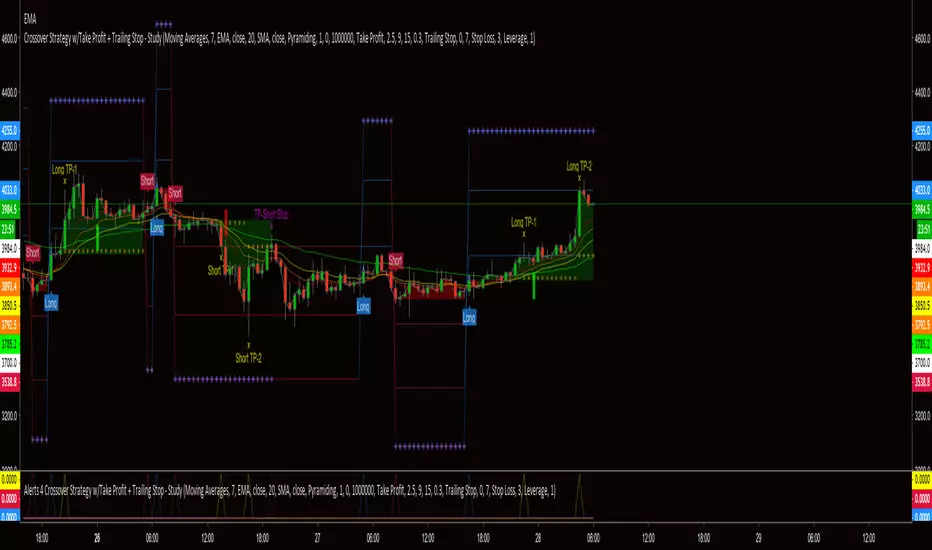
Crossover Strategy w/Take Profit + Trailing Stop - StudyThis script is a result of hours of trail, error and research. If something is not functioning as anticipated, please notify me with a description and possible screen shot of the issue.
The strategy is a basic crossover strategy. When MA1 crosses above MA2, it will trigger a long entry. When MA1 crosses below MA2, it will trigger a short entry.
When using the Take Profit function, the trailing stop will automatically activate at the defined TP3 level.
Also, when TP1 is hit a stop loss is set at 0.3% (this can be adjusted in settings) above/below the current entry. When TP2 is achieved, the stop will move up to the TP1 level.
If the trailing stop locks in LESS profit than the TP2 level, the stop will trigger at the TP2 level. This will continue until the trailing stop has moved to a level more advantageous than TP2.
There is a companion Alerts script for use with AutoView.
***AutoView syntax IS NOT provided***
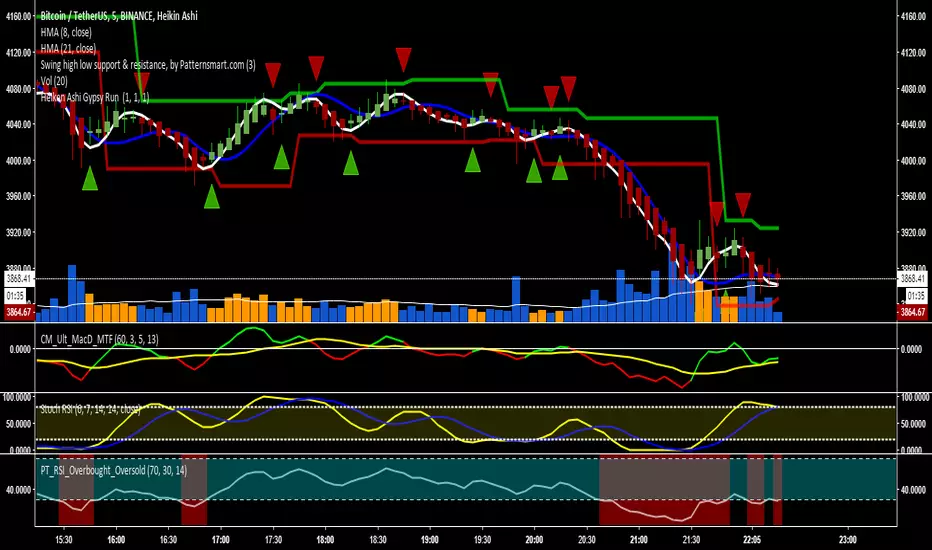
Heiken Ashi Gypsy Run Alerts & triggers based on heiken ashi changes in the colour of the candle, default settings are at 1, 1, 1 meaning it will trigger every time there is a change in the colour of the candle. You can change so it isn't as sensitive. It also has alert settings.

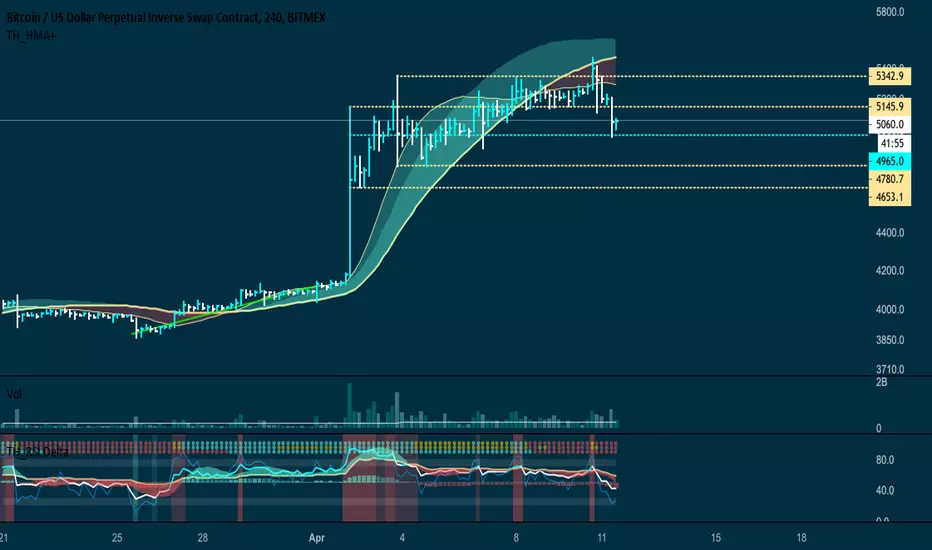
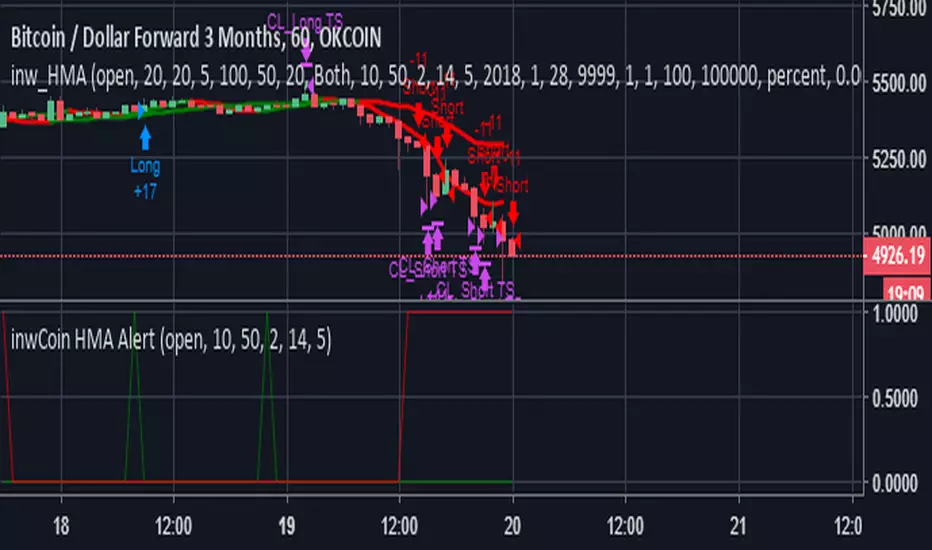
inwCoin HMA AlertinwCoin HMA alert for inwCoin HMA Strategy.
If you want to use this alert signal, please donate me 0.005 BTC for my electric bill/coffee/food to this address ( the man got to eat )
BTC : 3BRLGDEtNYpSPVD7YtKNZzVREsi1smcvvi
And send inform me about your donation, and I'll add you to access my alert script :)
If you need me to customize the script/alert/strategy to match your exchange, please let me know, and I'll do it for 0.01 BTC :)
MTF Deviation - Mtrl_ScientistHi everyone,
There are a lot of possible ways to look at markets and find valid patterns.
This time, I've looked at how shorter time frames deviate from the overall price consensus.
What you're seeing here is a range-bound difference of the lowest time frame from the overall price consensus (baseline), represented as blue line.
When lower time frames agree with the baseline, the difference becomes 0.
Logically, this difference cannot deviate too much from the baseline, and to quantify that, I've added fib-levels based on a deviation percentage that depends on price volatility and can be adjusted in the settings.
How it works:
First of all, you need to switch to the 1min time frame to get access to the lowest time frame data.
Look at how the blue line follows the support/resistance fib levels.
Oversold conditions are usually given by entering the lowest red band, whereas overbought conditions are given by entering the upper red band.
However, there are also extreme cases, where the blue line exceeds the set fib levels. In that case, price will reverse with very high likelihood.
Alternatively you can also ping-pong between two fib levels for frequent small trades.
Note that this indicator doesn't use any security functions to access time frame data. Instead, I found a different way to avoid repainting.
At the moment I'm just playing around with this to see how I can improve it. Feedback is very welcome!

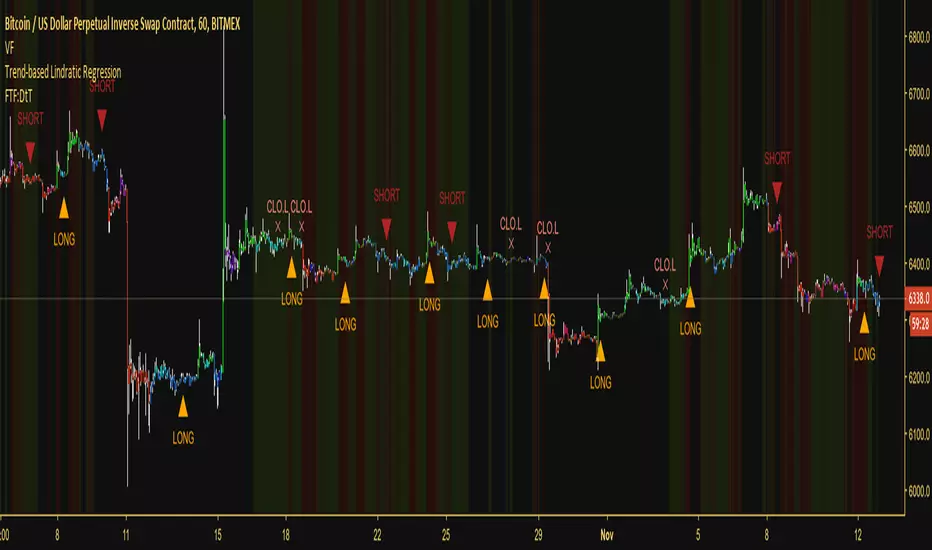
Trend-based Lindratic RegressionThis is an effective trend-following script that uses a finite volume element, linear regression, quadratic regression and multiple EMAs to define appropriate times to enter and exit the market. It can be applied to any asset that has volume data available for it.
As it follows the trend it's a very low-risk strategy, but it's not made to catch and ride reversals. It would rather close a long at the top and close a short at the bottom, although this means you can expect not to be stopped out on any trade you take.
Works on any timeframe, although I did create this with the intention of scalping, so shorter timeframes are recommended.
Combined with a volatility filter, this would be a very effective script, allowing you to stand away from the market during flat periods and trading with the trend during exciting periods.
Access to the script will be grated for 10$ of most low-fee cryptocurrencies, as well as BTC. If you're interested reach out to me through TradingView or, alternatively, contact @overttheraibow through Telegram.
If there's enough demand for it, I will also create a strategy version of this study which will be given for free to those who purchased the script. As always, maximum 250 places available.
Good luck!
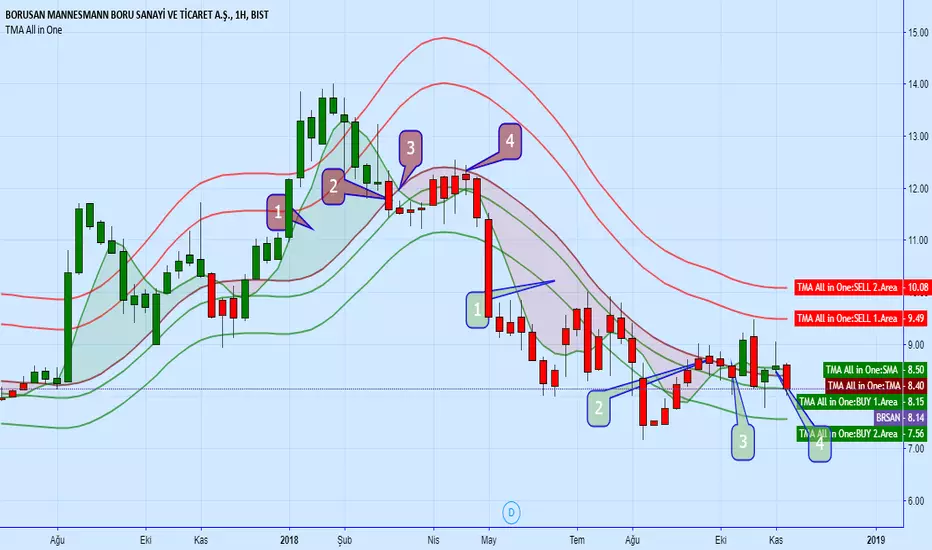
TMA All in OneTriangular Moving Averages
TMA formula is prepared on the Tradingview so that everyone can easly access.
First, calculate the simple moving average ( SMA ):
SMA = (P1 + P2 + P3 + P4 + ... + PN ) / N
Then, take the average of all the SMA values to get TMA values.
TMA = (SMA1 + SMA2 + SMA3 + SMA4 + ... SMAN) / N
The TMA can also be expressed
Source : Close
if the prices are upper than moving averages price bar color will be green, if lower than moving average it will be red color.
İf the trend is bullish , TMA will work as support
İf the trend is bear, TMA will work as resistance..
We used SMA5 ( Simple Moving Average5)
İf short period average(Green), cross up Longterm average (brown) that means BUY ( Green area)
İf opposite SELL ( Red area)
My idea, weekly period gives very good results to middleterm and long term invesment..That can help us from which prices we can buy the stock which we think that financial results are positive..
The other topic;
At the end, everytime prices return back to average values, and prices can move away until some distance. We can buy or sell with mixed prices, that can provide us better buy or sell average cost.
in Default Settings;
SELL 2.Area = 20% over than Longterm average, if the prices go upper that means prices are increased so much
SELL 1.Area = 13% over than Longterm average, if the prices go upper that means prices are incresed a bit.
BUY 1.Area = 3% lower than Longterm average, if the prices go upper that means prices are decreased a bit.
BUY 2.Area = 10% lower than Longterm average, f the prices go upper that means prices are decreased so much
You can use this indicator in your interested stock market.. With checking historical behaviour of the related stock market, you can make balance on the indicator setting.
According to averages, below BUY-SELL strategy is important,
Powerful SELL
1- Previosly İncrease
2- Price cross down the long average line
3- Short average,crossdown the long average
4- Price approach to long average, but close the bar under this average
Powerful BUY
1. Previosly Decrease
2. Price cross up the long average line
3. Short average crossup the long average line
4. Price approach to long average, but close the bar over this average
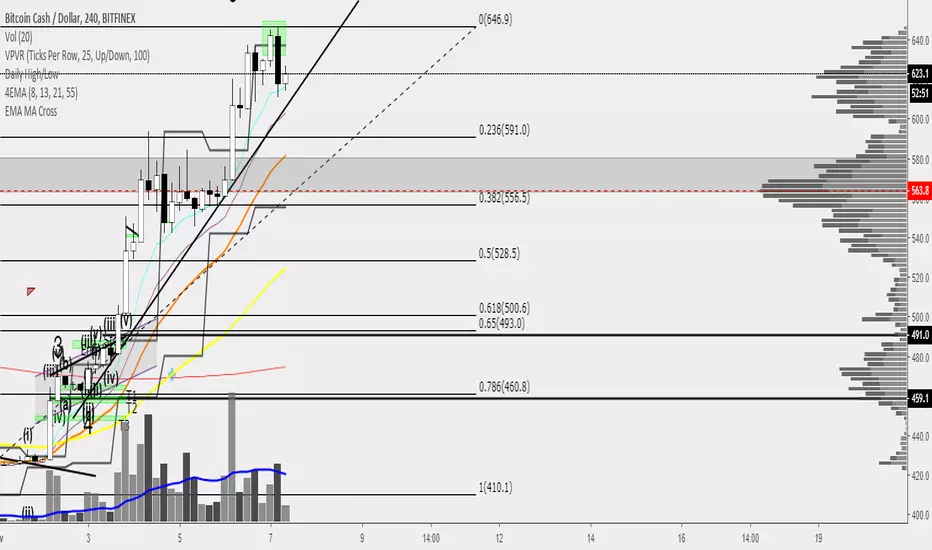
55EMA 200MA Cross Philakone Swing StrategyBased on the lessons of Philakone when we see the golden cross its a buy signal when we see the second cross this means death cross sell signal.
Bullish Engulfing Strategy This is a bullish reversal pattern formed by two candlesticks. Following a downtrend,
the first candlestick is a down candlestick which is followed by an up candlestick
which has a long real body that engulfs or contains the real body of the prior bar.
The Engulfing pattern is the reverse of the Harami pattern.
WARNING:
- This script to change bars colors.

Bones1390's GANN Strategy AlertsThese are the alerts to go along with my GANN Strategy. You can find the strategy here:
If you like my stuff, leave me a comment below.
If you're feeling kind or want to show some appreciation, you can donate Bitcoin to this Address here:
3Jp9Kow1VxvzAiLLwCdeeQ2g11wKyaT4rC
Also if there's anything you want to talk about PM me! I'm free to speak about anything. Want a custom indicator? I can do my best to code it for you!
Thanks!
Bones

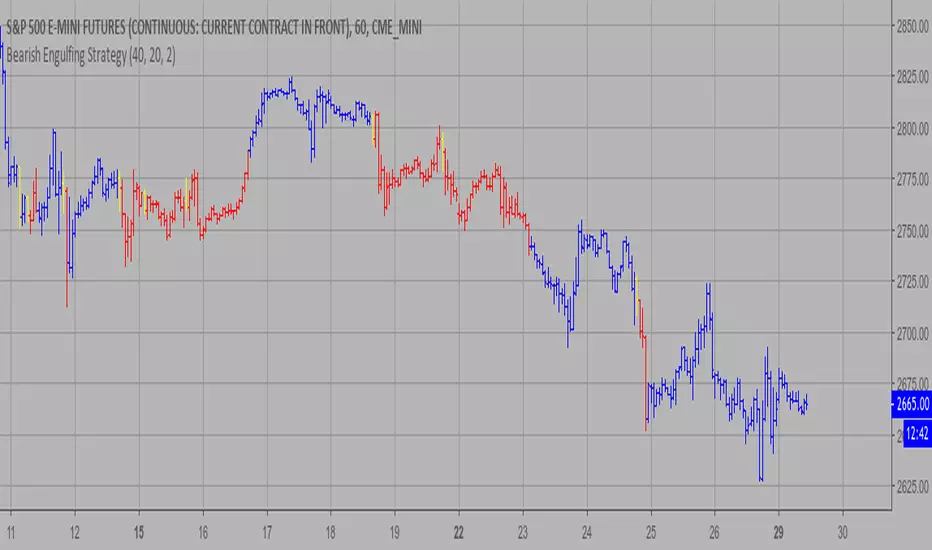
Bearish Engulfing Strategy This is a bearish candlestick reversal pattern formed by two candlesticks.
Following an uptrend, the first candlestick is a up candlestick which is
followed by a down candlestick which has a long real body that engulfs or
contains the real body of the prior bar. The Engulfing pattern is the reverse
of the Harami pattern.
WARNING:
- This script to change bars colors.
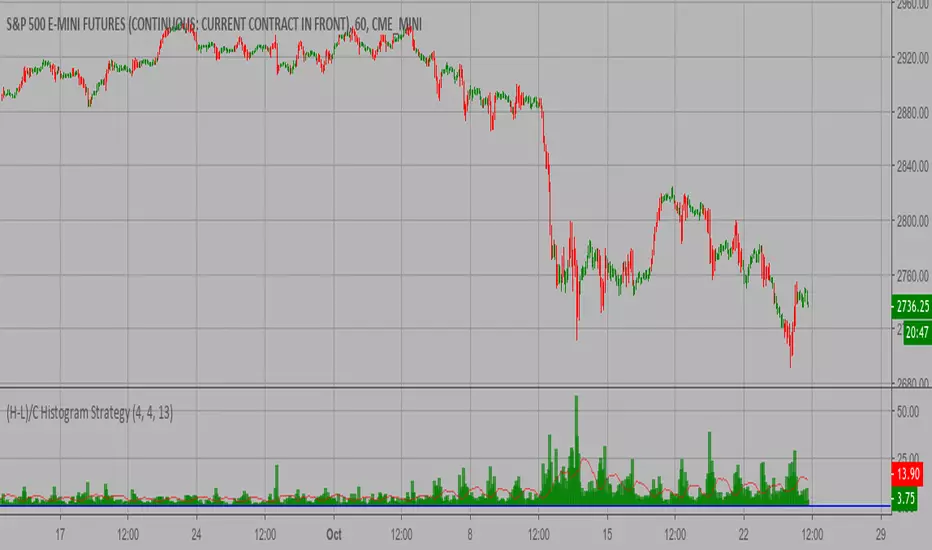
(H-L)/C Histogram Strategy This histogram displays (high-low)/close
Can be applied to any time frame.
WARNING:
- This script to change bars colors.
CCI Highlighted [ankit4349]>> This script is purely based on Commodity Channel Index (CCI) with multiple CCI instances being used within one oscillator.
>> User can use as much as 5 CCI instances/plot within one oscillator.
> How to use :
1. When Bullish :
Whenever CCI length 14 crosses above -100(negative 100) that means bullish momentum is supported.
Best bullish/long entry would be when CCI length 14 crosses above -100(negative 100) as mentioned above and at the same time CCI length
200 is bouncing on top of +100(positive 100).
2. When Bearish :
Whenever CCI length 14 crosses below +100(positive 100) that means bearish momentum is supported .
Best bearish/short entry would be when CCI length 14 crosses below +100(positive 100) as mentioned above and at the same time CCI length
200 is bouncing at bottom of -100(negative 100) .
> Color Clarity :
a. Bullish support is highlighted GREEN and bearish support is highlighted RED within the oscillator background with respect to
Length 1 (i.e 14 by default) .
b. PURPLE is highhighted when Length 5(i.e 200 by default) is bouncing either on top of +100(for bullish) or at bottom of -100(for bearish).
c. AQUA is highlighted when Length 3(i.e 50 by default) is bouncing on top or at bottom of 0 from either side respectively.
d. Best entry in both cases i.e bullish or bearish as mentioned above('How to use') is highlighted WHITE by default.
> Tip:
Just observe the color outputs on any timeframe in a chart as it works fractally on every timeframe , it will help you understand better with
clarity.
> You are always free to experiment with the CCI lengths, change highlighted color and hide/unhide the Lengths as per your requirements in
setting/format .

MACD-AO MACD-AO is programmed by Ruben Jaramillo
MACD-AO , short for moving average convergence/divergence, is a trading indicator used in technical analysis of stock prices, created by Gerald Appel in the late 1970s. It is supposed to reveal changes in the strength, direction, momentum, and duration of a trend in a stock's price.
The MACD-AO indicator (oscillator) is a collection of three time series calculated from historical price data, most often the closing price. These three series are: the MACD-AO series proper, the "signal" or "average" series, and the "divergence" series which is the difference between the two. The MACD-AO series is the difference between a "fast" (short period) exponential moving average (EMA), and a "slow" (longer period) EMA of the price series. The average series is an EMA of the MACD-AO series itself.
The MACD-AO indicator thus depends on three time parameters, namely the time constants of the three EMAs. The notation " MACD-AO (a,b,c)" usually denotes the indicator where the MACD-AO series is the difference of EMAs with characteristic times a and b, and the average series is an EMA of the MACD-AO series with characteristic time c. These parameters are usually measured in days. The most commonly used values are 12, 26, and 9 days, that is, MACD-AO (12,26,9). As true with most of the technical indicators, MACD-AO also finds its period settings from the old days when technical analysis used to be mainly based on the daily charts. The reason was the lack of the modern trading platforms which show the changing prices every moment. As the working week used to be 6-days, the period settings of (12, 26, 9) represent 2 weeks, 1 month and one and a half week. Now when the trading weeks have only 5 days, possibilities of changing the period settings cannot be overruled. However, it is always better to stick to the period settings which are used by the majority of traders as the buying and selling decisions based on the standard settings further push the prices in that direction.
The MACD-AO and average series are customarily displayed as continuous lines in a plot whose horizontal axis is time, whereas the divergence is shown as a bar graph (often called a histogram).
A fast EMA responds more quickly than a slow EMA to recent changes in a stock's price. By comparing EMAs of different periods, the MACD-AO series can indicate changes in the trend of a stock. It is claimed that the divergence series can reveal subtle shifts in the stock's trend.
Since the MACD-AO is based on moving averages, it is inherently a lagging indicator. As a metric of price trends, the MACD-AO is less useful for stocks that are not trending (trading in a range) or are trading with erratic price action.

Bottoms Buy/Sell SignalBuying and selling strategy, in areas of possible price reversal, is more effective in 4h, 12h and 1d time frames, works with any market.
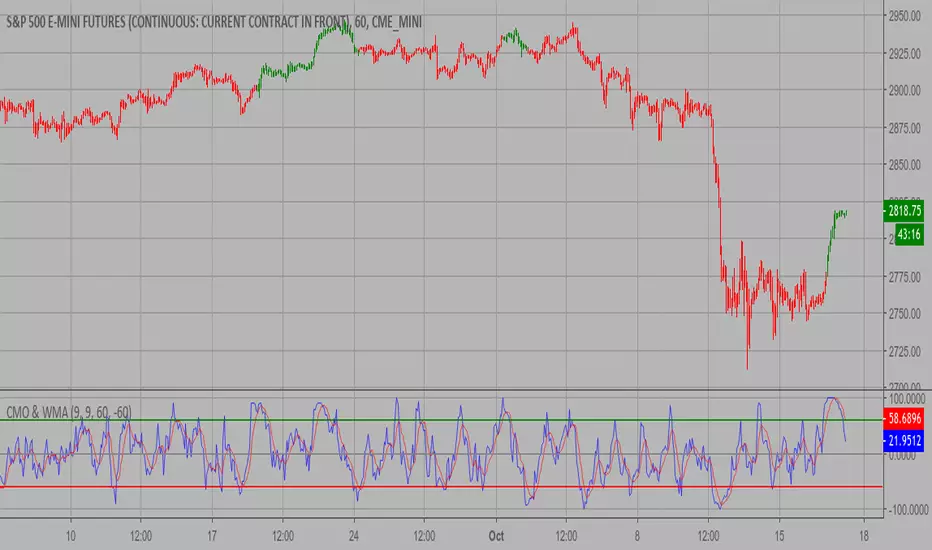
CMO & WMA Strategy ver 2.0 This indicator plots Chandre Momentum Oscillator and its WMA on the
same chart. This indicator plots the absolute value of CMO.
The CMO is closely related to, yet unique from, other momentum oriented
indicators such as Relative Strength Index, Stochastic, Rate-of-Change,
etc. It is most closely related to Welles Wilder?s RSI, yet it differs
in several ways:
- It uses data for both up days and down days in the numerator, thereby
directly measuring momentum;
- The calculations are applied on unsmoothed data. Therefore, short-term
extreme movements in price are not hidden. Once calculated, smoothing
can be applied to the CMO, if desired;
- The scale is bounded between +100 and -100, thereby allowing you to clearly
see changes in net momentum using the 0 level. The bounded scale also allows
you to conveniently compare values across different securities.
Trend Trader Bands Strategy This is plots the indicator developed by Andrew Abraham
in the Trading the Trend article of TASC September 1998
It was modified, result values wass averages.
And draw two bands above and below TT line.

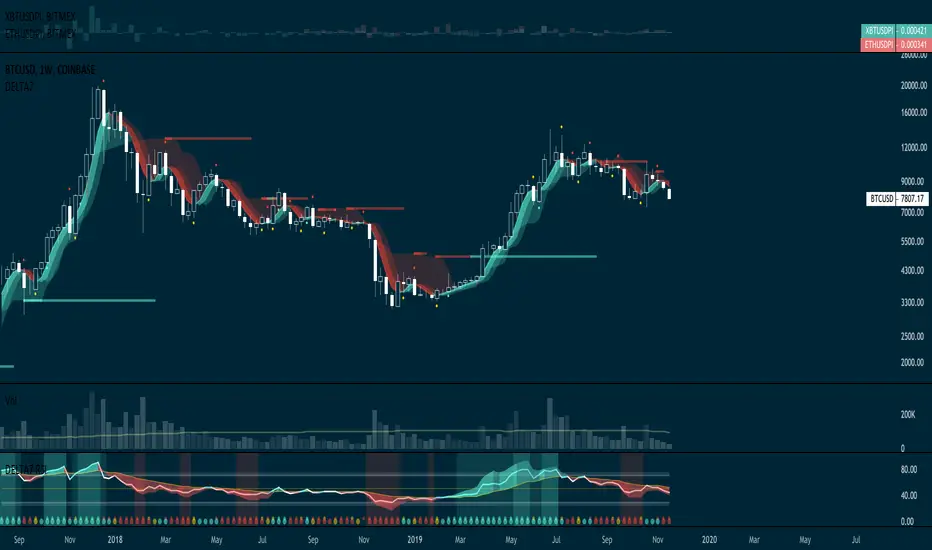
BTC Precognition - Mtrl_Scientist (study version)Hey everyone!
This is the study version of the improved 'BTC - Precognition' algorithm, meaning you'll only see the indicator and not have 'longs/shorts' painted on your chart.
- Works better with normal candles now, as internal calculations are forced to be done on Heikin Ashi, regardless of chosen candle format
- Turned into a study, rather than strategy, as not to interfere with strategies that are already in place
- Added Overbought/Oversold conditions (orange) with adjustable threshold, based on normalized price action helper indicator
Reminder: Only for use with BTCUSD, as it draws data from specific exchanges!
I will also add these changes to the strategy version.
Please let me know what you would like to see improved!

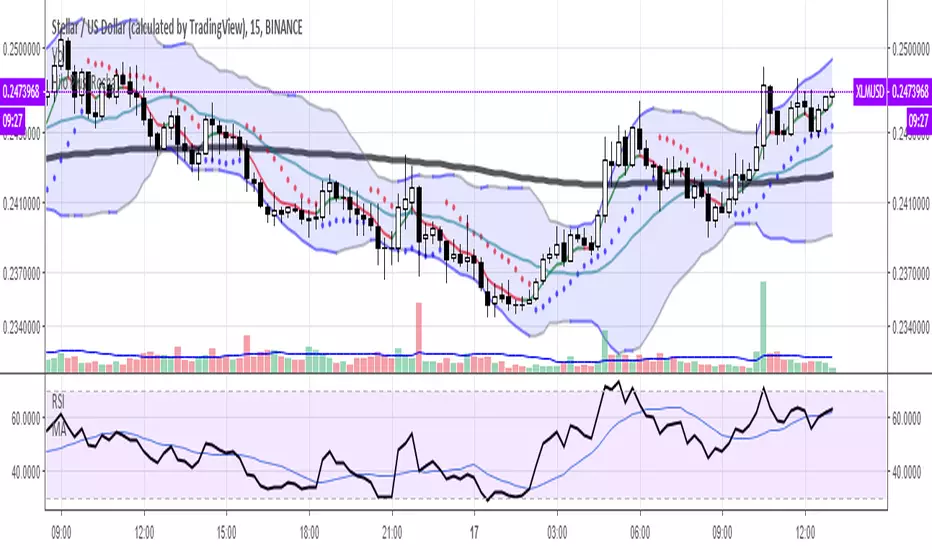
RSI 𝝙 MapRSI 𝝙 Map is a on-chart application of signals produced by the original RSI 𝝙 Indicator.
RSI 𝝙 is a full study system of several RSI analysis that can be used on different timeframes and adapt strategy to trending markets or trading ranges.
Default Settings:
RSI: 13
Linear Regression of RSI: 34
Signal RSI: 5
Long RSI: 55
RSI 𝝙 Histogram: Delta between RSI and Long RSI based on Signal RSI_Length.
Activate Vertical Bar Highlights and/or Signal Candle Flags for:
- RSI Oversold/Overbought. (Default: Highlight Bar)
- Signal RSI Oversold/Overbought. (Default: Highlight Bar)
- RSI crossing its Linear Regression . (Default: Signal Candle Flag)
- RSI crossing its Long RSI . (Default: Off)
- Signal RSI crossing its RSI . (Default: Off)
- Signal RSI crossing its Long RSI . (Default: Off)
- RSI 𝝙 Histogram crossing baseline. (Default: Off)
Users can also do extra tuning in Style Section of Format options.
The market behaves differently when the pacing changes, volatility changes and when it trends or when it ranges. Develop an understanding of it with the help of this study.
Avoid risking more than 1% per trade. Be responsible for always making a priority about protecting capital and risk management. Develop emotional control and use this RSI study to develop a more complete trading system without any need for extra indicators other than Price and Volume .
👆active signals:
RSI Overbought/Oversold
Signal RSI Overbought/Oversold
RSI crossing Linear Regression
👆active signals:
RSI Overbought/Oversold
Signal RSI Overbought/Oversold
Signal RSI crossing RSI
Signal RSI crossing Long RSI
👆active signals:
RSI Overbought/Oversold
Signal RSI Overbought/Oversold
RSI crossing Linear Regression
RSI crossing Long RSI
Signal RSI crossing RSI
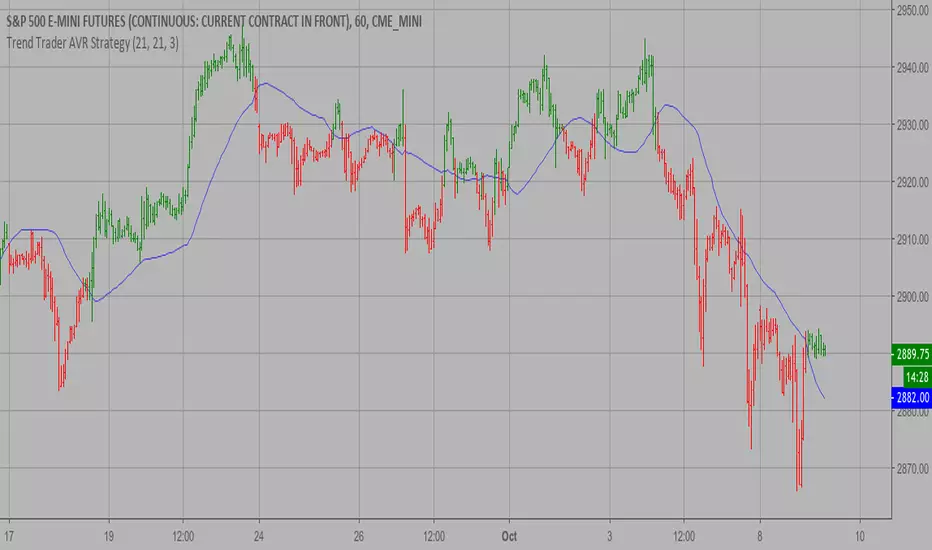
Trend Trader AVR Strategy This is plots the indicator developed by Andrew Abraham
in the Trading the Trend article of TASC September 1998
It was modified, result values wass averages.