Smart Risk - Three Institutional Models📘 Smart Risk – Three Institutional Entry Models
A precision-engineered institutional framework that blends liquidity, structure, and multi-time-frame confirmation.
🧠 Concept Overview
The Smart Risk indicator models how institutional traders and algorithms engineer entries around liquidity, imbalance, and structural shifts .
It unifies t hree distinct institutional entry models —each built around core Smart Money Concepts (SMC)—and enhances them with a Multi-Time-Frame Confluence (MTF) engine for directional alignment.
This tool doesn’t simply merge indicators.
It connects l iquidity sweeps, order-block reactions, breaker validation, and fair-value-gap mitigation into one cohesive trading logic—filtering every setup through trend, structure, and volume confirmation.
⚙️ How It Works
Setup #1 – Liquidity Sweep + Order Block Revisit + FVG Mitigation
Identifies engineered stop-hunts where price sweeps external liquidity and returns to a prior Order Block or Fair Value Gap (FVG).
Signals reversal-style entries with high probability of mean-reversion or mitigation.
Setup #2 – Supply/Demand + Mitigation / Breaker / FVG Continuation
Captures continuation trades inside trending structure.
When trend bias (via moving-average context) aligns with breaker or mitigation blocks, signals confirm institutional continuation sequences.
Setup #3 – Sweep + Classic FVG Reaction
Tracks clean displacement gaps following a liquidity sweep—ideal for scalpers and intraday reversals where imbalances act as magnets for price.
Each setup can be independently enabled or disabled from the panel.
A built-in signal-cooldown prevents repetitive triggers on the same leg.
🕒 Multi-Time-Frame Confluence
The new MTF module aligns lower-time-frame precision entries with higher-time-frame market structure.
When enabled, each setup only validates if the HTF trend confirms the same directional bias as the LTF pattern—e.g. a 5-minute bullish FVG signal requires a bullish 1-hour structure.
This ensures institutional logic respects global liquidity flow and avoids counter-trend traps.
MTF Controls:
• ✅ Enable MTF Confluence toggle
• ⏱️ Lower Time-Frame (LTF) selector (default 5 min)
• ⏱️ Higher Time-Frame (HTF) selector (default 1 hour)
• 🔄 Automatic SMA-based HTF trend detection
🎨 Visualization & Dashboard
• Order Block / Supply–Demand Zones — highlight institutional footprints
• Fair Value Gaps (FVGs) — reveal displacement inefficiencies
• Liquidity Sweeps (X / $) — mark engineered stops
• BOS & CHoCH — confirm structure continuation or reversal
• Compact Dashboard — live “Armed” state for each setup and MTF bias
Color-coded background cues emphasize active trade phases without clutter.
🧩 Core Algorithm Highlights
• Dynamic swing and pivot structure detection
• Breaker / Mitigation / Volume confirmation filters
• Fair-Value-Gap logic with directional alignment
• Cooldown control for signal throttling
• Multi-Time-Frame bias filter for contextual precision
⸻
📈 How to Use
1. Apply indicator to any asset or timeframe.
2. Select which institutional setups you want active.
3. Optionally enable MTF Confluence (5 min → 1 hr recommended).
4. Wait for BOS/CHoCH confirmation + zone alignment before entry.
5. Use OB and FVG zones for entry/exit planning with risk management.
⸻
💡 Originality Statement
This script introduces a multi-layered institutional logic engine that merges liquidity, mitigation, and imbalance behavior into a unified framework—augmented with time-frame synchronization and signal-cooldown management.
All logic, calculations, and visualization structure were built from scratch for this model.
It is not a mash-up of existing public indicators and offers measurable analytical value through MTF-aware trade validation.
⸻
⚠️ Disclaimer
This tool is intended for educational and analytical purposes only.
It does not provide financial advice or guaranteed trading outcomes.
Always back-test, validate setups, and apply proper risk management.
Strategy!

PCP Arbitrage Monitor (Math by Thomas)Live monitor for Put–Call Parity (C + PV(K) = P + S) showing drift, arbitrage direction, and opportunity strength.
The PCP Arbitrage Monitor helps traders visualize and quantify deviations from the Put–Call Parity (PCP) relationship:
𝐶+𝐾𝑒−𝑟𝑇 = 𝑃+𝑆
When this equation drifts, it indicates a potential arbitrage opportunity between call, put, and underlying (spot or future).
This indicator plots the left-hand side (LHS) and right-hand side (RHS) of the PCP equation on your chart, computes the drift, and automatically highlights and displays actionable trade combinations when the deviation exceeds a set threshold.
⚙️ How It Works
Inputs
Call & Put Symbols – Select matching call and put options (same strike & expiry).
Strike (K) – The strike price for those options.
Expiry (UTC) – Option expiry date/time (used to calculate 𝑇 and PV(K)).
Risk-free Rate (r) – Annualized rate used for discounting the strike.
Lot Size / Tick Value – Used to calculate profit in INR.
Arbitrage Threshold – Minimum drift (in points) to trigger signals (default 200).
Displayed Data
LHS = C + PV(K) (Call + discounted Strike)
RHS = P + S (Put + Spot/Future)
Drift = LHS – RHS
Bookable Profit (INR)
Action Suggestion (only when |drift| ≥ threshold)
Background Highlight
🟩 Green – Call side expensive → Sell Call + Buy Put + Buy Fut
🟥 Red – Call side cheap → Buy Call + Sell Put + Sell Fut
Table
Displays all key values live in the top-right corner:
Option prices
LHS, RHS
Drift (points)
Time to expiry
Lot size
Bookable profit (INR)
Trade action (only if |drift| ≥ threshold)
📈 How to Use
Open a NIFTY Spot or Futures chart (works on both).
Enter the exact option symbols (e.g., NSE:NIFTY24DEC21900CE and NSE:NIFTY24DEC21900PE).
Adjust Strike (K) and Expiry to match those options.
Observe:
The green/red background highlights large deviations (≥ threshold).
The Action cell displays the arbitrage combination and expected profit.
A drift beyond the threshold suggests a potential risk-free arbitrage if executed simultaneously across all legs.
Hold positions till expiry if margin allows; the profit is theoretically locked in.
💡 Tips
Works on both Spot and Futures charts — the script auto-uses the chart’s close as 𝑆
Set smoothing to 0 to see raw parity values.
Adjust threshold based on costs and margin — e.g., 150–200 points for NIFTY is practical.
Only valid when options are European (no early exercise risk).
Ensure both option symbols are liquid and from the same expiry.
⚠️ Disclaimer
This tool is for educational and analytical purposes.
Real arbitrage execution depends on liquidity, bid-ask spread, slippage, and margin requirements.
Always validate prices with your broker before trading.

Binary Options Fast Scalping [TradingFinder] M1 & M5 Signals🔵 Introduction
In the structure of financial markets, spiky moments and sudden price movements play a key role in Liquidity Grabs and Market Structure Resets. These movements usually occur after the accumulation of orders in Buy Side or Sell Side Liquidity zones and are accompanied by rapid breaks in the form of Break of Structure (BoS) or Change of Character (CHoCH).
At this stage, the market temporarily moves in the direction of liquidity to trigger counter orders and then enters a Retracement or Pullback phase, a point where professional traders using the Smart Money Concept (SMC) look for candle confirmation to enter with precision.
This strategy is built upon the same logic : an initial spiky move as a signal of institutional or liquidity driven algorithms, followed by a controlled pullback toward areas such as the Order Block, Fair Value Gap (FVG), or Imbalance Zone, and finally an entry based on a strong confirmation candle (Engulf, Rejection, Breaker) that defines the true direction of order flow.
This combination of price behavior, especially on lower timeframes such as M1 or M5, provides an ideal setup for fast Scalping, Micro Structure Trading, and even short term directional prediction in Binary Options Trading.
Since the main focus of this method is on identifying liquidity phases, structural confirmations, and momentum confirmation candles, the trader can design entries with high probability and logical stop loss placement using the concepts of Fractal Market Structure and Multi Timeframe Confirmation.
In the scalping version, the main objective is to capture the move toward the next liquidity pool or opposite demand and supply zone, while in the binary version, only the prediction of the next candle’s direction matters. This strategy inherently operates based on Smart Money Behavior, Liquidity Engineering, and Order Flow Dynamics, allowing the extraction of fast and profitable moves from the internal logic of market structure.
🔵 How to Use
The operational logic of this strategy is based on Liquidity Sweep, Pullback, and Confirmation Candle. The trader should first identify the initial Impulse Move, which is often accompanied by liquidity absorption around Buy Side or Sell Side Liquidity areas. After that, the market enters the Retracement phase and returns to structural zones such as the Order Block or the Fair Value Gap (FVG).
At this point, a position is taken only when a confirmation candle (Engulf, Breaker, or Rejection Candle) closes in the direction of continuation and aligns with the new structure (BOS or CHoCH). Applying this model on lower timeframes offers the highest precision for fast Scalping or for predicting the next candle’s direction in Binary Option trading.
🟣 Bullish Setup
In the bullish setup, the market first forms a spiky upward move with a sudden increase in momentum, indicating the activation of liquidity flow in the Buy Side Liquidity zone. This movement is usually accompanied by a Break of Structure (BOS) to the upside and marks the beginning of the Impulse Move phase. After this move, the price enters the Pullback phase and returns to structural areas such as the Bullish Order Block, Fair Value Gap (FVG), or Mitigation zone.
At this stage, the trader waits for a bullish confirmation candle (Bullish Engulf or Breaker Candle) to validate the end of the retracement. Entry is made at the close of the confirmation candle or on a minor pullback, with the stop loss placed below the Swing Low or below the pullback zone. The target is set at the next Buy Side Liquidity or Equal Highs. In the binary version, only the direction of the next candle matters and the entry takes place immediately after the confirmation candle.
🟣 Bearish Setup
In the bearish setup, the market first forms a spiky downward move, signaling increased selling pressure and liquidity absorption at the Sell Side Liquidity zone. This movement is accompanied by a Break of Structure (BOS) to the downside and represents the beginning of a bearish momentum phase. After the spike, the price enters the Retracement phase and returns to the Bearish Order Block or bearish Fair Value Gap zone. Within these areas, the formation of a bearish confirmation candle (Bearish Engulf, Breaker, or Rejection Candle) validates the continuation of the downtrend.
The entry is taken at the close of the confirmation candle, with the stop loss placed above the Swing High or above the pullback zone, and the target set toward the next Sell Side Liquidity or Equal Lows. In binary applications, only the direction of the next candle is considered and the confirmation candle serves as the entry trigger.
🔵 Conclusion
This strategy, by combining the principles of the Smart Money Concept, Liquidity Dynamics, and Candle Confirmation Logic, offers a precise and multi functional approach to market entry. Its core structure, identifying the initial spiky movement, waiting for a structural pullback, and entering based on a confirmation candle allows quick interpretation of institutional liquidity behavior and provides trading opportunities with high accuracy and controlled risk.
On lower timeframes, this logic becomes a powerful tool for Scalping and Micro Structure Trading, while in binary markets it delivers high success rates due to its focus on predicting the next candle’s direction. Built upon the foundations of Order Flow, Market Structure, and Fractal Liquidity Behavior, this strategy demonstrates that even in the fastest and noisiest market conditions, the order of Smart Money remains observable and exploitable.

AI Bot Regime Feed (v6) — stableThis indicator generates real-time, structured JSON alerts for external trading bots or automation systems.
It combines multiple technical layers to identify market regimes and high-probability buy/sell events, and sends them to any webhook endpoint (e.g., a FastAPI or Zapier listener).

Force of Strategy (FoS, Multi TF/TA, Backtest, Alerts)Introducing the FoS Trading System
A comprehensive and innovative solution designed for both novice and experienced traders to enhance their intraday trading.
The basic idea of creating this script is to stay profitable in any market
Key Features:
There are over 25 no-repaint strategies for generating buy and sell signals to choose from
10 symbols for simultaneous trading
Webhook alerts in TTA format (tradingview to anywhere) pre-configured to send messages for trading cross-margin futures on major Crypto Exchanges: Binance, Bitget, BingX, Bybit, GateIO and OKX
A unique automated "Strategy switcher" feature for backtesting and live trading—not just a specific strategy, but the logic behind choosing a trading one or another strategy based on backtesting data obtained in real time
Advanced risk management options and backtest result metrics
Higher Timeframe filters (Technical Rating, ADX, Volatility) and ability for check backtest results with 9 main higher timeframes
Buy and sell signals are generated using TradingView Technical Ratings, indicators with adaptive length algorithms and various classic indicators with standard settings to avoid overfitting
Next, I will describe in detail what this script does and what settings it operates with:
"All Strategies" off
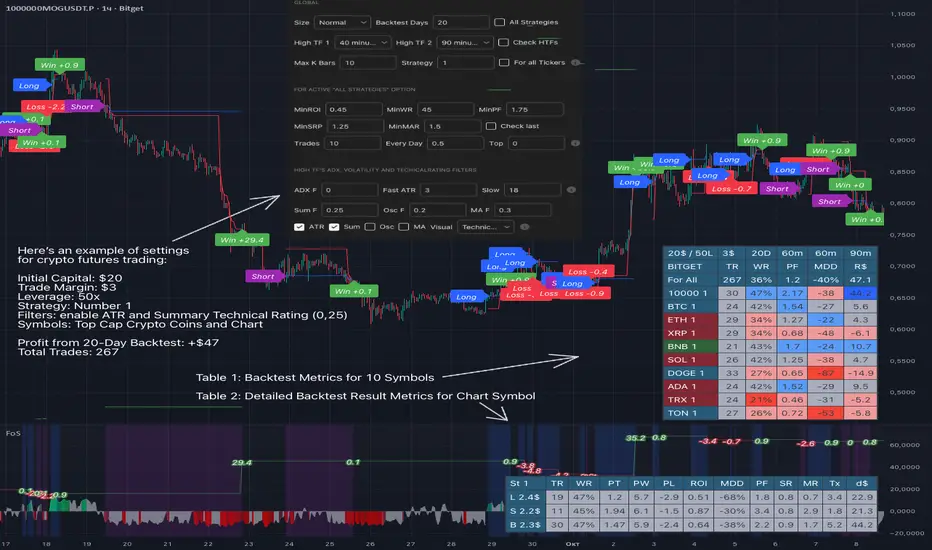
- In the global settings block, as shown in the main chart screenshot, you select how long the script will perform backtests in days, with a limitation on the number of bars for calculations. This limitation is necessary to maintain an acceptable calculation speed. You also choose which two higher timeframes we will use for signal and filters when confirming the opening of trades
- With "All Strategies" off - as in the example on the main chart screenshot, trading is carried out by strategy #1 on 10 selected tickers simultaneously. By default, I selected the 9 top-capitalized cryptocurrencies on the Bitget exchange and the chart symbol. You can change that choice of 9 non chart opened instruments and # strategy for each them
- The first row in the table 1 shows some of the main choosen script settings, in attached example: initial capital 20$, leverage 50L, 20 backtest days, 3$ is invest in one deal, 60m - is chart timeframe, next 60m is higher timeframe 1 and last 90m is higher timeframe 2. In first column you see shortened to 5 characters ticker names
- The exchange name in the second row determines the alert messages format
I've attached another example of trading with setting "All strategies" off in the image below. In this example, trading 10 standard symbols on an hourly timeframe, 2 coins from 10: 1000SATS and DOGE have generated a profit of over $65 over the past 20 days using strategy #4
Can you browse a wide range of trading instruments and select the 10 best strategies and settings for future trading? Of course, trading is what this script is do!
The parameters in the table 1 mean the following:
TR - count of closed trading deals
WR - Winning Rate, PF - Profit Factor
MDD - Max Draw Down for all calculated time from initial capital
R$ - trading profit result in usd
The parameters in the table 2 is just more metrics for chart symbol:
PT - result in usd Per one Trade
PW - result Per Win, PL - result Per Lose
ROI - Rate of Investments
SR - Sharpe Ratio, MR - CalMAR ration
Tx - Commision Fee in Usd
R$ - trading profit result in usd again
Table 2 separate trade results of backtesting for longs and shorts. In first column you see how many USD were invested in one trade, taking into account possible position splitting (will be discussed in more detail in the risk management section)
Settings:
"All Strategies" on, "Check Last" off
When "All Strategies" is active, trading changed from 10 symbols and one strategy to all strategies and one chart symbol. If option "Check Last" is inactive you will see backtest results for each of strategy in backtest setting days. This is useful, for example, if you want to see backtest results under different settings over a long period of time for calibrating risk management or entry rules
"All Strategies" on, "Check Last" on
- If "All Strategies" and "Check Last" is active trading will occur on the chart symbol only for those strategies that meet the criteria of the settings block for the enabled "All Strategies" option. For example your criteria is: for last 5 trades for all strategies, open next trade only on strategy which reached ROI 25% and WinRate 50%. When strategy with this setting criteria receive Buy or Sell Signal this trade will be opened, and when trade will be close "check last" will repeat. This feature i called "Strategy switcher"
-In Table 1 if strategy meet criteria you will see "Ok" label, if strategy meet criteria and have maximum from other reached ROI they labeled "Best". Chart strategy labeled "Chart", Chart and Ok labels in one time is "Chart+", "Chart" and "Best" is labeled "Best+"
- The color in the first column of table 1 indicates that the strategy is currently in an open position: green means an open long position, red means an open short position.
In picture bellow you will see good example for trading with check results for last 10 trades, and make desicion for trading when criteries 0.25 ROI and WinRate 50% reached for Top 2 by ROI strategies from all list of them. This example of trading logic in last 20 days (include periods when strategy don't arise 10 trades) give a profit $30+. At the bottom of the screen, you can see Labels with the numbers of the strategies that opened the trades. In this example, trades were primarily opened using strategy number 2, and the second most effective strategy after the 20-day backtest was strategy number 9
Who can promise you'll make a profit of $30 in the next 20 days with a drawdown of no more than $8 from the initial $20 with invest in one trade just 2.7$? No one. But this script guarantees that in the future it will repeat the same logic of switching trading strategies that brought profit over the last 20 days
Risk management options
- When a buy or sell trade is opened, you'll see three lines on the chart: a red stop-loss line (SL), a green take-profit line (TP), and a blue line representing the entry price. The trade will be closed if the high price or low price reaches the line TP or SL (no wait for bar close) and alert will be triggered once per bar when script recalculates
- Several options are available to control the behavior of SL/TP lines, such as stop-loss by percentage, ATR, or Highest High (HH) and Lowest Low (LL). Take Profit can be in percent, ATR or in Risk Reward ratio. There some Trailing Stop with start trail trigger options, like ATR, percent or HH / LL
- Additionally, in risk managment settings a function has been implemented for adding a position when the breakeven level expressed in the current ROI is reached for opened trade (splitting position). The position is added within the bar.
- Webhook alerts in TTA format with message contained next info : Buy / Sell or adding Quantity, Leverage, SL price, TP price and close trade
Keep in mind if the stop-loss changed when adding a position, the stop-loss will not be able to be higher than the current bar's low price, regardless of your settings, as backtest trades do not use intra-bar data, in this situation SL will be correct at next bar (but alert message don't be sended twice). And please note that this script does not have an option to simultaneously open trades in different directions. Only 1 trade can be opened for 1 trading instrument at a time
Backtest Engine
Backtest is a very important part of this script. Here describe how its calculate:
- Profit or Loss is USD: close trade price * open trade quantity - open trade price * open trade quantity - open trade quantity * (open trade price + close trade price)/2 * commision fee
Possible slippage or alert sending delay needed to be include in commission % which you will set in risk managment settings block, default settings is 0.15% (0,06% for open, 0,06% for close and 0,03% for possible slippage or additional fees)
- Maximum Draw Down: Drawdown = (peak - current equity) / peak * 100 ;
Drawdown > maxDrawdown ? maxDrawdown = Drawdown
- ROI: profit result in USD / sum of all positions margin
- CalMAR Ratio: ROI / (-MaxDrawDown)
- Sharpe Ratio: ROI / standard deviation for (Sum of all Profits and Loses) / (Sum of all Position Margins)
This description was added because in metrics i don't use parameters like "The risk-free rate of return". Keep in mind how exactly this script calculate profit and perfomance when adjusting key criteria in the strategy switching parameters block of script settings
Strategies itself
For trading, you can enable or disable various Higher Timeframes Filters (ADX, volatility, technical rating).
With filters enabled, trades will only open when the setting parameters are reached
- Strategy number 1, 2 and 3: is Higher Timeframe TradingView Technical Ratings itself, 1 is summary total rating, 2 is oscillators and 3 is moving averages. When TR filter cross filter levels trade will be open at chart bar close. By Default on chart you see Summary Technical Rating oscillator, but here the options for change it to Oscillator TR or Moving Average TR
- Strategy number 4, 5 and 6: is Chart TimeFrame TR. Trades will open when its values (Summary, Oscillators and Moving Averages) reached setting buy sell level
- Strategy number 7, 8 and 9: is Alternative buy sell logic for Chart TimeFrame TR, trades will open when counting rising or falling values will be reached
- Strategies with number from 10 to 18: is chosen by user adaptive moving averages and oscillators indicators. There in settings you will see many different adaptive length algorithms for trading and different types of moving averages and oscillators. In tooltips in settings you will find very more information, and in settings you will see list of all indicators and algorithms (more than 30 variations). All adaptive strategies have their options in settings for calibrating and plotting
- Strategies with number from 19: its can't be chosen or calibarted, this is needed for avoid overfitting, i try to found mostly time worked strategies and use its with standard settings. In future it's possible to changing current or adding additional strategies. At the time of publication this script uses: Dynamic Swing HH LL (19), Composite indicator (20), %R Exhausting with different signals (21,22,23), Pivot Point SuperTrend (24), Ichimoku Cloud (25), TSI (26), Fib Level RSI (27). I don't plot classic strategies in this script
Let me explain, the value of this script is not in the strategies it includes, but in how exactly it collects the results of their work, how it filters the opening of trades, what risk management it applies and what strategy switching logic it performs. The system itself that you are now reading about represents the main value of this script
Finally if you get access for this script
- You will see many other not described options and possibilities like Kelly position or list of settings for adaptive strategies, also i added many usefull tooltips in script settings
Happy trading, and stay tuned for updates!
DISCLAIMER: No sharing, copying, reselling, modifying, or any other forms of use are authorized for this script, and the information published with them. This script is strictly for individual use. No one know future and Investments are always made at your own risk. I am not responsible for any losses you may incur. Please before investment make sure that chosen logic is enaugh profitable on virtual demo account.
OPR 4 ZonesThe OPR 4-Zone Boxes indicator visualizes four distinct market sessions on your chart by automatically drawing boxed ranges (high / low) and dotted midlines for each session. Each session box is created using time-based timestamps (timezone-aware) and updates in real time during the session. When the session closes, the box is locked to the session end, while an optional extension can display the session range for a configurable period afterward — useful for spotting retests, breakouts, and bias zones.
Designed for traders who rely on session structure and price-action, OPR 4-Zone provides clear, non-intrusive visuals and is fully configurable: enable or disable individual sessions, set start/end and extension times per session, choose colors and transparency for both the primary box and the extension, and display dotted midlines to quickly gauge session control. Objects are cleaned up at the start of each new day to prevent clutter and ensure reliable behavior when scrolling or changing timeframes.
Key features :
- Four independent session boxes (Morning, Afternoon, Evening, Night) with separate enable switches
- Timezone-aware timestamping so boxes align with the session times you want
- Locked session ranges at session close and optional extension period after close
- Dotted midline for quick reference to the session midpoint
- Customizable colors and background transparency for both base and extended boxes
- Automatic cleanup of session objects on new trading day to avoid frozen or stray boxes
- Lightweight and overlay-friendly with sensible defaults for fast setup
Suggested usage :
Use the indicator to mark session ranges for intraday support/resistance, identify where price is trading relative to session midpoint, and watch for breakout or rejection setups near session highs/lows. Combine with volume-based or momentum indicators to confirm breakouts through the session box.

1m OPTION BUY_Multi indi-01 (P) SEMI AUTOEnter every monday choose the option price range between 50 tp 100 , set strategy for a week or 3 three days, set upper limit 120 and lower limit 30 and input your own contract size and all parameters as you wish, and execute the alert (this is how the strtegy made). if you dont have any idea of market direction execute this strtegy for put and call both. be aware this strategy may incurred loss . we r not recomending to use this strategy , this is for education purpose only, watch and analyze then take your own decision.

Volume Profile Auto POC📌 Overview
Volume Profile Auto POC is a trend-following strategy that uses the automatically calculated Point of Control (POC) from the volume profile, combined with ATR zones, to capture reversals and breakouts.
By basing decisions on volume concentration, it dynamically visualizes the price levels most watched by market participants.
⚠️ This strategy is provided for educational and research purposes only.
Past performance does not guarantee future results.
🎯 Strategy Objectives
Automatically detect the volume concentration area (POC) to improve entry accuracy
Optimize risk management through ATR-based volatility adjustment
Provide early and consistent signals when trends emerge
✨ Key Features
Automatic POC Detection : Updates the volume profile over a defined lookback window in real time
ATR Zone Integration : Defines a POC ± 0.5 ATR zone to clarify potential reversals/breakouts
Visual Support : Plots the POC line and zones on the chart for intuitive decision-making
📊 Trading Rules
Long Entry:
Price breaks above the POC + 0.5 ATR zone
Volume is above average to support the breakout
Short Entry:
Price breaks below the POC - 0.5 ATR zone
Volume is above average to support the downside move
Exit (or Reverse Position):
Price returns to the POC area
Or touches the ATR band
⚙️ Trading Parameters & Considerations
Indicator Name: Volume Profile Auto POC
Parameters:
Lookback Bars: 50
Bins for Volume Profile: 24
ATR Length: 14
ATR Multiplier: 2.0
🖼 Visual Support
POC line plotted in red
POC ± 0.5 ATR zone displayed as a semi-transparent box
ATR bands plotted in blue for confirmation
🔧 Strategy Improvements & Uniqueness
This strategy is inspired by traditional Volume Profile + ATR analysis,
while adding the improvement of a sliding-window mechanism for automatic POC updates.
Compared with conventional trend-following approaches,
its strength lies in combining both price and volume perspectives for decision-making.
✅ Summary
Volume Profile Auto POC automatically extracts key market levels (POC) and combines them with ATR-based zones,
providing a responsive trend-following method.
It balances clarity with practicality, aiming for both usability and reproducibility.
⚠️ This strategy is based on historical data and does not guarantee future profits.
Always use proper risk management when applying it.

HD_DİNAMİK SEMBOL-SİNYAL TABLO (STrend + EMA(25/99) – v6.2HD_Dynamic Symbol–Signal Table (Short/Mid/Long) — SuperTrend + EMA(25/99) — v6.2
TL;DR
Invite-only indicator that builds a multi-symbol live signal table combining SuperTrend direction with EMA 25/99 state, across three timeframe groups: Short (5/15/30), Mid (45/60/120), Long (180/240/D).
Top 2 rows (e.g., BTC, ETH) always show the full 3×(ST, EMA) matrix; the remaining rows show the active group to stay lightweight. The table colors & texts are highly configurable, and the indicator emits clean alert messages you can route to webhooks (e.g., your bot).
1) What it does
Signal logic (per symbol & timeframe):
SuperTrend direction + EMA 25 vs 99 comparison.
Combination map:
ST=LONG & EMA=LONG → "LONG YAP"
ST=SHORT & EMA=SHORT → "SHORT YAP"
ST=SHORT & EMA=LONG → "SHORT/LONG YAP" (mixed)
ST=LONG & EMA=SHORT → "LONG/SHORT YAP" (mixed)
Timeframe groups
Short: 5/15/30
Mid: 45/60/120
Long: 180/240/D
Auto mode infers the group from the chart TF; Manual mode lets you pin a group.
Pinned priority rows: Row #1 and #2 (default BTC/ETH) always display all three TFs (ST & EMA pairs).
Dynamic list (rows 3–30): Shows only the active group for each symbol to stay fast and readable.
Implementation note: in this build the ST “up”/“down” plotting uses the SuperTrend dir sign convention where dir < 0 is rendered as Uptrend and dir > 0 as Downtrend in visuals. The table/alerts already normalize this into LONG/SHORT text.
2) Table, styling & filters
Placement & fonts: position, title/group/header/body font sizes.
Colors: per-cell/background for header rows, LONG/SHORT states, and distinct brand colors per symbol row (BTC=blue, ETH=amber, majors=greens, mid-caps=oranges, high-risk=reds, new/hyped=purple range).
Symbol column text: “Symbol only”, “Short+Symbol”, or “Short only”.
Filter: Show All / LONG YAP / SHORT YAP / SHORT/LONG YAP / LONG/SHORT YAP. (Pinned BTC/ETH still visible.)
3) Alerts & webhook messages
Per-row alerts: When the active TF for a row resolves on bar close, the indicator sends:
|symbol=|tf=|signal=
Example: HD_ST_EMA|symbol=BINANCE:BTCUSDT|tf=15|signal=LONG YAP
Configure the alert to Once per bar close and set a webhook URL if you want to forward to an execution bot.
Ready-made alertconditions (Robot block):
Select a single alarmSymbol and get four conditions: LONG YAP, SHORT YAP, SHORT/LONG YAP, LONG/SHORT YAP.
Chart-symbol conditions: Extra alertconditions for EMA LONG/SHORT and ST LONG/SHORT on the current chart symbol, if you also want single-symbol triggers.
4) Drawing package (optional)
SuperTrend line with Up/Down segments and trend-flip labels.
EMA 25/99 lines and cross labels.
Main mixed-state labels for the chart symbol can be toggled (LONG/SHORT & mixed cases).
5) Symbols & safety
Priority inputs (#1–2) for BTC/ETH; inputs #3–30 for your list (supports formats like BINANCE:BTCUSDT or BTCUSDT.P).
A basic format validator ignores obviously malformed tickers to avoid request errors.
request.security() powers all multi-TF/multi-symbol reads.
6) How to use
Add indicator to the chart.
Choose Auto (group follows chart TF) or pick Short/Mid/Long manually.
Fill your symbol list (rows 3–30). BTC & ETH are pinned at the top.
Set filter (or keep “All”).
(Optional) Adjust fonts/colors and the “Symbol column” text mode.
Turn Alert on; set alertPrefix if you need a specific route tag.
Create an alert on the indicator, Once per bar close, and (optionally) add a webhook URL.
7) Notes & limits
This is an indicator (no orders are placed). Use the alerts to trigger your own automation.
Designed for crypto symbols; works on other markets if your vendor supports the tickers/timeframes.
Table resizes dynamically to your active list; heavy watchlists may still be constrained by platform limits.
8) Disclaimer
Educational use only. Not financial advice. Past performance does not guarantee future results.
Changelog
v6.2 — Auto/Manual TF-grouping, pinned BTC/ETH tri-TF view, robust alert text format, color-coded priorities, safer symbol validation, ST/EMA flip labels, dynamic table sizing.
Türkçe Özet
Ne yapar?
Birden fazla sembol için SuperTrend + EMA(25/99) durumunu üç periyot grubunda (Kısa 5/15/30 – Orta 45/60/120 – Uzun 180/240/Günlük) tek tabloda gösterir.
BTC/ETH ilk iki satırda her zaman 3×(ST, EMA) birlikte görünür; diğer satırlar aktif gruba göre (performans için) tek grup gösterir.
Sinyal mantığı
İkisi de LONG → LONG YAP
İkisi de SHORT → SHORT YAP
Karışık → SHORT/LONG YAP veya LONG/SHORT YAP (ST/EMA’ya göre)
Alarm & Webhook
Satır bazlı alarm metni:
HD_ST_EMA|symbol=...|tf=...|signal=... (bar kapanışında).
“Robot” bölümünde tek bir sembol için 4 ayrı alertcondition hazır.
Grafikteki sembol için ayrıca EMA LONG/SHORT ve ST LONG/SHORT koşulları da var.
Kullanım
Otomatik/Elle grup seç;
Listeyi doldur (3–30);
Filtre/renk/yazı ayarla;
Alarmı aç ve Once per bar close ile kur; gerekiyorsa webhook URL ekle.
Not
Gösterge emir vermez; sinyalleri kendi köprüne/botuna yönlendirirsin. Yatırım tavsiyesi değildir.

MomentumScriptThis is Momentum Tracker based on Richard Driehaus' research:
1) 12–1 momentum (return from t-12 months to t-1 month
2) FIP / path efficiency (many small up days > one big gap)
3) Proximity to 52-week high/low

Cnagda Liquidit Trading SystemCnagda Liquidit Trading System helps spot where price is likely to trap traders and reverse, then gives simple, actionable Level to entry, place SL, and take profits with confidence. It blends imbalance zones, trend bias, order blocks, liquidity pools, high-probability fake Signal, and context-aware candle patterns into one clean workflow.
🟩🟥 Imbalance boxes: “Crowd rushed, gaps left”
What it is: Green/red boxes mark fast, one-sided moves where price “skipped” orders—think FVG-like zones that often get revisited.
Why it helps: Price frequently pulls back to “fill” these zones, creating clean retest entries with logical stops.
⏩How to use:
Green box = potential demand retest; Red box = potential supply retest. Enter on pullback into box, not on first impulse. Put stop on far side of box and aim first targets at recent swing points.
↕️ Swing bias (HH/HL vs LH/LL): “Which way is the road?”
What it is: Higher-highs/higher-lows = up-bias; Lower-highs/lower-lows = down-bias. system plots Buy/Sell OB levels aligned with that bias.
Why it helps: Trading with the broader flow reduces “hero trades” against institutions. Bias gives clearer entries and cleaner drawdowns.
⏩How to use:
Up-bias: look for long on Buy OB retests. Down-bias: look for short on Sell OB retests. Wait for a small rejection/engulfing to confirm before triggering.
🧱Order blocks: “Where big players remember”
What it is: last opposite-colored candle before an impulsive move—these zones often hold memory and reaction. system plots these as Buy/Sell OB lines.
Why it helps: Many breakouts pull back to the origin. Good entries often happen on retest, not on the breakout chase.
⏩ How to use:
Let price return into the OB, show wick rejection, and decent volume. Enter with stop beyond OB; define risk-reward before entry.
📊Volume coloring: “How Volume is move?”
What it is: Bar color reflects relative volume; inside bars are black. The dashboard also shows Volume and “Volume vs Prev.”
Why it helps: Patterns without volume often fade; volume validates strength and intent of moves.
⏩ How to use:
Favor entries where imbalance/OB/liquidity-grab coincide with higher volume. If volume is weak, reduce size or skip.
🧲 BSL/SSL liquidity pools: “Fishing for stops”
What it is: Equal highs cluster stops above (BSL); equal lows cluster stops below (SSL). system plots these and highlights the nearest one (“magnet”).
Why it helps: Price often sweeps these pools to trigger stops before reversing. This is a prime trap-reversal location.
⏩ How to use:
Watch nearest BSL/SSL. If price wicks through and closes back inside, anticipate a reversal. Trade reaction, not first poke. When price closes beyond, consider that pool mitigated and move on.
🟢🔴 Advanced liquidity grab: “Catch fakeout”
What it is: Bullish grab = makes a new low beyond a prior low but closes back above it, with a long lower wick, small body, and higher volume. Bearish is mirror. Labeled automatically.
Why it helps: It exposes trap moves (stop hunts) and often precedes true direction.
⏩ How to use:
Best when it aligns with a nearby imbalance/OB and supportive volume. Enter on reversal candle break or on retest. Stop goes beyond sweep wick.
🧠 Smart candlestick patterns (only in right place)
What it is: Engulfing, Hammer, Shooting Star, Hanging Man, Doji (with high volume), Morning/Evening Star, Piercing—but marked “effective” only if context (swing/trend/location) agrees.
Why it helps: same pattern in the wrong place is noise; in the right place, it’s signal.
⏩ How to use:
Location first (BSL/SSL/OB/imbalance), then pattern. Treat pattern as trigger/confirmation—one fresh label shows to keep chart clean.
🧭 Dashboard: “Context in a glance”
⏩ Reversal Level: current swing anchor—expect turns or reactions nearby; great for alerts and planning.
⏩ Volume vs Prev + Volume: Strength meter for signal candle—higher adds conviction.
⏩ Nearest Pool: next “magnet” area—look for sweeps/rejections there.
🧩Step-by-step trading flow (with mindset)
⏩ Set bias: HH/HL = long bias, LH/LL = short bias. Counter-trend only on clean sweeps with strong confirmation.
⏩ Find magnet: Check Nearest Pool (BSL/SSL). Focus attention there; it saves screen time.
⏩ Wait for event: Look for a sweep/grab label, or sharp rejection at pool/OB/imbalance. Avoid FOMO.
⏩ Add confluence: Stack 2–3 of these—imbalance box, OB, contextual pattern, supportive volume.
⏩Plan entry: Bullish: trigger above reversal candle high or take retest of FVG/OB. Stop below sweep wick/zone. Target at least 1:1.5–1:2.
Bearish: mirror above.
⏩Manage smartly: Take partials, move to breakeven or trail thoughtfully. Don’t drag stops inside zone out of emotion.
🎛️ Parameter tuning (to reduce human error)
⏩ swingLen: Smaller = faster but noisier; larger = cleaner but slower. Backtest first, then go live.
⏩ Tolerance (ATR or percent): ATR tolerance adapts to volatility (good for fast markets and lower TFs). Start around 0.15–0.30. In calm markets, try percent 0.05–0.15%.
⏩ minBarsGap: Start with 3–5 so equal highs/lows are truly equal—reduces false pools.
❌Common mistakes → ✅ Better habits
⏩Chasing every breakout → Wait for sweep/rejection, then confirm.
⏩Ignoring volume → Validate strength; cut size or skip on weak volume.
⏩Losing history of pools → If reviewing/backtesting, keep mitigated pools visible (dashed/faded).
⏩Over-tight tolerance/too small swingLen → Increases false signals; backtest to find balance.
📝 checklist (before entry)
⏩ Is there a nearby BSL/SSL and did a sweep/grab happen there?
⏩ Is there a close imbalance/OB that price can retest?
⏩ Do we have an effective pattern plus supportive volume?
⏩Is the stop beyond the wick/zone and RR ≥ 1:1.5?
•?((¯°·._.• 🎀 𝐻𝒶𝓅𝓅𝓎 𝒯𝓇𝒶𝒹𝒾𝓃𝑔 🎀 •._.·°¯((?•

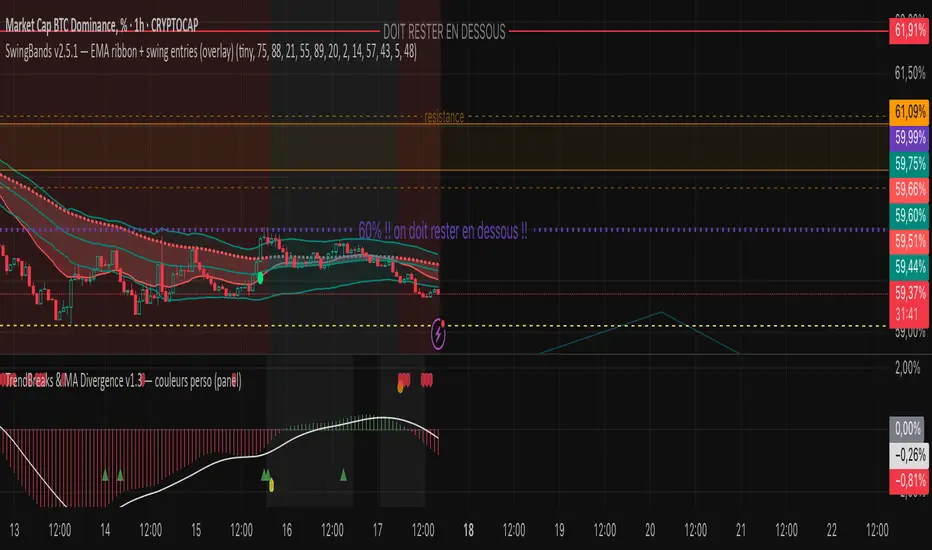
TrendBreaks & MA Divergence v1.3 — couleurs perso (panel)clean and easy predictive mouvements and swing stratagy
FREEDOM - TJR Model\ FREEDOM – TJR Model\ 🚀
\ Automates TJR’s well-known NQ playbook with clean visuals, filters, and alerts—so you can focus on execution.\
\ Core idea\
1. Trade \ NQ\ in the \ New York session\ 🗽
2. Wait for a \ liquidity sweep\ of a \ prior session\ High/Low (Asia or London) ✂️
3. Confirm with \ SMT (NQ vs ES) divergence\ 🔀
4. Act on a \ proprietary entry signal\ 🔒
5. Risk at the swing 🛡️, target \ untapped internal/session liquidity\ 🎯
This indicator draws those session levels for you, tracks sweeps, detects SMT, applies higher-timeframe confluence, and fires alerts that respect your time window and filters.
---
\ What it draws & detects\
\ • Sessions & Liquidity Sweeps\ 🕒
* Plots \ Asia / London / New York\ session bands.
* On session close, it freezes the session’s \ High/Low\ as dotted “previous-session levels” and \ extends them forward\ until price \ crosses\ (choose \ Wicks\ or \ Close\ ).
* When price takes a previous-session \ High\ → \ Buyside sweep\ ; takes a \ Low\ → \ Sellside sweep\ .
* Optional \ Sweep Zones\ expand around the swept level using an \ ATR(21)\ margin; can auto-fade “fake” sweeps.
\ Tip: Keep “Extend previous session High/Low until cross” ON to maintain a clean roadmap into NY open.\
\ • SMT Divergence (NQ vs ES)\ 🔀
* Classic pivot-to-pivot SMT:
* \ Bearish SMT\ = NQ makes a \ higher high\ while ES does \ not\ .
* \ Bullish SMT\ = NQ makes a \ lower low\ while ES does \ not\ .
* Draws \ lines\ from pivot to pivot (no chart spam), with optional inline “SMT” label and optional confidence \ score\ (0–100) based on strength + recency.
* Context aware:
* Only shows \ Bearish SMT\ after a \ buy-side sweep\ (previous-session High taken).
* Only shows \ Bullish SMT\ after a \ sell-side sweep\ (previous-session Low taken).
* Respects your \ NY time window\ if enabled.
\ • Proprietary Entry Signals\ 🔒
* Prints entry lines + arrows only when your rules align (proprietary detection under the hood).
* Respects:
* \ Session-sweep bias\ (optional): Sells only after buy-side sweep; Buys only after sell-side sweep.
* \ Monotonic filter\ : new Sell must be \ higher\ than last Sell; new Buy must be \ lower\ than last Buy (resets each session).
* \ Minimum distance\ to nearest previous-session dotted level (in ticks).
* \ NY time filter\ window.
* \ HTF confluence\ (see below).
---
\ HTF Confluence (optional)\ 📈
* Choose \ MA slope\ (\ EMA/SMA/RMA/WMA\ ) or \ HH/HL structure\ on a higher timeframe (e.g., 60m/240m).
* Entry arrows and alerts can be gated so they only print when HTF bias agrees with the setup.
\ Tip: Start with EMA 50 on 60m for a smooth directional filter; add HH/HL only if you want stricter structure confirmation.\
---
\ Dashboard (bottom-right)\ 🧩
* \ VWAP state\ :
* \ Overbought\ (🔴) if close > VWAP + (mult × stdev)
* \ Oversold\ (🟢) if close < VWAP − (mult × stdev)
* Otherwise \ Neutral\ (⚪️)
* \ Premium / Discount\ vs previous-session 50% midline: Premium = above (red bias), Discount = below (green bias).
* \ SMT row\ : Bullish / Bearish / Neutral with optional score.
---
\ How to use the settings (quick tour)\
\ ENTRY\
* \ Entry Swing Length\ : lower = more signals.
* \ Confirmation\ : \ Candle Close\ or \ Wicks\ for breakout.
* \ Filter entry by session sweeps\ : enforces “sell after buy-side sweep, buy after sell-side sweep.”
* \ Minimum distance (ticks)\ : blocks entries too close to previous-session dotted levels.
* \ Replay mode\ : keeps entries visible in Bar Replay.
* \ NY Time filter\ : default \ 08:00–14:00 NY\ ; arrows/alerts respect the window.
* \ Arrow offset (ticks)\ : how far above/below the candle to plot the arrow.
\ SESSION SWEEPS\
* Toggle \ Buyside/Sellside zones\ , adjust \ ATR(21)\ margin & length.
* \ Hide Fake Sweep Zones\ (default ON).
* \ Extend H/L until cross\ (Wicks/Close).
* Optional \ daily reset\ for unswept dotted lines.
\ SESSIONS\
* Enable/disable \ Asia, London, NY AM, NY PM\ ; set start/end; choose color; extend midline if desired.
* DST toggles for NY/London.
\ HTF Confluence\
* Turn it ON/OFF; pick timeframe & method (MA slope or HH/HL); set MA type/length or swing length.
\ Dashboard\
* Show/hide table; set VWAP stdev length/multiplier.
* SMT settings: comparison symbol (\ default ES1!\ ), pivot length, show score/labels, recency window, etc.
\ Alerts\ (always last) 🔔
* \ Session line cross\ : choose Highs/Lows and crossing mode (\ Same as extension / Wicks / Close\ ).
* \ Entry alerts\ : \ Filtered / Unfiltered / Both\ .
* \ Filtered\ = respects sweep bias, HTF confluence, minimum distance, monotonic rule, and time window.
* \ Unfiltered\ = ignores sweep bias/HTF/monotonic (still respects minimum distance + time window).
* All entry alerts also respect the \ NY time window\ when enabled.
---
\ Suggested workflow\
* Open NQ on a 1–5m chart.
* Let the dotted \ previous-session H/L\ extend into NY; wait for a \ sweep\ .
* Check \ SMT\ : after buy-side sweep → look for \ bearish SMT\ ; after sell-side sweep → look for \ bullish SMT\ .
* Take the \ proprietary entry\ when filters agree.
* Stop at the swing; aim for \ untapped internal/session liquidity\ .
* Let \ alerts\ handle the monitoring.
---
\ Why traders like it\
* It mirrors the model popularized by \ TJR\ while removing the chart admin: sessions, sweeps, SMT, HTF gating, distances, monotonic sequencing, time windows, and ready-to-use alerts—so your execution stays consistent. ✨
---
\ Disclaimer\ ⚠️
\ This tool is for educational purposes only and does not constitute financial advice. Markets involve risk; always do your own research and test in replay/paper before trading live. FREEDOM – TJR Model is inspired by TJR’s publicly known framework but is not affiliated with, endorsed by, or sponsored by TJR. You are solely responsible for your trading decisions and outcomes.\

Straddle Charts - Live (Enhanced)Track options straddles with ease using the Straddle Charts - Live (Enhanced) indicator! Originally inspired by @mudraminer, this Pine Script v5 tool visualizes live call, put, and straddle prices for instruments like BANKNIFTY. Plotting call (green), put (red), and straddle (black) prices in a separate pane, it offers real-time insights for straddle strategy traders.
Key Features:
Live Data: Fetches 1-minute (customizable) option prices with error handling for invalid symbols.
Price Table: Displays call, put, straddle prices, and percentage change in a top-left table.
Volatility Alerts: Highlights bars with straddle price changes above a user-defined threshold (default 5%) with a yellow background and concise % labels.
Robust Design: Prevents plot errors with na checks and provides clear error messages.
How to Use: Input your call/put option symbols (e.g., NSE:NIFTY250814C24700), set the timeframe, and adjust the volatility threshold. Monitor straddle costs and volatility for informed trading decisions.
Perfect for options traders seeking a simple, reliable tool to track straddle performance. Check it out and share your feedback!

Hassi XAUUSD STRATEGY BOTGold (XAUUSD) 15m trend+momentum based signals with EMA(9/21/200), RSI, custom ADX, ATR-based SL/TP & alerts
Works on XAUUSD 15m.
Entry: EMA9/21 cross + price relative to EMA200 + RSI filter + custom ADX trend strength.
Risk: default SL=1.5×ATR, TP=2×ATR (editable).
Notes: No financial advice. Backtest before live use. Avoid high-impact news whipsaws.

SAFE Leverage x50Description:
Safe Leverage x50 is an indicator designed to help traders choose prudent, realistic, and dynamic leverage, adapted to the timeframe and volatility of the asset they are trading.
Based on rigorous statistical and practical observation, this indicator does not propose fixed rules, but rather provides a visual estimate of the maximum leverage a typical trade can tolerate without being liquidated, based on the current candle's movement range. At the same time, it automatically suggests a more conservative leverage (by default, half of the maximum) for more controlled risk management.

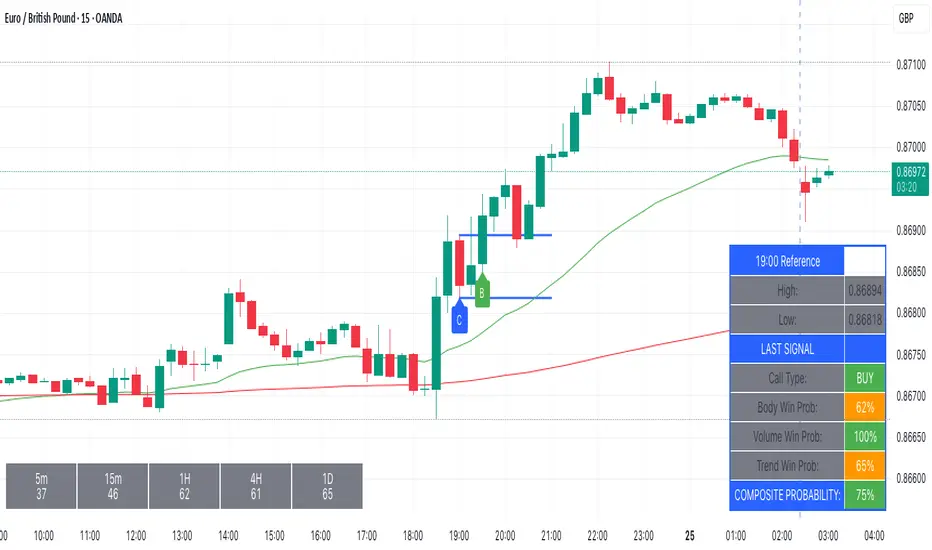
Kairos BarakahTrade with precision during high-probability windows using this advanced Pine Script indicator, designed specifically for Indian Standard Time (IST). The tool identifies key reversal opportunities within a user-defined trading session, combining time-based reference levels, sequence-validated signals, and multi-factor win probability analysis for confident decision-making.
Key Features
1. Time-Based Reference Levels
Automatically sets high/low reference levels at a customizable start time (default: 19:00 IST).
Active trading window with adjustable duration (default: 135 minutes).
Clear visual reference lines for easy tracking.
2. Intelligent Signal Generation
Initial Signals:
Buy (B): Triggered when price closes above the reference high.
Sell (S): Triggered when price closes below the reference low.
Reversal Signals (R):
Valid only after an initial signal, ensuring proper sequence.
Buy Reversal: Price closes above reference high (after a Sell signal).
Sell Reversal: Price closes below reference low (after a Buy signal).
3. Multi-Dimensional Win Probability
Body Strength: Measures candle conviction (body size / total range).
Volume Confirmation: Compares current volume to 20-period average.
Trend Alignment: Uses EMA crosses (9/21) and RSI (14) for momentum.
Composite Score: Weighted blend of all factors, color-coded for quick interpretation:
🟢 >70%: High-confidence signal.
🟠 40-69%: Moderate confidence.
🔴 <40%: Weak signal.
4. Professional Visualization
Clean labels (B/S/R) at signal points.
Real-time reference table showing levels, active signal, and probabilities.
Customizable alerts for all signal types.
Why Use This Indicator?
IST-Optimized: Tailored for Indian market hours.
Rules-Based Reversals: Avoids false signals with strict sequence checks.
Data-Driven Confidence: Win probability metrics reduce guesswork.
Flexible Setup: Adjust time windows and parameters to fit your strategy.
Institutional Sessions Overlay (Asia/London/NY)Institutional Sessions Overlay is a professional TradingView indicator that visually highlights the main trading sessions (Asia, London, and New York) directly on your chart.
Customizable: Easily adjust session start and end times (including minutes) for each market.
Timezone Alignment: Shift session boxes using the timezone offset parameter so sessions match your chart’s timezone exactly.
Clear Visuals: Colored boxes and optional labels display session opens and closes for fast institutional market structure reference.
Toggle Labels: Show or hide session open/close labels with a single click for a clean or detailed look.
Intuitive UI: User-friendly grouped settings for efficient configuration.
This tool is designed for day traders, institutional traders, and anyone who wants to instantly recognize global session timing and ranges for SMC, ICT, and other session-based strategies.
How to use:
Set your chart to your local timezone.
Use the "Session timezone offset" setting if session boxes do not match actual session opens on your chart.
Adjust the hours and minutes for each session as needed.
Enable or disable labels in the “Display” settings group.
Tip: Use the overlay to spot session highs and lows, volatility windows, and institutional liquidity sweeps.

Reversal Strength Meter – Adib NooraniThe Reversal Strength Meter is an oscillator designed to identify potential reversal zones based on supply and demand dynamics. It uses smoothed stochastic logic to reduce noise and highlight areas where momentum may be weakening, signaling possible market turning points.
🔹 Smooth, noise-reduced stochastic oscillator
🔹 Custom zones to highlight potential supply and demand imbalances
🔹 Non-repainting, compatible across all timeframes and assets
🔹 Visual-only tool — intended to support discretionary trading decisions
This oscillator assists scalpers and intraday traders in tracking subtle shifts in momentum, helping them identify when a market may be preparing to reverse — always keeping in mind that trading is based on probabilities, not certainties.
📘 How to Use the Indicator Efficiently
For Reversal Trading:
Buy Setup
– When the blue line dips below the 20 level, wait for it to re-enter above 20.
– Look for reversal candlestick patterns (e.g., bullish engulfing, hammer, or morning star).
– Enter above the pattern’s high, with a stop loss below its low.
Sell Setup
– When the blue line rises above the 80 level, wait for it to re-enter below 80.
– Look for bearish candlestick patterns (e.g., bearish engulfing, inverted hammer, or evening star).
– Enter below the pattern’s low, with a stop loss above its high.
🛡 Risk Management Guidelines
Risk only 0.5% of your capital per trade
Book 50% profits at a 1:1 risk-reward ratio
Trail the remaining 50% using price action or other supporting indicators

Reversal Scalping Ribbon - Adib NooraniThe Reversal Scalping Ribbon is a trend-following overlay tool designed to visually identify potential reversal zones based on price extremes and dynamic volatility bands. It calculates adaptive upper and lower bands using price action and custom ATR logic, helping traders quickly assess market direction and possible turning points
🔹 Volatility-adjusted bands based on price highs/lows
🔹 Color-coded ribbons to indicate trend bias and potential reversal shifts
🔹 No repainting, works on all timeframes and assets
🔹 Visual-only display, no trade signals — supports discretion-based entries
This ribbon is designed for scalpers and intraday traders to spot reversal setups with clarity. It enhances your trading by showing real-time market bias without unnecessary distractions. By focusing on probabilities, it helps to improve decision-making in fast-paced environments
How to use the indicator efficiently
For Reversal Trading:
Buy: When price closes below the green ribbon with a red candle, then re-enters with a green candle. Enter above the high of the green candle with a stop loss below the lowest low of the recent green/red candles
Sell: When price closes above the red ribbon with a green candle, then re-enters with a red candle. Enter below the low of the red candle with a stop loss above the highest high of the recent red/green candles
Risk Management:
Limit risk to 0.5% of your capital per trade
Take 50% profit at a 1:1 risk-reward ratio
For the remaining 50%, trail using the lower edge of the green band for buys and the upper edge of the red band for sells

RSI Full [Titans_Invest]RSI Full
One of the most complete RSI indicators on the market.
While maintaining the classic RSI foundation, our indicator integrates multiple entry conditions to generate more accurate buy and sell signals.
All conditions are fully configurable, allowing complete customization to fit your trading strategy.
⯁ WHAT IS THE RSI❓
The Relative Strength Index (RSI) is a technical analysis indicator developed by J. Welles Wilder. It measures the magnitude of recent price movements to evaluate overbought or oversold conditions in a market. The RSI is an oscillator that ranges from 0 to 100 and is commonly used to identify potential reversal points, as well as the strength of a trend.
⯁ HOW TO USE THE RSI❓
The RSI is calculated based on average gains and losses over a specified period (usually 14 periods). It is plotted on a scale from 0 to 100 and includes three main zones:
Overbought: When the RSI is above 70, indicating that the asset may be overbought.
Oversold: When the RSI is below 30, indicating that the asset may be oversold.
Neutral Zone: Between 30 and 70, where there is no clear signal of overbought or oversold conditions.
⯁ ENTRY CONDITIONS
The conditions below are fully flexible and allow for complete customization of the signal.
______________________________________________________
🔹 CONDITIONS TO BUY 📈
______________________________________________________
• Signal Validity: The signal will remain valid for X bars .
• Signal Sequence: Configurable as AND/OR .
📈 RSI Conditions:
🔹 RSI > Upper
🔹 RSI < Upper
🔹 RSI > Lower
🔹 RSI < Lower
🔹 RSI > Middle
🔹 RSI < Middle
🔹 RSI > MA
🔹 RSI < MA
📈 MA Conditions:
🔹 MA > Upper
🔹 MA < Upper
🔹 MA > Lower
🔹 MA < Lower
📈 Crossovers:
🔹 RSI (Crossover) Upper
🔹 RSI (Crossunder) Upper
🔹 RSI (Crossover) Lower
🔹 RSI (Crossunder) Lower
🔹 RSI (Crossover) Middle
🔹 RSI (Crossunder) Middle
🔹 RSI (Crossover) MA
🔹 RSI (Crossunder) MA
🔹 MA (Crossover) Upper
🔹 MA (Crossunder) Upper
🔹 MA (Crossover) Lower
🔹 MA (Crossunder) Lower
📈 RSI Divergences:
🔹 RSI Divergence Bull
🔹 RSI Divergence Bear
______________________________________________________
______________________________________________________
🔸 CONDITIONS TO SELL 📉
______________________________________________________
• Signal Validity: The signal will remain valid for X bars .
• Signal Sequence: Configurable as AND/OR .
📉 RSI Conditions:
🔸 RSI > Upper
🔸 RSI < Upper
🔸 RSI > Lower
🔸 RSI < Lower
🔸 RSI > Middle
🔸 RSI < Middle
🔸 RSI > MA
🔸 RSI < MA
📉 MA Conditions:
🔸 MA > Upper
🔸 MA < Upper
🔸 MA > Lower
🔸 MA < Lower
📉 Crossovers:
🔸 RSI (Crossover) Upper
🔸 RSI (Crossunder) Upper
🔸 RSI (Crossover) Lower
🔸 RSI (Crossunder) Lower
🔸 RSI (Crossover) Middle
🔸 RSI (Crossunder) Middle
🔸 RSI (Crossover) MA
🔸 RSI (Crossunder) MA
🔸 MA (Crossover) Upper
🔸 MA (Crossunder) Upper
🔸 MA (Crossover) Lower
🔸 MA (Crossunder) Lower
📉 RSI Divergences:
🔸 RSI Divergence Bull
🔸 RSI Divergence Bear
______________________________________________________
______________________________________________________
🤖 AUTOMATION 🤖
• You can automate the BUY and SELL signals of this indicator.
______________________________________________________
______________________________________________________
⯁ UNIQUE FEATURES
______________________________________________________
Signal Validity: The signal will remain valid for X bars
Signal Sequence: Configurable as AND/OR
Condition Table: BUY/SELL
Condition Labels: BUY/SELL
Plot Labels in the Graph Above: BUY/SELL
Automate and Monitor Signals/Alerts: BUY/SELL
Signal Validity: The signal will remain valid for X bars
Signal Sequence: Configurable as AND/OR
Condition Table: BUY/SELL
Condition Labels: BUY/SELL
Plot Labels in the Graph Above: BUY/SELL
Automate and Monitor Signals/Alerts: BUY/SELL
______________________________________________________
📜 SCRIPT : RSI Full
🎴 Art by : @Titans_Invest & @DiFlip
👨💻 Dev by : @Titans_Invest & @DiFlip
🎑 Titans Invest — The Wizards Without Gloves 🧤
✨ Enjoy the Spell!
______________________________________________________
o Mission 🗺
• Inspire Traders to manifest Magic in the Market.
o Vision 𐓏
• To elevate collective Energy 𐓷𐓏

ZVOL — Z-Score Volume Heatmapⓩ ZVOL transforms raw volume into a statistically calibrated heatmap using Z-score thresholds. Unlike classic volume indicators that rely on fixed MA comparisons, ZVOL calculates how many standard deviations each volume bar deviates from its mean. This makes the reading adaptive across timeframes and assets, in order to distinguish meaningful crowd behavior from random volatility.
📊 The core display is a five-zone histogram, each encoded by color and statistical depth. Optional background shading mirrors these zones across the entire pane, revealing subtle compression or structural rhythm shifts across time. By grounding the volume reading in volatility-adjusted context, ZVOL inhibits impulsive trading tactics by compelling the structure, not the sentiment, to dictate the signal.
🥵 Heatmap Coloration:
🌚 Suppressed volume — congestion, coiling phases
🩱 Stable flow — early trend or resting volume
🏀 High activity — emerging pressure
💔 Extreme — possible climax or institutional print
🎗️ A dynamic Fibonacci-based 21:34-period EMA ribbon overlays the histogram. The fill area inverts color on crossover, providing a real-time read on tempo, expansion, or divergence between price structure and crowd effort.
💡 LTF Usage Suggestions:
• Confirm breakout legs when orange or red zones align with range exits
• Fade overextended moves when red bars appear into resistance
• Watch for rising EMAs and orange volume to front-run impulsive moves
• Combine with volatility suppression (e.g. ATR) to catch compression → expansion transitions
🥂 Ideal Pairings:
• OBVX Conviction Bias — to confirm directional intent behind volume shifts
• SUPeR TReND 2.718 — for directional filters
• ATR Turbulence Ribbon — to detect compression phases
👥 The OBVX Conviction Bias adds a second dimension to ZVOL by revealing whether crowd effort is aligning with price direction or diverging beneath the surface. While ZVOL identifies statistical anomalies in raw volume, OBVX tracks directional commitment using cumulative volume and moving average cross logic. Use them together to spot fake-outs, anticipate structure-confirmed breakouts, or time pullbacks with volume-based conviction.
🔬 ZVOL isn’t just a volume filter — it’s a structural lens. It reveals when crowd effort is meaningful, when it's fading, and when something is about to shift. Designed for structure-aware traders who care about context, not noise.

7-Channel Trend Meter v3🔥 7-Channel Trend Meter – Ultimate Trend Confirmation Tool 💹
Purpose: Supplementary indicator used as confirmation
The 7-Channel Trend Meter offers an all-in-one confirmation system that combines 7 high-accuracy indicators into one easy-to-read visual tool. Say goodbye to guesswork and unnecessary tab-switching—just clear, actionable signals for smarter trades. Whether you're trading stocks, crypto, or forex, this indicator streamlines your decision-making process and enhances your strategy’s performance.
⚙️ What’s Inside The Box?
Here is each tool that the Trend Meter uses, and why/how they're used:
Average Directional Index: Confirms market strength ✅
Directional Movement Index: Confirms trend direction ✅
EMA Cross: Confirms reversals in trend through average price ✅
Relative Strength Index: Confirms trend through divergences ✅
Stochastic Oscillator: Confirms shifts in momentum ✅
Supertrend: Confirms trend-following using ATR calculations ✅
Volume Delta: Confirms buying/selling pressure weight by finding differences ✅
🧾 How To Read It:
🟨 Bar 1 – Market Strength Meter:
Light Gold 🟡: Strong market with trending conditions.
Dark Gold 🟤: Weakening market or consolidation—proceed with caution.
📊 Bars 2 to 7 – Trend Direction Confirmations:
🟩 Green: Bullish signal, uptrend likely.
🟥 Red: Bearish signal, downtrend likely.
💯 Why it's helpful to traders:
✅ 7 Confirmations in 1 View: No need to flip between multiple charts.
✅ Visual Clarity: Spot trends instantly with a quick glance.
✅ Perfect for Entry Confirmation: Confirm trade signals before pulling the trigger.
✅ Boosts Your Win Rate: Make data-backed decisions, not guesses.
✅ Works Across Multiple Markets: Stocks, crypto, forex—you name it 🌍.
🤔 "What's with the indicator mashup/How do these components work together? 🤔
The 7-Channel Trend Meter is designed as an original and useful tool that integrates multiple indicators to enhance trading decisions, rather than merely combining existing tools without logical coherence. This strategic mashup creates a comprehensive analysis framework that offers deeper insights into market conditions by capitalizing on each component's unique strengths. The careful integration of seven indicators creates a unified system that eliminates conflicting signals and enhances the decision-making process. Rather than simply merging indicators for the sake of it, the 7-Channel Trend Meter is designed to streamline trading strategies, making it a practical tool for traders across various markets. By leveraging the combined strengths of these indicators, traders can act with greater confidence, backed by comprehensive data rather than fragmented insights. Here’s how they synergistically work together:
Average Directional Index (ADX) and Directional Movement Index (DMI): The reason for this mashup is because ADX indicates the strength of the prevailing trend, while the DMI pinpoints its direction. Together, they equip traders with a dual framework that not only identifies whether to engage with a trend but also quantifies its strength, allowing for more decisive trading strategies.
EMA Cross: The reason for this addition to the mashup is because this tool signals potential trend reversals by identifying moving average crossovers. When combined with the ADX and DMI, traders can better differentiate between genuine trend shifts and market noise, leading to more accurate entries.
Relative Strength Index (RSI) and Stochastic Oscillator: The reason for this mashup is because by using both momentum indicators, traders gain a multifaceted view of market dynamics. The RSI assesses overbought or oversold conditions, while the Stochastic Oscillator confirms momentum shifts. When both agree with the trend signals from the DMI, it enhances the reliability of reversal or continuation strategies.
Supertrend: The reason for this addition to the mashup is because as a trailing stop based on market volatility, the Supertrend indicator works hand-in-hand with the ADX’s strength assessment, allowing traders to ride strong trends while managing risk. This cohesion prevents premature exits during minor pullbacks.
Volume Delta: The reason for this addition to the mashup is because integrating volume analysis helps validate signals from the price action indicators. Significant volume behind a price movement reinforces the likelihood of its continuation, ensuring that traders can act on well-supported signals.
🔍 How it does what it says it does 🔍
While the exact calculations remain proprietary, the following outlines how the components synergistically work to aid traders in making informed decisions:
Market Strength Assessment: Average Directional Index (ADX)
This component is used as confirmation by measuring the strength of the market trend on a scale from 0 to 100. A reading above 20 generally indicates a strong trend, while readings below 20 suggest sideways movement. The Trend Meter flags strong trends, effectively helping traders identify optimal conditions for entering positions.
Trend Direction Confirmation: Directional Movement Index (DMI)
This component is used as confirmation by distinguishing between bullish and bearish trends by evaluating price movements. This combination allows traders to confirm not only if a trend exists but also its direction, informing whether to buy or sell.
Trend Reversal Detection: Exponential Moving Average (EMA) Cross
This component is used as confirmation by calculating two EMAs (one shorter and one longer) to identify potential reversal points. When the shorter EMA crosses above the longer EMA, it signals a bullish reversal, and vice versa for bearish reversals. This helps traders pinpoint optimal entry or exit points.
Momentum Analysis: Relative Strength Index (RSI) and Stochastic Oscillator
These components are used as confirmation by providing insights into momentum. The RSI assesses the speed and change of price movements, indicating overbought or oversold conditions. The Stochastic Oscillator compares a particular closing price to a range of prices over a specified period. This helps identify whether momentum is slowing or speeding up, offering a clear view of potential reversal points. When both the RSI and Stochastic Oscillator converge on signals, it increases the reliability of those signals in trading decisions.
Volatility-Based Trend Following: Supertrend
This component is used as confirmation by utilizing Average True Range (ATR) calculations to help traders stay in momentum-driven trades by providing dynamic support and resistance levels that adapt to volatility. This enables better risk management while allowing traders to capture stronger trends.
Volume Confirmation: Volume Delta
This component is used as confirmation by analyzing buying and selling pressure by measuring the difference between buy and sell volumes, offering critical insights into market sentiment. Significant volume behind a price movement increases confidence in the sustainability of that move.
🧠 Pro Tip:
When all 7 bars line up in green or red, it’s time to take action: load up for a confirmed move or sit back and wait for market confirmation. Let the Trend Meter guide your strategy with precision.
Conclusion:
Integrate the 7-Channel Trend Meter as useful confirmation for your TradingView strategy and stop trading like the average retail trader. This tool eliminates the noise and helps you stay focused on high-confidence trades.
