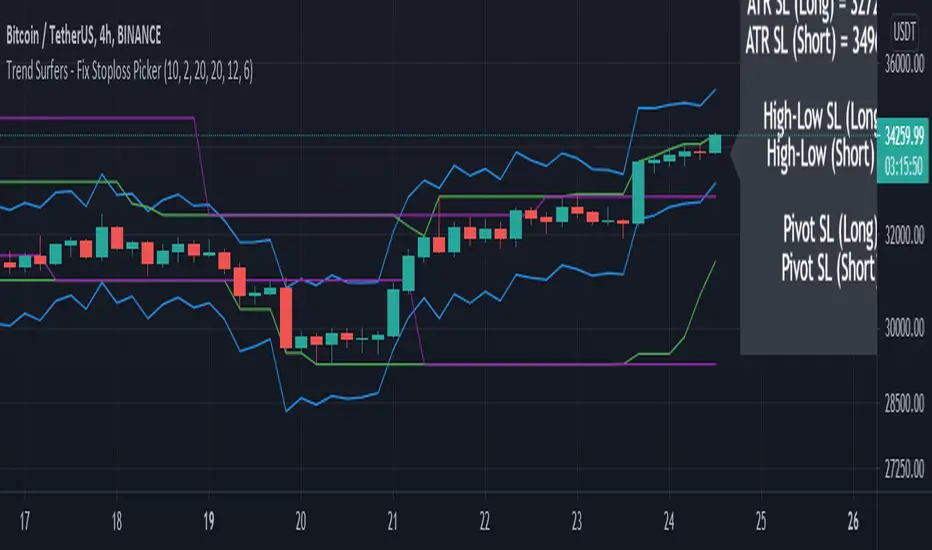
Trend Surfers - Fix Stoploss PickerThis study include 3 types of stop-loss (ATR, High/Low and Pivot point)
This script aimed to help new traders to respect risk management.
Simply select which stop-loss you would like to use in the settings and the suggested stop-loss will be displayed on the chart for Long and Short positions.
Please let me know in the comment if you would like me to add more indicators for the stop-loss in this script.
Hope you like it!
Stoploss
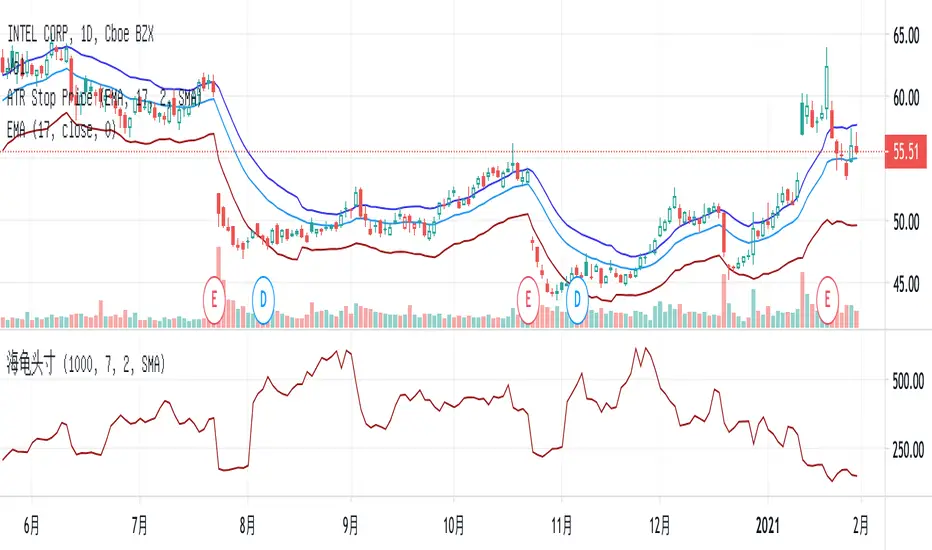
MA, MATR, ChEx | All in One - 4CR CUPIn trade position setup, we always need to determine the market structure and manage the position sizing in a short period of decision time. Indicators such as moving average, initial stop loss and trailing stop loss are always helpful.
This indicator put all these handy tools into a single toolkit, which includes the following price action and risk management indicators:
MA - Moving Average
MATR - Moving Average less Average True Range
ChEx - Chandelier Exit
This script further enhances the setting so that you can easily customize the indicators.
For both the Moving Averages and the Moving Average less Average True Range , you can pick a type of moving average which suits your analysis style from a list of commonly used moving average formulations: namely, EMA , HMA , RMA, SMA and WMA , where EMA is selected as default.
The Moving Average less Average True Range , MATR, is usually applied as a reference to set the initial stop loss whenever opening a new position.
The abbreviation, MATR, is picked, so that this can serve as a handy reminder of a very good trading framework as elaborates as below:
M – Market Structure
A – Area of Value
T – Trigger
R – Risk Management (aka. Exit Strategy)

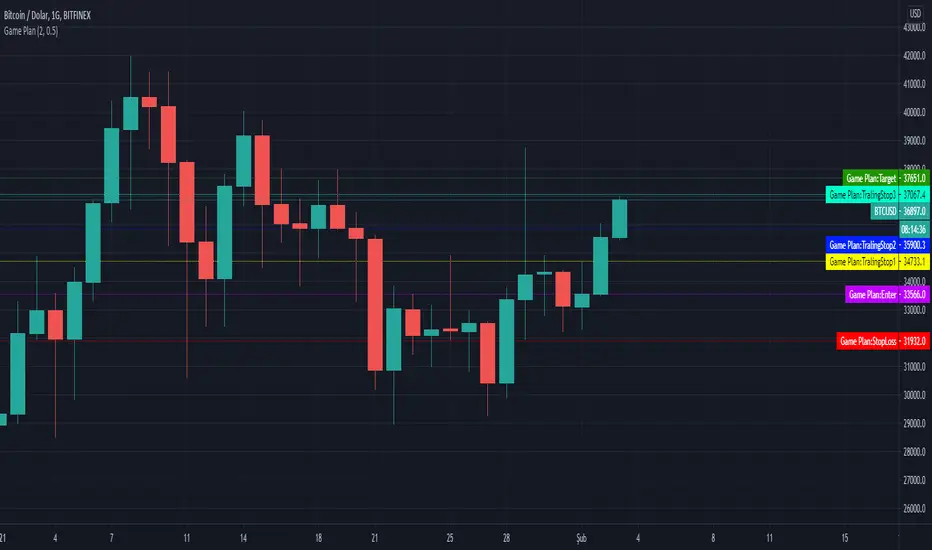
Game PlanAllows to automatically calculate Ali Persembe's, who wrote Teknik Analiz mi Dedin? Hadi canım sende, Game Plan Strategy
What is the Game Plan?
ALi Persembe claims, If you create a game plan for yourself and follow this plan completely, you will increase your profit. He tells that there is nothing to surprise you when your stop loss and target is determined in your game plan. You only need to follow this plan.
How does the indicator work?
It helps you determine your target price and stop point according to the risk ratio you will take on the basis of Atr, regardless of technical analysis.
The minumum risk ratio is calculated as 0.5 Atr according to the Atr 14 period. It automatically sets 2.5 times the risk ratio taken as your target price.
With this game plan, the more goals you reach by trading, the more profitable you will be. By reaching your target at risk ratio, you can determine the stops that follow the
Allows you to move your stoploss level up.
You can change your risk rate in the indicator settings. Minumum risk rate can be 0.5 maximum can be 5.
You can also choose the time you want to calculate your game plan from the indicator settings. Calculation can be made up to 100 bars before.
This indicator helps you to set a target on the basis of ATR, independent of technical analysis.
ATR Stop PriceSet stop price and add-position price according to the cost and current ATR.
You may set an alert with the condition when the stock price crossing down the Stop Price.
Example:
stock price: $150
volatility multiple: 2
current ATR: $3
stop price = $150 - $3 * 2 = $144
add-position price = $150 + $3 * 2 / 2 = $153
Stop Hunt (Nephew_Sam_)Finds and plots stop hunts / raids between fractal points.
If a candle wicks above/below a fractal and close back in its range, it will plot a line and/or dot based on preference.
Also able to filter a time period, meaning it will only plot if the stop hunt happened inside the time period.
Other options:
- Draw fractal points
- Choose between 3 or 5 bar fractal
- Set how far back you want to check for a stop hunt
- Change line color

Indicator - ATR Profit Loss - DGHi Traders,
This is an on chart indicator that can be used for setting take profit and stop losses very easily using the Average True Range Indicator (ATR). Using a volatility adjusted TP and SL will allow you to set your targets and losses based on market conditions. In the settings, you are able to adjust how much of a multiplier you require depending on your risk tolerance and strategy. For those that follow the NNFX method, the defult settings are preset to 1xATR TP and 1.5xATR SL.
How to use:
- For longs, 'isLong' box must be ticked, for shorts, this box is unticked
- For longs, green line is TP, red line is SL
- For shorts, red line is TP, green line is SL
Regards,
Dillon Grech

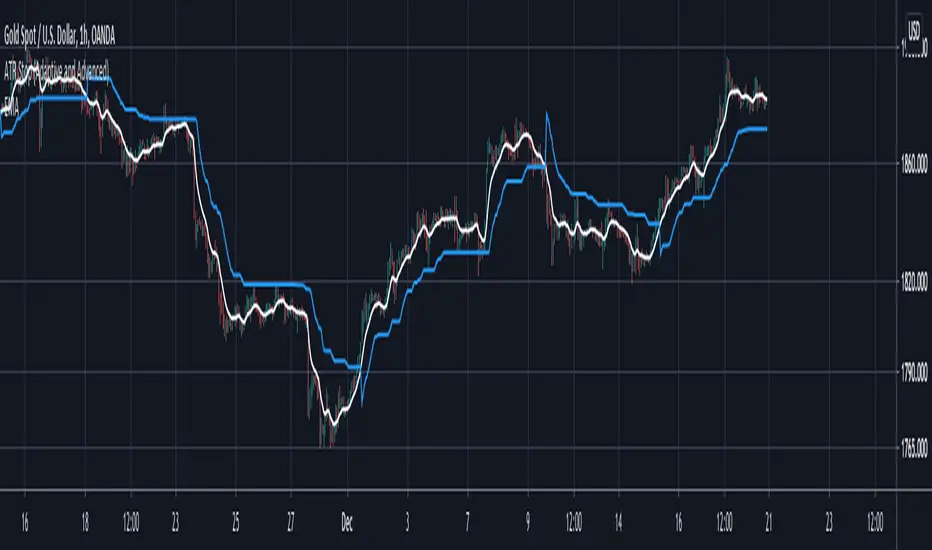
ATR Stop (Adaptive and Advanced)Hi everyone I am excited to share with you all a tool that has been in a lot of my research lately I and think would greatly benefit everyone.
In the last years I have fallen in love with ATR stoplosses/ stop and reverses. However all the ones offered in the community lacked the features that I wanted to have, so I built them all myself and want to share them with you all today!!!
Assuming that you are already familiar with ATR stops, here is what is new and improved with this version:
1. This script takes anything as an input! As you can see in the chart above I have used an EMA as an input into this script and this greatly smoothed out the results while still allowing for phenomenal entries with minimal whiplash. You can use this tool on anything now, from moving averages to oscillators.
2. Previous scripts were not adaptive, you can now choose how adaptive this script is! Increasing this number allows this ATR stop to follow price when it is running away so you don't have to give back much profit. Likewise it makes sure that the ATR stop slows down when the market is ranging so you wont get randomly stopped out.
3. You can now get it to start at the exact moment you enter your trade! Previous scripts had the ATR stop running forever which wasn't helpful if you only needed it for your own trades. You can now set it to start at the exact time of your trade if that is the only time you need it!
4. Now you can easily get alerts when the ATR stop gets hit.
Hope this helps you all!
SMA + Trend Strength + Trailing Stop LossThe 'SMA + Trend Strength + Trailing Stop Loss' indicator was designed for swing trading long positions over the course of days/weeks. The benefit of the indicator is to identify areas where the market of a given asset is showing signs of a strong uptrend, divergences, and fear. A 13-bar simple moving average is color coded to four colors based on 5 given conditions at a time, which are represented as a trend meter on the bottom right of the screen. A trailing stop loss indicator is included to secure your profits or limit your loss in case the market reverses on you unexpected. Please use this indicator responsibly with proper risk management, and never rely on the indicator by itself for buy and sell signals.
When the simple moving average color is green, it means that at least 4 of 5 conditions are confirming a move upwards, this is when you can take an entry into a trade based on your entry strategy. As the trend continues, the color will eventually change to yellow signaling a divergence. This is when you can use your exit strategy to find a good point to sell. It is wise not to take new positions when the color is trending yellow.
If the color changes from yellow to orange, that is a warning sign that the trend is about to change or has begun to change. Prices may have already fallen. However, sometimes the color will change from yellow back to green signaling a continuation of the trend. You can either keep holding or take a new position in this instance.
When the color is red, this signals fear in the market, you should stay out of the market at first. However, as the market consolidates and the color starts changing back to orange, this is an opportunity to take a long position at a reasonably low price.
Simple Moving Average (13-Bar) Color Explanation:
The colors change based on 5 market conditions represented in the trend meter.
Green: Strong Uptrend
Yellow: Divergence Present
Orange: Warning
Red: Fear
Trend Meter Explanation:
The trend meter draws 5 arrows indicating bullish or bearish presence.
LL = Lower Lows - Detects when the market is trending with lower lows.
HH = Higher Highs - Detects when the market is trending with higher highs.
MA = SMA Direction - A formula is used to determine the direction of the SMA.
DI = Directional Index - Identifies when upwards momentum is trending.
RSI = Relative Strength Index - Identifies when the RSI is in an uptrend state.
Note: For advanced users, this indicator has a hidden DMI(4, 4, 4) and RSI(14) indicator used to determine the last two conditions. The Directional Index is based on a DI Plus momentum moving average to determine a momentum trend and the RSI trending over 50 will constitute an uptrend signal as below 50 it will point down.
Trailing stop loss:
The trailing stop loss is determined based on the lowest price of the last 8 bars.
A gray step-line is drawn at the suggested stop activation price.
A red step-line is drawn at the suggested stop limit price.
When the price breaches the trailing stop, a red X will appear below the bar.
You can turn each of these features on or off based on your preference. Happy trading!

Percent Drop from Highest HighBuy and hold investors may decide to use trailing stops to protect profits and capital from market crashes, especially during bull markets.
The purpose of this indicator is to hep investors to identify a location to place them. The indicator plots the highest high from 'x' bars ago. It then plots a trailing stop loss 'y' percent below that line.
The indicator enables its users to input different 'x' and 'y' values to observe what they think works best for them in different markets.
Users might choose to pair the indicator with trend confirming indicators, such as moving average cross overs, to determine that the market is trending and not ranging.
There is no magic in this indicator, only maths. Like every indicator, it has no ability to predict anything. Just because the market is doing one thing now, it might do something different later. The past does not equal the present nor the future. Make your own decisions and be responsible for them.
All the best to you and your family.

Chandelier Exit | SAR/Long Only (4CUP)As introduced by StockCharts.com, Chandelier Exit was developed by Charles Le Beau and featured in Alexander Elder's books, this sets a trailing stop-loss based on the Average True Range (ATR).
Chandelier Exit can be formulated as a stop-and-reverse (SAR) or as a traditional trailing stop-loss version shown by Stockcharts.com.
The main difference is that, in SAR version, the indicator is usually formulated in a higher of previous or spot indicator (HPS) for long and lower of previous and spot indicator (LPS) for short position.
This indicator is coded to show both the SAR version and the traditional one shown by Stockcharts.com (for long position) by simply clicking a tick in the Version box.
The ATR multiplier is relaxed to allow non-integer input, like 3.5, 4.25, ... for a greater flexibility to tailor your best-fit exit strategy.
If you find this indicator is useful to you, Star it, Follow, Donate, Like and Share.
Your support is a highly motivation for me.
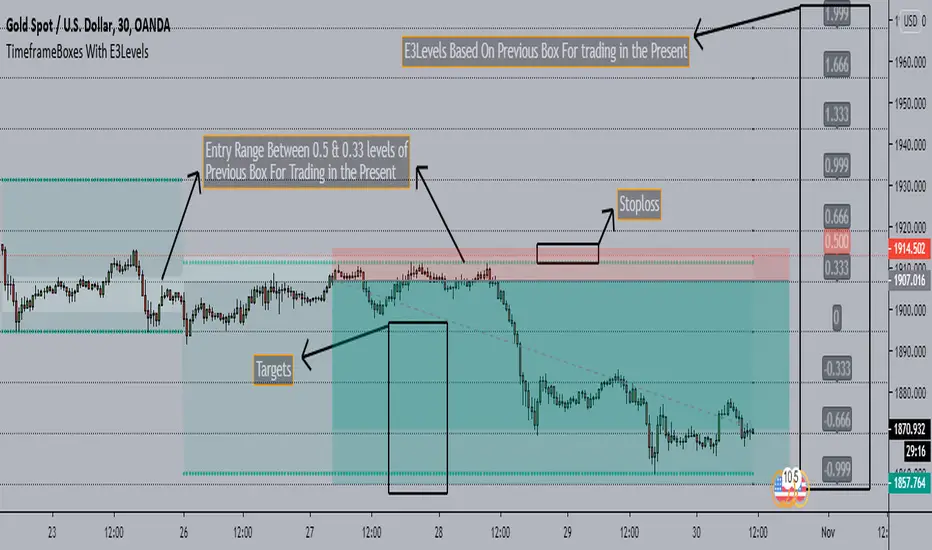
TimeframeBoxes(DailyBox) With E3Levels - SaeedKhakestar Method*** This is a Repaint Indicator that uses HIGH & LOW of Previous Range in the Custom Period(12H,1D,2D,3D & Weekly) for Trading In the Present with E3 Levels
TimeframeBoxes(DailyBox) With E3Levels - SaeedKhakestar Method
Version 1.00
Created by TWA_TradeWithAmir(TWA_PriceActionTips)
Updated 10/29/2020
Based On SaeedKhakestar Method(Trigger Price Action)
*With Entry Range
*With E3 Levels
*12H,1D,2D,3D & Weekly Boxes
*Entry Range & E3 Levels Belongs to Previous Box
*TRex Method
TBT Stop Loss Hunting AlertPurpose:
The TBT Stop Loss Hunting Alert is a simple early warning system that indicates when Bitcoin could have unexpected volatility (in either direction) within a 24 to 48 hour time frame as you can see above (indicated by the red bar/column in the indicator lane). By knowing when there could be possible upcoming volatility for the price of Bitcoin, traders can take preventative measures to protect open positions to preserve profits.
Time Frame:
While you can view this indicator on any time frame, it was originally created with the 6-hour time frame in mind. Because of this, the indicator can be set to "same as symbol" (the indicator will adapt to any time frame you use) or "6 hours" (the original and intended time frame). Please understand that the alert will show "noise" (false positive signals) on faster (lower) time frames. This is another reason to keep the indicator on the 6-hour time frame in its settings.
Metrics:
The TBT Stop Loss Hunting Alert looks at sudden/unexpected changes in price action, volatility, and volume.
Realistic Expectations:
While this indicator is effective in alerting users when there could be sudden volatility for Bitcoin, note that there is no way to know which way Bitcoin will move after the alert is triggered. The frequency of alerts is few and far between, but in a way this is a good thing. When the signal is triggered, it is a great early warning system to remember to be careful for the next 24 to 48 hours.

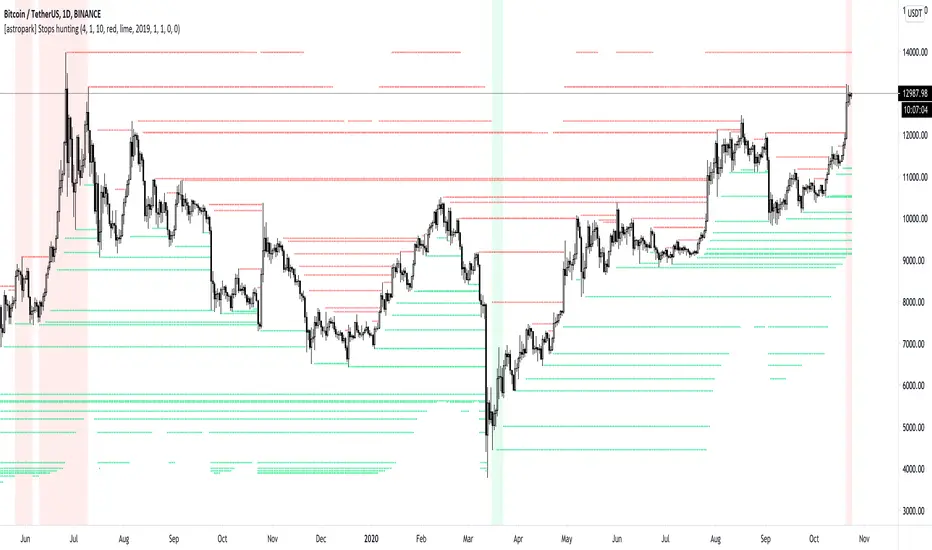
[astropark] Stops huntingDear Followers,
today I'm happy to share with you my Stops Hunting indicator.
This indicators draws lines on important levels, where traders are supposed to set their own stop loss orders .
As per default values you will see
sellers (short) stoploss prices as red lines
buyers (long) stoploss prices as green lines
Market maker move prices towards liquidity, so to hit common traders stoplosses.
Why it acts this way? because stoplosses become fuel for market maker to move price where it wants to, and after latest stoplosses were triggered, then it uses this fuels to make trend reverse to the opposite direction.
To highlight this mechanism, the indicator plots:
red background when there are (almost) no-more sellers' stop losses still to be hit, so the trader can start thinking about opening a sell/short position ,
green background when there are (almost) no-more buyers' stop losses still to be hit, so the trader can start thinking about opening a buy/long position .
This indicator:
works on every timeframe , so it can be used for both swing and scalping trades
has a bias filter to increase or decrease the bullish/bearish backgrounded ranges (the higher the value, the less the width of ranges)
lets you change colours as you like
lets you enable/disable plotting of lines
lets you change lines' thickness and transparency
lets you enable/disable plotting of circles whenever a stoploss is hit
lets you set a starting date/time from which you want the indicator to start its analysis and collecting data for stops hunting
lets you set alerts when a stoploss has been hit/hunted
lets you set alerts when background starting be coloured as explained above
A gentle reminder: always consider setting a stoploss in trades and use a proper money and risk management strategies .
Here there are some examples how the indicator works on many timeframes and markets:
BTC/USDT 1h
LINK/BTC 1h
ETH/BTC 1h
EUR/USD 15m
GBP/USD
Brent Crude Oil 15m
GOLD (XAU/USD) 15m
FaceBook (FB) 15m
Microsoft Corp (MSFT) 15m
This is a premium indicator , so send me a private message in order to get access to this script .
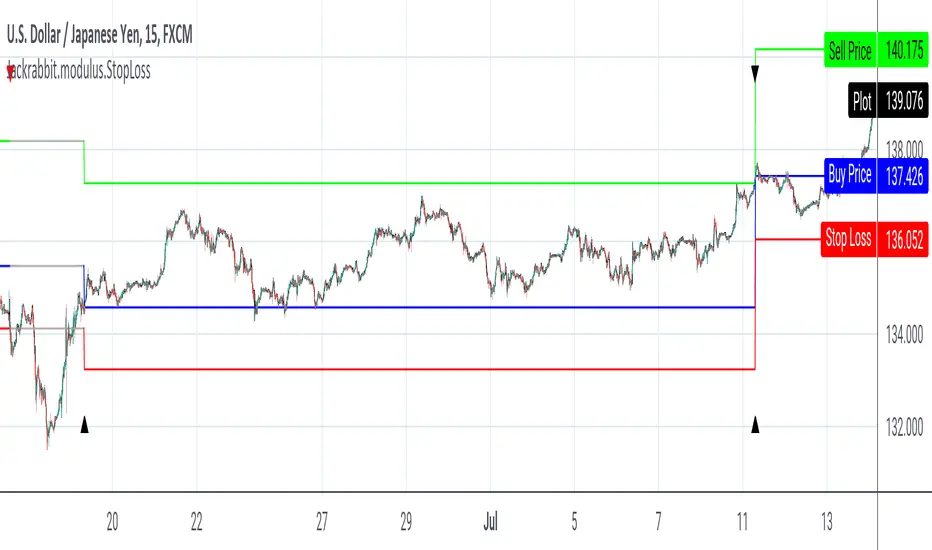
Jackrabbit.modulus.StopLossThis is an algorithic stop loss for the Jackrabbit suite and modulus framework.
This module is not a standalone and relies on previous modules to send a signal data in order to function properly. This module acts on buy and sell data from within the indicator on indicator framework that TradingView supports.
This module is NOT a substitute for a flat percentage based stop loss provided by trading platforms and many exchanges. This is an algorithic approach that is designed to follow the market. Such a methodology has been proven by many traders to help mitigate risk.
This module sets a risk/reward ratio to which a modified ATR is used to determine the stop loss and take profit. Note that the take profit can also be on the basis of the strategy sell markers. A multiplier and a look back are user configurable to help tune the module for more favorable results.
It is important to remember that this module does NOT allow accumulation, so your buying strategy will need to be surigical in nature to maximize your profits.
The Jackrabbit modulus framework is a plug in play paradigm built to operate through TradingView's indicator on indicatior (IoI) functionality. As such, this script receives a signal line from the previous script in the IoI chain, and evaluates the buy/sell signals appropriate to the current analysis.
This script is by invitation only. To learn more about accessing this script, please see my signature or send me a PM. Thank you.
ATR Stop Loss IndicatorIt’s very simple – all it does is calculate your stop loss with trailing stop price.
How It Works
Blue is the current ATR (pips).
Green is your trailing stop-loss price for Long
Red is your trailing stop-loss price for Short .
Settings
ATR Length:
Your ATR Length
Multiplier:
ATR multiplier.
For example, if you want to use a 2x ATR stop, set to 2.

Buy/Sell/TP/SL/TSL Alerts ModuleThis tool is not a self-sufficient indicator, just an attachable module that allows you to enhance a specific indicator with risk management components without having a headache.
What you need to do, and actually this is the most important step, is to rewrite your indicator to a buy-sell signal form which will output only -1, 0, 1 values and then connect it to the module.
After that the module gives you a lot of possibilities to customize Take Profit, Stop Loss and Trailing Stop Loss levels through the settings window and to set all the alerts you need up.
Simple Buy/Sell setup for the RSI:
Now I am adding Stop Loss:
and Take Profit:
and finally Trailing Stop Loss:
Okay, I have shown how it works with RSI signals. Here is example for the MACD:
and example for the WaveTrend Oscillator:
If you have any questions don't hesitate to ask and contact me either via private messages on TradingView or via Telegram

Stop Loss PanelHere is a label panel that shows the stop-loss number for Long or Short trades based on volatility using average true range and and a mult of that.

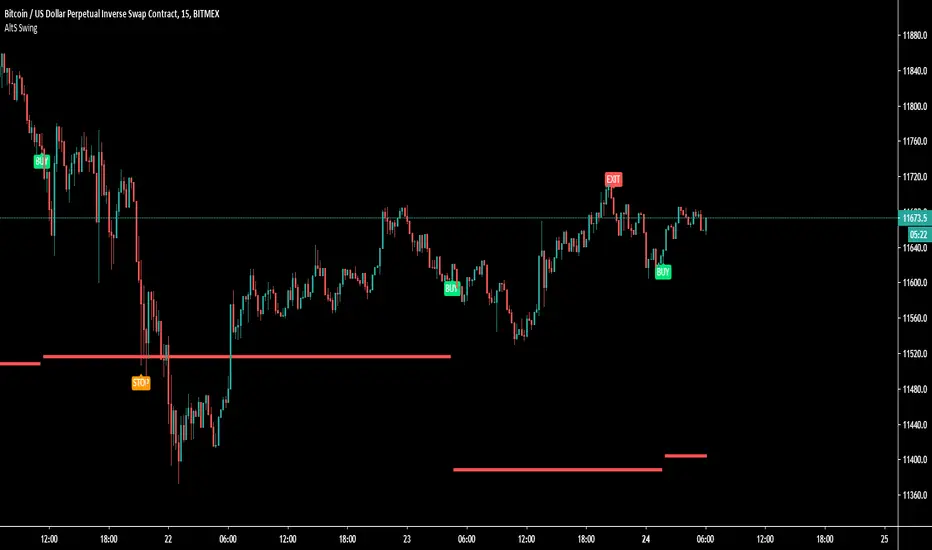
AltS Swing (INV)
PLEASE READ THIS DESCRIPTION TO SAVE TIME AND UNDERSTAND WHAT THIS INDICATOR DOES
This is a official version of AltSignals Long/Short Reverse Indicator
Description:
This indicator uses various indicators in combination with each other, some of the key ones to mention is Hulls, EMA , MA. Along with that it uses EMA crossovers to get the precise entries and exits.
The recommended time frames with this indictor are shorter ones, for example 5m,10m,15m work well, along with that I have found that some of the more unique time frames also work well such as 20m,45m,2hr and so on.
This indicator is not super advanced but it's still very powerful, with only 130 lines of code.
This indicator works on every chart, time, and candle type but you must play with the settings to find what is best, the same setting will not work on every pair etc.
With AltSignals Swing Indicator it trades one way, that means it gives 3 pieces of information. BUY/TakeProfit/StopLoss.
Unlike most indicators which Buy and Sell both ways this one focuses on one direction of trading so please take into account when using this.
I have added in a reverse strategy which basically shows the opposite values of of the buy, so if you select the box in the settings and un-tick it, then it will show opposite directions so sells only.
This feature is very useful especially in general bear markets when buying is difficult.
I have also added in the option for no stop losses to be used, if you set the stop loss value = 100 then it will show no stop losses.
I suggest a stop loss somewhere in the region of 1-2-3%, please note that you can use decimal stop losses too so for example 0.1 or 0.5.
This indicator is NOT a once size fits all, every chart is different, time frame and candles also, so i would suggest spending some time going through and playing with the channel length settings, which will change the EMA numbers.
Using this along with the back script to find the ideal settings is the best way to use this script, once you have done that make sure to save those values somewhere.
Its important to remember that the Regular script and the back testing script values should be the same for them to match up on the chart, so the channel lengths, stop losses and so on values should be the same.
Side note
This is not financial advice.
We will continue making updates as time goes on.
If you would like to try this script for free please visit our website or message us on Tradingview live chat.
Shenlong V2.3 - Trend cycleShenlong V2 is a script developed to facilitate the interpretation of long and short entries according to various conditionals that play with the trend.
The use of trend clouds has been implemented, which can be used as dynamic support / resistance . They also allow us to identify the current price cycle according to these guidelines, marking with a LONG or SHORT depending on the cycle in question. The appearance settings are user configurable. You can set alerts (long o short) to be aware of movements.
The use of recommended stop loss has been implemented, this can be used as a trailing stop to ensure profits or give the possibility of catching the trend, since it will move as the price forms its structure.
An information panel on stop prices has been implemented for ease of use.

Triple ATR multiplier - 3 ATR Values in OneHere you can choose to plot 3 different ATR values in 1 window. I use this indicator to get the values of my stop loss and take profits.
You can change the multiplier value for each ATR Line and the length of the base ATR.
Ty

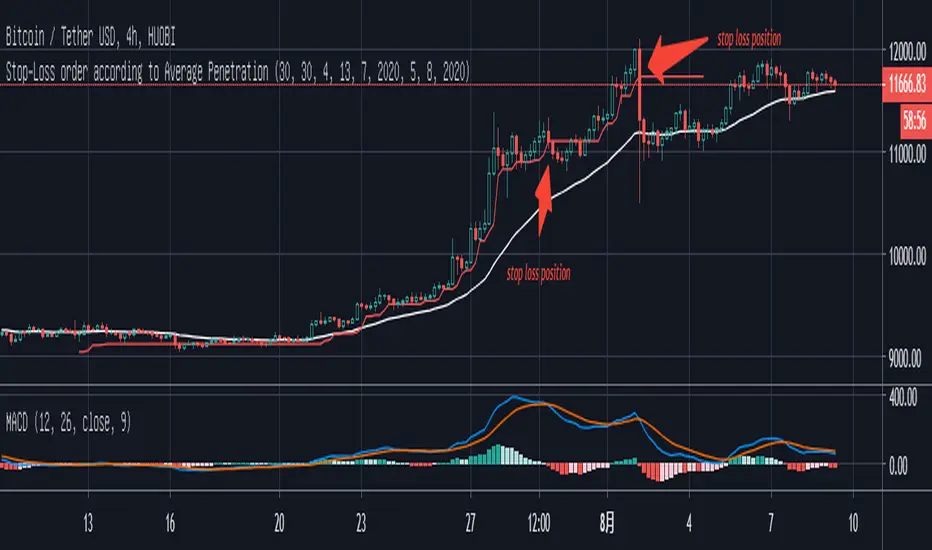
Stop-Loss order according to Average PenetrationAs a engineer, the view of signal and noise in the book of "Trading for a living"really interests me. For a trader the biggest issue is when should we enter and exit the market. The view of safety range stop loss may help to solve this problem for some beginner and give you a new idea of stoploss for you trade system
Here is the content from Trading for a Living
you may use the slope of a 22-day EMA to define the trend. You need to choose the length of the lookback period for measuring noise level. it has to be long enough to track recent behavior but short enough to be relevant for current trading. A period of 10 to 20 days works well, or we can make our lookback period 100 days or so if we want to average long-term market
if the trend is up, mark all downside penetrations during the look-back period, add their depths, and divide the sum by the number of penetrations。 This gives you the Average Downside Penetration for the selected look back
if today's low is lower than yesterday's, do not move your stop lower since we are only allowed to raise stops on long positions, not lower them
Reverse these rules in downtrends. When a 22-day EMA identifies a downtrend, count all the upside penetrations during the look-back period and find the Average Upside Penetration. Multiply it by a coefficient, starting with two. When you go short, place a stop twice he Average Upside Penetration above the previous day's high. Lower your stop whenever the market makes a lower high, but never raise it.
The important thing when you make an order is to hold your earning during a trending scenario. To avoid stopping loss by the variance in the market and to avoid big loss if the market shift to another direction in a short time.
From the graph there, I select the most recent trend up period in the Bitcoin and adjust the parameters according to this trend.
As you can see, the stop loss is away from the lowest price in bar, so that you will not be forced to exit the trade by small turbulence. You can hold your order and need to worry about missing the trend. But there are always sharp plunges in the uptrend. you can see two cursors on the graphic. The stop loss will help you avoid this plunge.
But in my opinion, this will be the hard stop loss in your trade. Help you to keep profit and avoid big loss. To maximize the profit, you had better to build you own strategy.
When I try to create this indicator, it is found that two rule for this indicator
1. you had better to use it in a clear trend range. Since the stop loss can only be higher in a long condition and lower in a short condition. If you use it in a volatile market., then stop loss doesn’t make any senses.
2. you need to adjust those parameters according to the market and the trend you are in. Some people like to avoid big loss, you can set them this depending on you experience
Last, this is getting from the view in the book, i didn’t do any back test for it. So please be careful to use it and let me know if you have any suggestions or ideas.
MACD VWAP IndicatorThis indicator uses a combination of the VWAP, EMA 9 and parts of the MACD in order to detect a bullish or bearish trend.
How to trade it:
Set SL either below or above the VWAP line (orange) and TP to 1:1.5 ratio (depending on last few candles, of course).
If EMA200 is close by then place SL either below or above EMA200 (blue) and TP to 1:1.5 ratio
Important:
Best traded in 15M, 30M => Intraday.
Have fun! :)
