Calculus Free Trend Strategy for Crypto & StocksObjective :
The Correlation Channel Trading Strategy is designed to identify potential entry points based on the relationship between price movements and a correlation channel. The strategy aims to capture trends within the channel while managing risk effectively.
Parameters :
Length: Determines the period for calculating moving averages and the true range, influencing the sensitivity of the strategy to price movements.
Multiplier: Adjusts the width of the correlation channel, providing flexibility to adapt to different market conditions.
Inputs :
Asset Symbol: Allows users to specify the financial instrument for analysis.
Timeframe: Defines the timeframe for data aggregation, enabling customization based on trading preferences.
Plot Correlation Channel: Optional input to visualize the correlation channel on the price chart.
Methodology :
Data Acquisition: The strategy fetches OHLC (Open, High, Low, Close) data for the specified asset and timeframe. In this case we use COINBASE:BTCUSD
Calculation of Correlation Channel: It computes the squared values for OHLC data, calculates the average value (x), and then calculates the square root of x to derive the source value. Additionally, it calculates the True Range as the difference between high and low prices.
Moving Averages: The strategy calculates moving averages (MA) for the source value and the True Range, which form the basis for defining the correlation channel.
Upper and Lower Bands: Using the MA and True Range, the strategy computes upper and lower bands of the correlation channel, with the width determined by the multiplier.
Entry Conditions: Long positions are initiated when the price crosses above the upper band, signaling potential overbought conditions. Short positions are initiated when the price crosses below the lower band, indicating potential oversold conditions.
Exit Conditions: Stop-loss mechanisms are incorporated directly into the entry conditions to manage risk. Long positions are exited if the price falls below a predefined stop-loss level, while short positions are exited if the price rises above the stop-loss level.
Strategy Approach: The strategy aims to capitalize on trends within the correlation channel, leveraging systematic entry signals while actively managing risk through stop-loss orders.
Backtest Details : For the purpose of this test I used the entire data available for BTCUSD Coinbase, with 10% of capital allocation and 0.1% comission for entry/exit(0.2% total). Can be also used with other both directly correlated with current settings of BTC or with new ones
Advantages :
Provides a systematic approach to trading based on quantifiable criteria.
Offers flexibility through customizable parameters to adapt to various market conditions.
Integrates risk management through predefined stop-loss mechanisms.
Limitations :
Relies on historical price data and technical indicators, which may not always accurately predict future price movements.
May generate false signals during periods of low volatility or erratic price behavior.
Requires continuous monitoring and adjustment of parameters to maintain effectiveness.
Conclusion :
The Correlation Channel Trading Strategy offers traders a structured framework for identifying potential entry points within a defined price channel. By leveraging moving averages and true range calculations, the strategy aims to capture trends while minimizing risk through stop-loss mechanisms. While no strategy can guarantee success in all market conditions, the Correlation Channel Trading Strategy provides a systematic approach to trading that can enhance decision-making and risk management for traders.
Hisse

USD Liquidity Conditions Index Swing Stock Strategy Original credits goes to @ElDoggo22 www.tradingview.com
I looked in the post created by him, of USD liquidity and I have noticed that if you are going to apply a percentile top and bottom to it, can become an interesting swing strategy for US Stocks.
So in this case I decided to create a 99th percentile for top and 4th percentile for bot with a big length, preferably 100+ candles, for this example i took 150.
Rules for entry :
Long : either bot or top lines are ascending
We exit long either the top line is descending, or we have sudden cross of the moving average with both top and bot within the same candle
Short: we enter short when we have a sudden cross down of the moving average with both top and bot within the same candle
We exit short when we have a cross over of the moving average with both top and bot within the same candle ( or we have a long entry condition)
If there are qny questions, please let me know !

Ultra Moving Average Rating Trend StrategyThis is a technical analysis strategy based initially on the rating strategy, but fully adapted and converted to moving average rating.
In this case we are using: Ichimoku, SMA, EMA, ALMA, SMMA, LSMA, VWMA, DEMA, HMA, KAMA FRAMA, VIDYA, JMA, TEMA, ZLEMA, TRIMA and T3 moving averages.
With all of them together I am making an index.
Rules for entry and exit:
If % percentage of all the moving averages is telling to go long , we go long or exit short. And viceversa for short.
If there are any questions, please let me know !

Stock Gaps SPY Correlation StrategyThis is daytrade stock strategy, designed to take the best out of the daily gaps that are forming between the close of previous day and opening of present day.
At the same time its logic has been adapted for SPY chart, in order to use correlation with the other stocks/assets/ etf which are linked with SP500 movement.
Lastly it has been added 2 new confirmation logics, based on the USI: advance/decline chart and percentage above vwap among all US stocks.
The rules for entry are simple :
We are at the opening daily candle, we have a long/short gap based on where the opening is happening and at the same time we are checking to see that the current different between the current difference between low and previous high (or viceversa) is higher than an established parameter(minimal deviation )
For exit, we exit based on time/clock parameter, in this case by default I selected 1h and half before close of the US session.
For testing purposes I have used 10% of the available capital, with a 0.0035$ comission per each share bought ( IBKR comissions)
If there are any questions, please let me know either here or in private !

Swing Trading SPX CorrelationThis is a long timeframe script designed to benefit from the correlation with the Percentage of stocks Above 200 moving average from SPX
At the same time with this percentage we are creating a weighted moving average to smooth its accuracy.
The rules are simple :
If the moving average is increasing its a long signal/short exit
If the moving average is decreased its a short signal/long exit.
Curently the strategy has been adapted for long only entries.
If you have any questions let me know !

Gap Absorption StrategyLike the nature, markets don't like the void, and this is something we can take advantage of by trading gaps on some markets.
This technique is well known, so I wanted to write a tiny script based on this strategy to get a bit more comfortable with it.
IMPORTANT: Default parameters wont give you good trades on every markets, you need to modify these parameters to see which proportions correspond to the stock you're trading.
This script triggers signals on predefined variation of a stock price after a gap, and allows its user to configure TP and SL prices corresponding to a specific percentage of this gap movement.
Note: We can observe that opening gaps are often the most interesting.
Options
Trigger: the price variation you want to trigger on (in % of the price)
Stop Loss : in % of the gap
Take profit : in % of the gap
A small table is displayed in the top right corner of the chart to give you TP/SL/Signal prices for each opportunity
SL (red line) and TP (green line) are also displayed on the chart when a signal is triggered
Information concerning the current opportunity is given at the bottom of the chart
Note: This script is based on the Gap-Size-Indicator that I published a few weeks ago.

Contrarian Scalping Counter Trend Bb Envelope Adx and StochasticContrarian Scalping is an trading strategy designed to take advanted of a counter-trend.
The advantage of these strrategies types is that they have a good profitability but with do not great gain (in relation at the time frame).
Indicators used:
Bollinger
Envelope
ADX
Stochastic
Rules for entry
For short: close of the price is above upper band from bb and envelope, adx is below 30 and stochastic is above 50
For long: close of the price is below lower band from bb and envelope, adx is below 30 and stochastic is below 50
Rules for exit
For short: either close of the candle is below lower band of bb or enveloper or stochastic is below 50
For long: either close o the candle is above upper band of bb or envelope or stochastic is above 50
If there are any questions let me know !

RSI Average Swing BotThis is a modified RSI version using as a source a big length(50 candles) and an average of all types of sources for candle calculations such as ohlc4, close, high, open, hlc3 and hl2.
In this case we are going to use a 0-1 scale for an easier calculation, where 0.5 is going to be our middle point.
Above 0.5 we consider a bullish possibility.
Below 0.5 we consider a bearish possibility.
I made a small example bot using that initial logic, together with 2 exit points for long or short positions.
If there are any questions, let me know !

Swing Multi Moving Averages Crypto and Stocks StrategySimple and efficient multi moving average strategy combined with risk management and time condition.
Indicators/ Tools used
Multi selection moving average type like SMA , EMA , SMMA , VWMA , VIDYA , FRAMA , T3 and much more
Limit 1 entry max per week, entry on monday exit on sunday or risk management tp/sl.
Rules for entry:
LONG:Close of the candle cross above the moving average while the previous close was below. All of this is happening during monday session.
SHORT:Close of the candle cross below the moving average while the previous close was above. All of this is happening during monday session.
Rules for exit:
We exit either on sunday or if we reach tp/sl levels.
Observations:
I recommend use the strategy 2 types, one for long and another for short, using different parameters since long and short movements behave differently.
For example for long we can use a shorter moving average longth and a higher tp/sl while for short we can use a bigger moving average length and a smaller tp/sl
If you have any questions let me know !

Swing VWAP Crypto and Stocks StrategyThis is a strategy designed for swing trading on markets such as crypto and stocks.
Its components are:
VWAP
Time Management
Risk management
Rules for entry:
We entry only on Monday, if our close of the candle crossed above VWAP
Rules for exit
We exit always on Sunday or if we either hit the TP/SL levels.
If you have any questions let me know

Scalping Trading System bot Crypto and StocksThis is a trend trading strategy scalping bot that can work with any type of market. However I concluded my tests so far with Crypto, Stocks and Forex, and with optimizations always could be found some profitable settings.
Indicators
SImple Moving Average
Exponential Moving Average
Keltner Channels
MACD Histogram
Stochastics
Rules for entry
long= Close of the candle bigger than both moving averages and close of the candle is between the top and bot levels from Keltner. At the same time the macd histogram is negative and stochastic is below 50.
short= Close of the candle smaller than both moving averages and close of the candle is between the top and bot levels from Keltner. At the same time the macd histogram is positive and stochastic is above 50.
Rules for exit
We exit when we meet an opposite reverse order.
This strategy has no risk management inside, so use it with caution !

[astropark] Trend Skywalker V2 [strategy]Dear Followers,
today I'm glad to present you Trend Skywalker V2 , the evolution of Trend Skywalker V1 indicator that you can see here below:
This indicator works on every timeframe and market, it's quite responsive to market movements, so it's especially good on volatile markets.
In this new version you have 3 trend clouds available :
a short-term one (yellow)
a mid-term one (green)
a long-term one (blue)
You can also enable an option to show all trend clouds as one, the result will be similar to a special bollinger bands tool.
Of course you can edit trend clouds analysis period and color, also you can turn on or off the cloud that you prefer.
The indicator can run 4 different kinds of strategy : one for each trend cloud individually or a mixed one.
Also the indicator tracks for you a peak profit from entry: this tracker is a suggestion for you to take profits while price goes up!
All red-green circles you see in the chart is a reminder that a peak profit label was there in the past: what does this tell you?
if price starts losing the short-term trend and you had a lot of TP suggestions, maybe trend ended and you should start consider closing your trade before you give back all your profit.
On backtesting you can you test long and short setups individually or both, as well as performance in a specific time window.
This is a premium indicator , so send me a private message in order to get access to this script.

Daily HIGH/LOW strategyThis is a DAILY High/LOW strategy combined with a moving average and volume for more accuracy.
The rules are simple :
For long if we had a cross of the high with the previous high and close of the candle is above moving average and chaikin money flow volume is positive we have a long entry.
We exit when we cross down the moving average with the close of the candle.
For short if we had a crossdown of the low with the previous low and close of the candle is below moving average and chaikin money flow volume is negative we have a short entry.
We exit when we cross above the moving average with the close of the candle.
This strategy has no risk management inside so use it with caution.
If you have any questions, let me know

Average Highest High and Lowest Low Swinger StrategyThis is a full price action strategy designed for trending markets such as crypto and stocks.
Its purely made on calculations for the highest high and lowest low using 2 different length , a faster and a slower one.
With those we make multiple averages.
Rules for entry:
For long: our close of the candle is above both the average using fast and slow line
For short: our close of the candle is below both the average using fast and slow line
Rules for exit
We always exit when we have an opposite order
Caution
This strategy use no risk management system, so be careful with it
If you have any questions, let me know

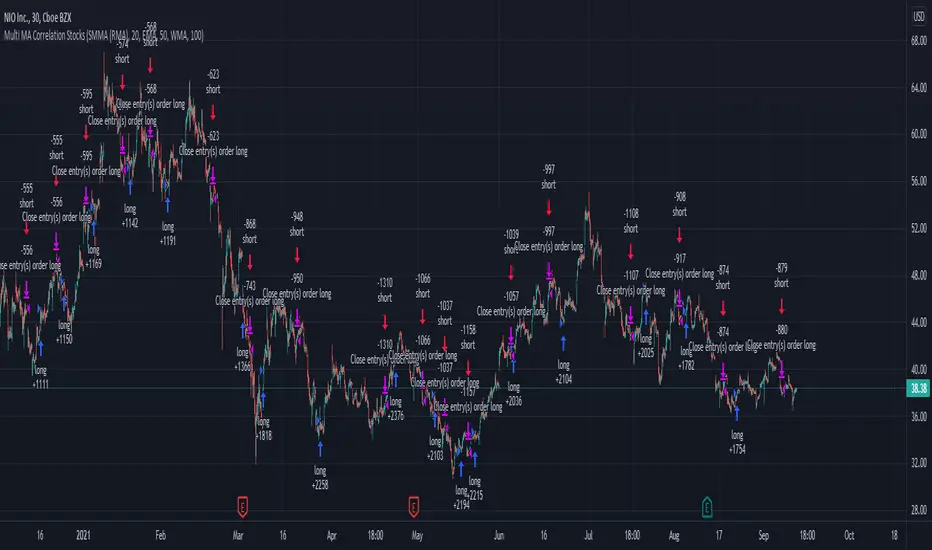
Swing Stock Market Multi MA Correlation This is a swing strategy adapted to stock market using correlation with either SP500 or Nasdaq, so its best to trade stocks from this region.
Its components are
Correlation Candle
Fast moving average to choose from SMA , EMA , SMMA (RMA), WMA and VWMA
Medium moving Average to choose from SMA , EMA , SMMA (RMA), WMA and VWMA
Slow moving average to choose from SMA , EMA , SMMA (RMA), WMA and VWMA
Rules for entry
Long: fast ma > medium ma and medium ma > slow ma
Short: fast ma< medium ma and medium ma < slow ma.
Rules for exit
We exit when we receive an inverse condition.
Caution:
This strategy use no risk management inside, so be careful with it .
If you have any questions, let me know !
Improved Bollinger Swing Strategy Stock NasdaqThis is an improved bollinger band strategy adapted to Nasdaq Index/Stocks.
The new update include a multiple logic calculation BB adapted for long and short, together with a risk management using movement in %.
Rules for entry
For long we have a crossover between the close and the lower band from the bb
For long we have a crossover between the close and the upper band from the bb
Rules for exit
We exit when we either find a reverse condition, or if we hit the take profit/stop loss levels.
If you have any questions, let me know !

Swing VWAP Weekly Stock and Crypto StrategyThis is a simple yet very efficient swing strategy designed for crypto and stock market, using big timeframes.
Its main component is VWAP weekly, so for best scenarios its better to use big timeframes such as 8h+.
The rules for entry are simple:
If our close if above vwap weekly we enter long .
If our close is below vwap weekly we enter short.
We exit from the trade, when a reverse condition than the entry one is triggered.
Because this strategy has no risk management inside, I recommend to be careful with it.
If you have any questions, let me know

High/Low Channel Multi averages Crypto Swing strategyThis is a swing strategy designed for trending markets such as crypto and stock, with big timeframes , like 8h.
For this strategy we take SMA, EMA, VWMA, ALMA, SMMA, LSMA and VWMA and make an apply them all to both HIGH and LOW separately and make 2 averages, 1 applied to high and the other applied to low.
With them we make a channel.
Rules for entry
For long: close of a candle is above avg applied to high.
For short: close of a candle is below avg applied to low.
Rules for exit
We exit when we either hit TP or SL or when we receive a different condition than the entry one.(long- > short and viceversa)
If you have any questions, let me know !

Stock trending strategy This is a long only strategy designed maily for stock markets and futures. In general it works best with 1h, however it can be optimized with other timeframes as well.
Components:
VWAP
MACD histogram
EMA 9
Rules for entry
Long :
For VWAP: close is above the vwap daily
EMA: close is above the moving average
MACD histogram is above 0
Short:
For VWAP: close is belowthe vwap daily
EMA: close is below the moving average
MACD histogram is below 0
Rules for exit
This strategy does not have any risk management inside. Instead it exits whenver it receives an opposite signal form the original one used for entry.
If you have any questions let me know !

Ichimoku with MACD/ CMF/ TSIThis is a very powerful trend strategy designed for markets such as stocks market , stock index and crypto.
For time frames I found out that 1h seems to do the trick.
Components:
Ichimoku full pack
MACD histogram
CMF oscillator
TSI oscillator
Rules for entry
Long :
For Ichimoku:Tenkan part of cloud is bigger than kijun, Chikou is above 0 , close of a candle is above the Senkou
MACD histogram is above 0
CMF oscillator is positive and bigger than 0.1
TSI oscillator is above 0
Short:
For Ichimoku:Tenkan part of cloud is smaller than kijun, Chikou is below 0 , close of a candle is belowthe Senkou
MACD histogram is below 0
CMF oscillator is negative and below -0.1
TSI oscillator is below 0
Rules for exit
This strategy does not have any risk management inside. Instead it exits whenver it receives an opposite signal form the original one used for entry.
If you have any questions let me know !

Supertrend LSMA long StrategyThis is a long strategy which combines Super trend indicator with LSMA moving average.
In general it tends to works better with long trending markets such as stocks and cryptos using a big timeframe.
The rules are simple
Long entry:
Supertrend is telling us to go long and close of a candle is above moving average
Long exit:
Supertrend is telling us to go short
IF you have any questions, let me know !

Pivot Reversal strategy long onlyPivot Point Reversal Strategy
Pivot point reversal strategy is based on the first support level’s price action during the bullish trend and the first resistance level during the bearish trend . Traders follow the main trend and enter into the trade after reversal analyzing pivot point levels.
This version is an upgraded version, combining the initial pivot point reversal strategy together with one of the most accuracy moving average in my opinion for day trade, the Least square moving average.
At the same time I applied an option to backtest using a date range and a leverage calculator.
The default options are optimized for BTC /USDT 2H charts, using 0.1% comission fee.
If you have any questions, let me know

Vwap mtf Swing Stock StrategyThis is a trending strategy designed for stock market, especially long trending assets such as TSLA, NIO, AMAZON and so on.
Its made of volatility bands and weekly VWAP, in this case daily and weekly.
This strategy has been adapted to go long only.
Rules for entry
For long , we want to enter close of a candle is above vwap weekly, and at the same time the close of a candle cross-under the lower volatility band.
For exit , we want to enter close of a candle is below vwap weekly, and at the same time the close of a candle cross-over the upper volatility band.
This strategy does not have a risk management inside, so use it with caution.
If you have any questions, let me know !
